A Journey Through Halving Events, Fear & Greed DynamicsMastering Bitcoin’s Market Cycles: A Journey Through Halving Events, Fear & Greed Dynamics, and FOMO Surges
Hello everyone,
Over the years, I’ve dedicated countless hours to studying Bitcoin’s price movements across multiple timeframes, focusing on the interplay between supply and demand, greed and fear, and the ever-pivotal halving cycles. From my earliest analysis in April 2019, where I laid out the foundational trendlines and the importance of the halving setup, to the more recent explorations of Bitcoin’s FOMO Cycles, I’ve sought to decode the complex mechanisms driving this revolutionary asset.
The Foundation: April 2019 Analysis
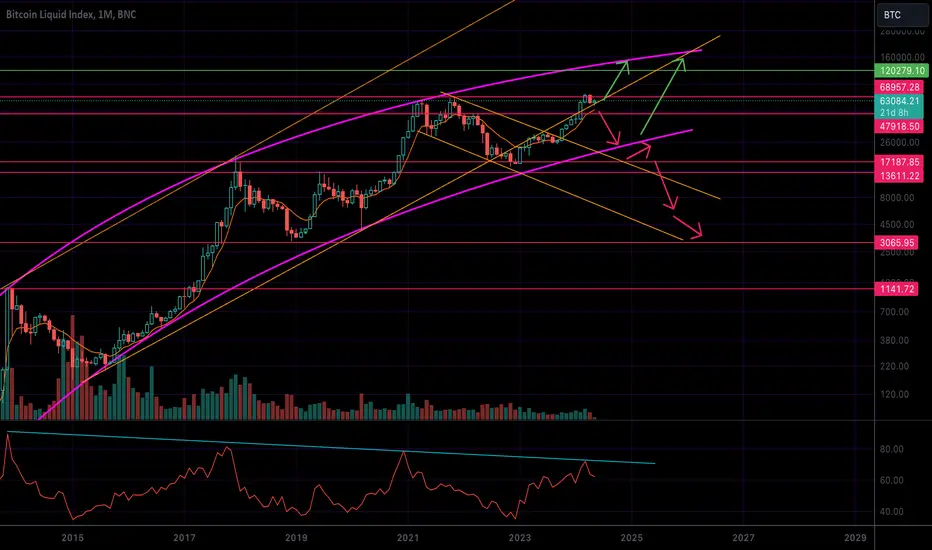
In April 2019, I introduced a chart that I considered to be the ultimate guide for understanding Bitcoin’s long-term trendlines, grounded in historical price action, key resistance levels, and the RSI (Relative Strength Index) as a measure of market sentiment. This chart underscored the importance of major resistance levels at $6,000, $8,500, and $10,000 USD—critical zones that needed to be "eaten" before the next halving to validate the bullish thesis.
You can view the original chart below this description and also in the comment section.
. This chart successfully predicted the major price movements leading up to the 2020 halving, proving the strength of using historical resistance levels and market sentiment to forecast Bitcoin’s behavior.
At the time, I emphasized that approximately 80% of all Bitcoin had already been mined, with a significant portion of that supply likely lost forever. This supply scarcity, combined with the halving cycle reducing the inflow of new coins, set the stage for future price appreciation. My analysis hinged on the idea that supply and demand dynamics, coupled with investor psychology, drive cyclical market behavior—an idea that continues to hold true today.
Revisiting the Halving Cycles: The Key to Predicting Future Moves
Fast forward to July 2022, and I revisited the concept of Bitcoin’s halving cycles with an updated analysis that sought to replicate the forecasting success of the past. This time, I focused on how the halving cycle—where block rewards for mining are cut in half every four years—plays a crucial role in Bitcoin’s price formation. Each halving event historically leads to a significant supply shock, which, combined with increasing demand, often triggers major bull markets.
The Emergence of FOMO Cycles: Understanding Sentiment-Driven Surges
Building on these concepts, I introduced the idea of FOMO Cycles—phases within Bitcoin’s broader halving cycle characterized by explosive, fear-driven price surges. These FOMO Cycles represent the moments when Bitcoin transitions from periods of consolidation or decline into rapid growth, driven by a market-wide fear of missing out on the next big rally.
Here’s how these cycles typically unfold:
Pre-Halving Accumulation: In the months leading up to a halving, smart money begins accumulating Bitcoin, anticipating the reduced supply. This phase often goes unnoticed by the broader market but sets the groundwork for the upcoming FOMO Cycle.
Halving and Media Hype: As the halving approaches, media coverage intensifies, drawing more retail investors into the market. This increased attention marks the beginning of the FOMO Cycle, as more investors rush to buy Bitcoin before prices skyrocket.
Post-Halving Surge: Following the halving, the reduced supply, combined with increasing demand, often leads to an exponential price increase. This is the peak of the FOMO Cycle, where prices can reach new all-time highs in a relatively short period.
Correction and Consolidation: After the initial surge, the market typically experiences a correction as early investors take profits. Understanding this phase is crucial for managing risk and locking in gains before the market corrects.
Tools and Strategies for Navigating Bitcoin’s Cycles
To help you make the most of these market cycles, I’ve refined several key tools and strategies:
Fear & Greed Index: This indicator provides a real-time measure of market sentiment, helping to identify when fear or greed is dominating the market. Extreme fear often signals a buying opportunity, while extreme greed can indicate that a correction is near.
On-Chain Analysis: By analyzing on-chain metrics such as active addresses, transaction volume, and miner outflows, you can gain insights into the behavior of different market participants and anticipate potential shifts in market dynamics.
RSI Divergence: Watching for divergences between price action and the RSI can help identify moments when the market is overbought or oversold.
Historical Context and Future Implications
By looking back at the April 2019 analysis and comparing it with more recent developments, we can see how these cycles repeat over time, driven by the same underlying forces of supply and demand, amplified by investor psychology. As we approach the next halving in April 2024, understanding these patterns could provide valuable insights into Bitcoin’s future price movements.
Whether you’re a long-term investor or a short-term trader, mastering these cycles is essential for navigating Bitcoin’s volatile market. By combining technical analysis with a deep understanding of market psychology, you can position yourself to capitalize on the next big move while managing your risk effectively.
Final Thoughts and Historical Successes
Looking back at the historical context and the successes of my previous predictions, it’s clear that understanding Bitcoin’s market cycles—especially in the context of halving events and FOMO surges—can provide valuable insights for both short-term traders and long-term investors. By combining these technical insights with an awareness of macroeconomic factors, you can position yourself to capitalize on the next big move in the market.
Whether you’re a long-term investor or a short-term trader, mastering these cycles is essential for navigating Bitcoin’s volatile market. And as always, while this analysis is a powerful tool, remember to stay informed, stay patient, and enjoy the journey.
Disclaimer: This analysis is an attempt to predict future price movements based on historical data and technical indicators. It is not financial advice. Please do your own research and consult with a financial advisor before making any investment decisions.
Chachain
BLX trade ideas

Global Liquidity and BTCWhat's the deal with Global Liquidity?
We all know that Global Net Liquidity plays a crucial role in asset growth, especially for #BTC 📈
🌍 The largest provider of liquidity, the Fed, is expected to lower rates by September, which would boost overall liquidity.
📅 And don't forget the cycles in the world's second-largest economy. Their liquidity injections follow a yearly cycle, with the next one kicking off in October.
For the past 2 years, we have grown against the trend of liquidity, imagine what will happen when liquidity meets us🚀

Dead Cat Bounces for CryptoHello! Today I talk about the current state of BTC, I expect a light upward trend in the short term followed by a long and slow bleed to around 40k for the next 6 months

BLX is halving a restart?I put all the price history into this frame. This cycle does not look out of ordinary so far. Of course assuming this time will be the same is silly nevertheless it is fun to watch how each past cycle was developing day by day from halving point.

BLX Global Final View - BTC - $1 000 000 ?According to Wave Theory:
In the impulses of a wave of the same degree, channelization is observed
2 wave is most often a zigzag
2 wave is most often a deep correction
3 wave equals 1.618*1 wave.
The 3rd wave is the most powerful
4 wave is most often flat according to the rules of alternation
5 wave is mostly equal to 1 wave
BUT
Bitcoin is a commodity market
And in commodity markets, the 5th wave is most often extended.
At what price will YOU exit?

Hash Ribbons - Wrong Signals?🗣: Yesterday we received a buy signal on Hash Ribbons and today we fell, why ⁉️
Answer: The Hash Ribbon is primarily an indicator of the CRYPTOCAP:BTC hashrate, it is 2 moving averages, and when after the capitulation of the miners (after the halving), we reached the plateau at least a little and began to recover, MA turned to the bullish side, which triggered the signal.
📝So it's simple - the hashrate has recovered.
💡Of course, considering other metrics, we have a fairly positive long-term picture and hashrate is a fairly powerful fundamental metric, the growth of which is positive for the reliability of the #Bitcoin network. But too much attention to only one signal is not productive.

Bitcoin Bull/Bear/RecoveryThis chart illustrate the 4-year pattern for bitcoin's price, going through bull, bear and recovery phases.


Bitcoin - Is it Time to Panic?At the low yesterday, the price of Bitcoin was down a little over 27% from the all-time high in March. In previous bull market cycles, we have seen many corrections of 30% or more. As was the case in past cycle corrections, we are seeing a lot of panic selling. Another issue is being in over leveraged positions and getting stopped out during corrections.
Unfortunately, many inexperienced market participants are not familiar with Bitcoin's past price history. So, when we experience a large correction, they panic and sell when history has shown that these corrections are great buying opportunities. But, unfortunately, past history has shown us that many people will be too scared to buy during this correction and many won't start buying again until the price of BTC is back up near it's all-time high.
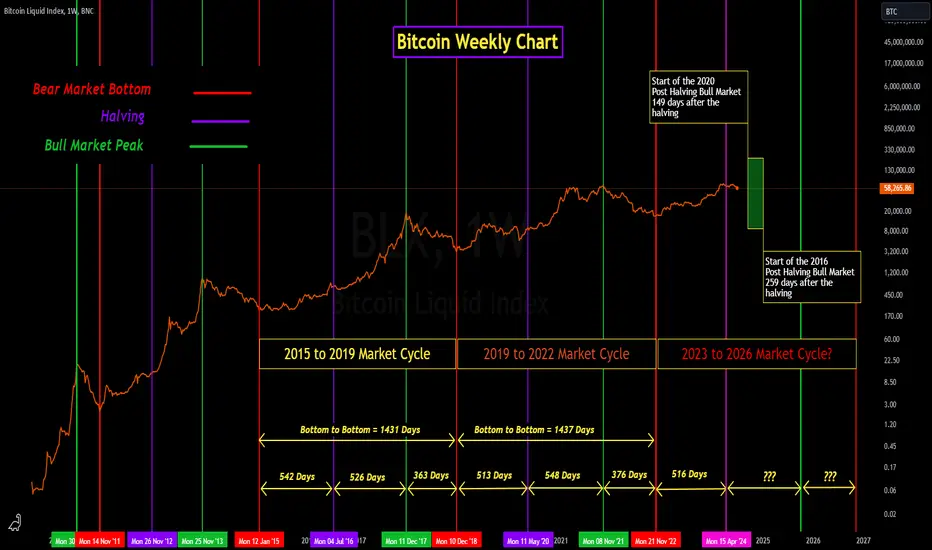
If you take the time to study Bitcoin's price history, it is very clear that Bitcoin has been running in 4-year market cycles. This is especially true for the last two market cycles. From bear market bottom to the next bear market bottom, the 2015 to 2018 market cycle was 1432 days in length, and the length of the 2018 to 2022 market cycle was 1438 days. Even the elapsed times between events (bottom to halving, halving to peak, and peak to bottom) during each of these cycles are very consistent.
Obviously, this market cycle trend doesn't have to continue, but I believe that it will, at least for this cycle. If that is the case, then I wouldn't expect the post halving bull market to begin until October or November of this year. Looking back at the previous two cycles, the 2016 bull market started 259 days after the halving, and the 2020 bull market started 149 days after the halving.
There is always a chance that I am totally wrong and the peak in March was the peak for this market cycle and it will be all downhill from here. But I believe the probability of that is very low. I believe we could see a lot more volatility and possibly even lower prices leading up to the post halving bull market.
The German and the US governments still hold significant amounts of BTC which they could sell adding to downside pressure. There is also the Mt Gox BTC that could add to selling pressure driving the price of BTC lower. But in the coming months I believe any excess selling of BTC will be absorbed by the market and eventually the current bearish sentiment will flip to Bullish.
I will be using this correction and the time between now and this fall to increase my position sizes. But this is just how I am approaching this market cycle; every investor needs to do their own research and make their own decisions. I also make my decisions based on my long-term view and long-time horizon.
Is the Correction Over?In each cycle, from the bottom to the high in the pre-halving rally, #BTC has seen an increase of 330%-370%, followed by a minimum correction of -38% or, with the exception of the rule (pandemic), -62%.
At this moment, a 38% correction means a price of $45,700, while a -62% correction means $27,900. However, I don't think we will see such a large correction now.
#Bitcoin could drop below the $50k zone as there is a lot of liquidity waiting to be taken from there.
The price from here could have reactions, but I don't think it will make a new ATH from the low at $53,700.

FUTR CORN 5000Cycles gonna cycle!
Corn can’t resist crashing the party right when it’s getting good.

BTC: four scenarios, almost same result
Four scenarios, almost same result: down then up. Low probability? Maybe. This old prediction from 2021 had a low probability too (bbs.market).

This time is different. Btc coming down and everyone screaming bearish. We can go even lower and still can go higher . Just look the big pic .

A very magical panoramic view of the Bitcoin cycle. A very magical panoramic view of the Bitcoin cycle.
We can see that since Bitcoin began trading in the secondary market in 2010, three complete bull-bear cycles have been formed. Each bull market lasts about 152 weeks, and each bear market lasts about 52 weeks, that is, three years of bull market and one year of bear market.
With the growth of the number of users and market value, the increase is smaller in each round.
According to the previous three cycles, the end time of this bull market is late October 2025, so how high will it rise? Welcome to discuss.

BTC/USDAn analysis that compares the log and normal scale to have a realistic and probable target for BTC

BTC CorrectionWill CRYPTOCAP:BTC undergo a sharp correction after the distribution in the summer of 2019?
BTC Halving Trade Idea~ 7RR. Swing trade with expectation of a break of highs post halving. Entered with 100% of capital.

Bitcoin's Momentum Is Slowing Down (BLX Chart)As I'm sure you've noticed, my posts have really slowed down. I'm just focusing on other things in my life, and it's mostly been good. Some hard times very recently, but that's how it goes. I hope you are all alright and trading safely :)
Now...to Bitcoin. Volume is declining overall as less actual Bitcoin is traded. Hardly any coins have been sent to exchanges, when compared with the past. Bulls say this is a good thing, due to less supply being available, which in theory pushes up price. However, if demand is lacking overall, there is not much that can be done. Bulls therefore hope that the new ETF's provide enough demand to keep the all time highs coming.
Momentum is also slowing down, hence the longer term monthly bearish divergences in the Ultimate Oscillator.
It's interesting to note that the total crypto market cap (TOTAL) has not made a new all time high.
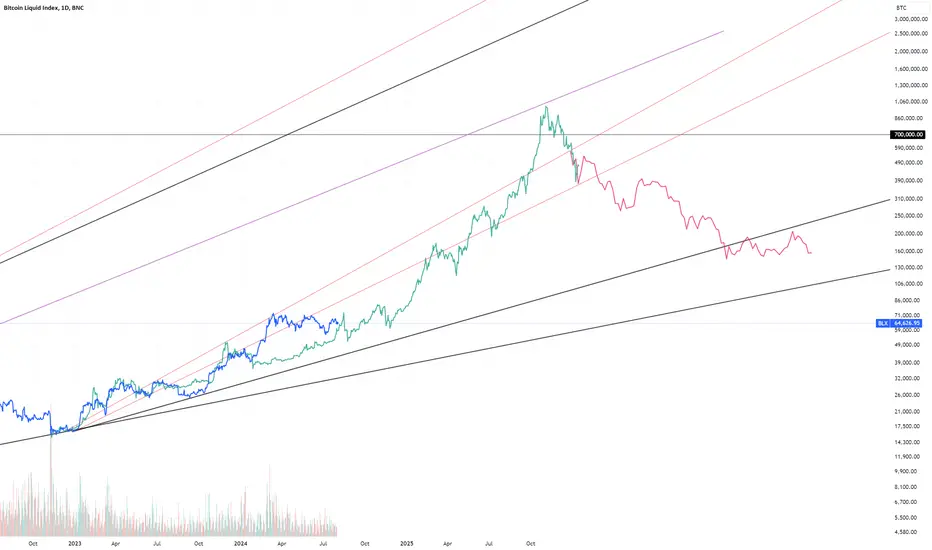
Unless Bitcoin can get above its curved channel, growth will continue to slow down. For bulls, the hope is that Bitcoin continues to outperform traditional markets. We'll see what happens! Above, I've provided both long term bullish and long term bearish scenarios. As for what could send Bitcoin back to $3k or lower? It would probably involve forced selling, particularly by someone like Michael Saylor.
On the weekly chart, it's possible Bitcoin is simply consolidating before the next leg up. Seller volume is declining. Unless we see a huge push down before this coming Sunday, it's very possible the recent lows are set and price will make a new all time high.
There is also room to test some lower levels based on these trendlines:
$53k and FWB:42K are major levels buyers would be defending if price drops lower.
For now, $60k is being defended. Need a more convincing bounce though, to prove the selling is over.
There are more options than that, but this is currently the way I'm looking at it. Doesn't mean I'll be right or wrong, but that's how it is! I'm trying to provide both bullish and bearish options so that my bias doesn't take over.
I'm still positioning myself short. My opinion is that Bitcoin has a critical mass, or maximum price, and that there are some signs pointing to Bitcoin's over-saturation. This includes the lack of new addresses, decrease in volume, and lack of overall interest from the everyday person. The irony is that if all of a sudden everyone started talking about Bitcoin, we'd probably be near a top. So, you may take this as a bullish argument.
Anyway, thank you for reading and for your support. This is not meant as financial advice. This is purely speculative!
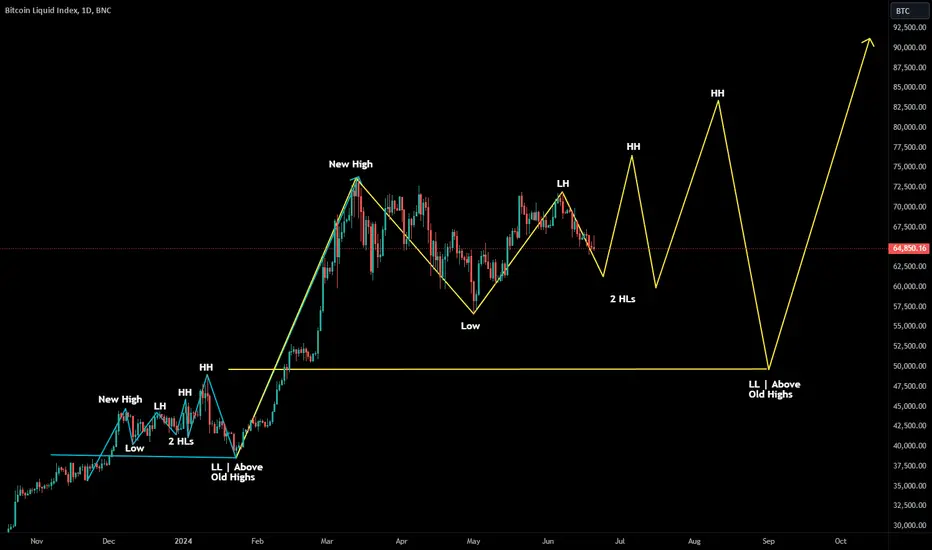
Repeating Same LTF Pattern on HTF?Here's an idea I haven't seen proposed. What if we're repeating the same pattern we saw between approx 40-50k, on a higher timeframe and between 50-85k.
Just like the blue pattern before it, it starts with a new high being made, then a low well above old highs, then a lower high followed by a higher low, then a higher high followed by a 2nd higher low (slightly lower than the previous higher low), finally a 3rd and significantly higher high followed be a strong lower low but still above old highs prior to the new high.
Let's see if it happens again!
$5 Entry: A Bittysweet Symphony(originally written October 2023)
Bitcoin has dominated headlines iover the last decade+. From a logically defying concept crafted by Satoshi Nakamoto, to a collectively embraced path towards the future, the world’s first cryptocurrency is undeniable. Unless you’re Warren Buffet — or Horus.
From humble beginnings at $0.01, at its fairly recent all-time high near $68K, Bitcoin increased in value by 6,192,134 times. Thats 4406 times more than the SPX’s all-time growth and 64,451 times more than Gold’s (based on chart history available from year 1834).
Considering its historical dominance and the forward looking perspective from many of the world’s most renown investors, you’d think (and most do) that the momentum won’t ever cease.
The explosive growth has been amazing and the fear of missing out is not only present for individuals, but also for global organizations and national government administrations too.
As an Elliottician, after applying Elliott Wave Theory to Bitcoin’s all-time wave structure, I am a bit more cautious than the majority. These are some details I consider to be facts:
1) Bitcoin is not in an impulsive wave structure.
2) Bullish (upside) corrective waves commonly retrace to the 0.38, 0.618 or 0.786 fib level.
3) Since 2013, BTC’s Relative Strength Index has been in constant decline.
As for my near and long term BTCUSD projections, I expect a couple of climatic things to happen:
1) Bitcoin achieves a new all-time high near the next halving in 2024.
2) Bitcoin fails to sustain the $100,000 price mark (if it even reaches that high).
4) Bitcoin makes a return below $10.
Bitcoin’s wave structure is very similar to Luna Classic’s. The only differences I’ve been able to see is that Luna was in a regular zig-zag (ABC) formation and Bitcoin’s wave formation is very very likely a double zig-zag (WXY). Both forms are corrective and generally result in a very deep retracement.
