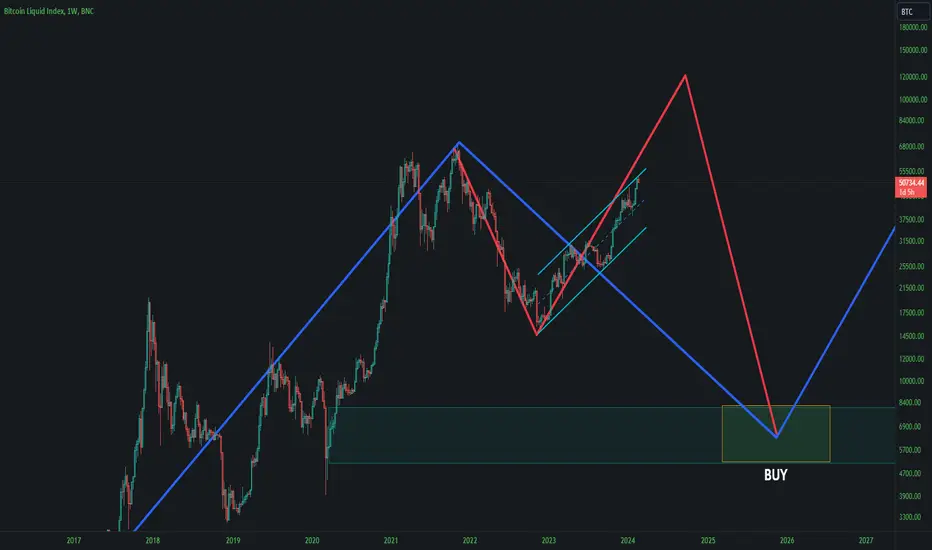
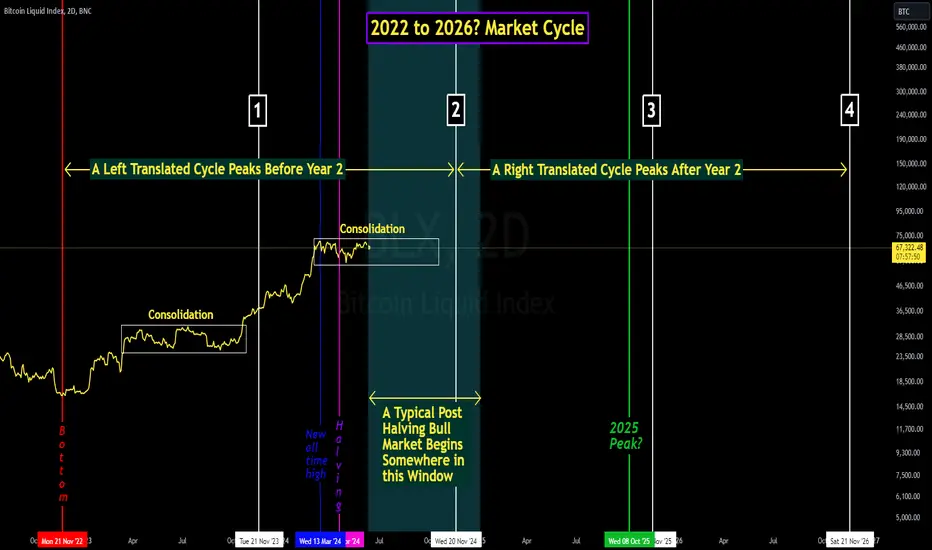
Bitcoin - Could this be a Left Translated Market Cycle?There has been a lot of speculation that this current Bitcoin market cycle could end as a left translated cycle. This is most likely because Bitcoin surpassed the previous all-time high almost 1 month before the halving. This is the first time in Bitcoins short history that has happened. But, does this alone indicate that this will be an accelerated market cycle?
From the bear market low on November 21st, 2022, it took only 16 months for BTC to set a new all-time high. Looking back though, during the 2011 to 2015 market cycle it took only 15 months from the bear market low for BTC to set a new all-time high. But, even though this cycle was abbreviated at just 3 years 2 months long the peak still occurred just after the 2 year mark.
As you can see by the chart, the new all-time high was set after the halving but this is due to the halving occurring only 376 days after the previous bear market low. Looking at the 2015 to 2018 market cycle, the 2018 to 2022 market cycle, and the current market cycle you can see that the halvings occurred 543 days, 514 days, and 515 days after the previous bear market low.
So, I guess the point I am trying to make is even though the new all-time high that was set on March 14th occurred much sooner than in the previous two cycles that alone doesn't mean that this will result in a left translated cycle. If we look at the elapsed time from the Nov. 2022 bear market low to the halving that just occurred it aligns more closely to the last two market cycles. Both of these market cycles were classic right translated 4-year cycles.
An explaination for the early new all-time high could be due to the hype sorounding the spot Bitcoin ETFs as well as the subsequent trading of them. I'm not going to pretend to know where Bitcoin is going to go from here. It's very possible that we could end up with a market cycle that is completely different than the previous cycles.
At some point I believe that the changing investor demographics will alter the market cycles. Another influence on the market cycles could be macroeconomic forces. Just this morning the May CPI data was released and came out lower than expected. As a result Bitcoin after being down 3.2% yesterday is now up over 3.5% today. But, even though BTC is up big today it is still stuck in the consolidation range and the $72k level still remains a formidable resistance that has rejected BTC five times over the last three months.
But, as of now I am leaning towards this market cycle continuing the trend of the last two as a typical 4-year cycle. That is until I see more evidence that something has changed. If this market cycle is to follow the timing of the previous two I would either expect a prolonged period of range bound price action, lasting into the fall. Or a prolonged period of slowly rising prices lasting into the fall leading to the eventual blast off.
Either way I remain extremely bullish long term and look forward to what lies ahead.
BLX trade ideas
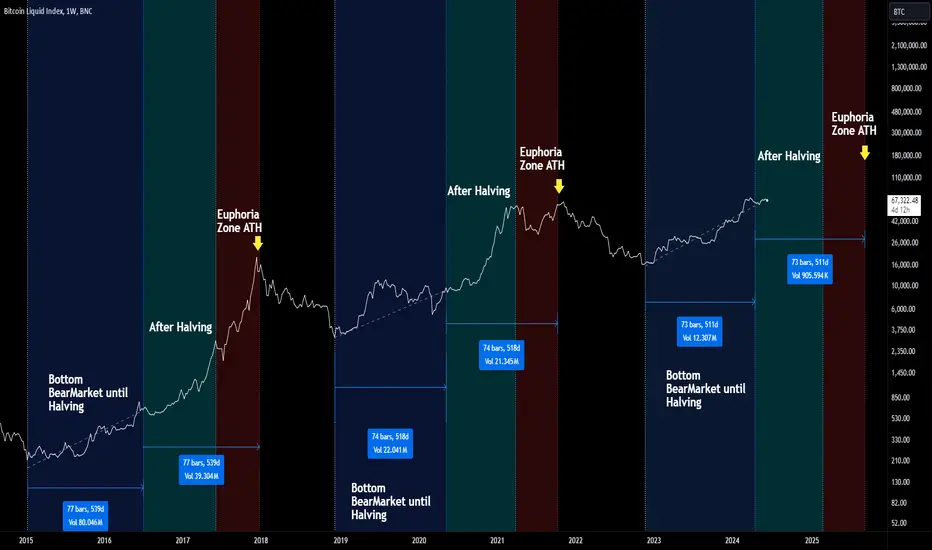
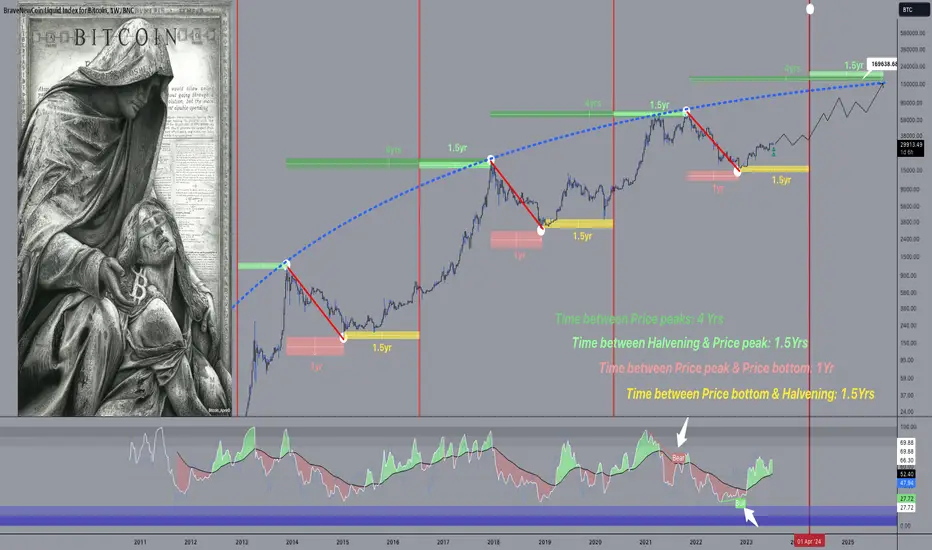
Bitcoin and the end of the bull cycle!At this moment, many might start reading this article thinking that the bull cycle is over, but that’s not the reason I’m writing. My intention here is to provide you with advance notice of the temporal zones where you should seriously consider realizing profits from your hold portfolios and even be prepared to look at selling in the market.
In the last cycles, this pattern has repeated, allowing us to replicate the projections.
In the first cycle back in 2012, after marking the bottom and the Halving, the price moved parabolically in two structures: the first, marked in aqua green, represents the post-Halving effect; the second, in red, represents the full euphoria effect.
This behavior repeated in the 2016 cycle and also in the 2019 cycle:
What’s most interesting is that, in all cases, the time between the market bottom and the Halving is exactly the same as the time between the Halving and the market top.
This is what I want to share with you: the points where the temporal zone suggests a possible inflection of movement or phase change.
This shows us that until mid-March 2025, we will be experiencing the post-Halving phase, and after this phase, we will enter the euphoria zone. The possible inflection point of the cycle should occur around mid-September 2025.
This study is based on analyzing the Fibonacci temporal zone and projecting the cycle based on symmetrical time behaviors from the past. This is not a guarantee that we will follow the exact same trajectory, but rather an additional basis for you to measure your exposure time to the cycle.
BTCUSD: If history repeats itself2019 fractal to scale with similarities so far. $25K needs to break for bull-flag confirmation. $30K needs to break for +80% upside target to ~$50K.

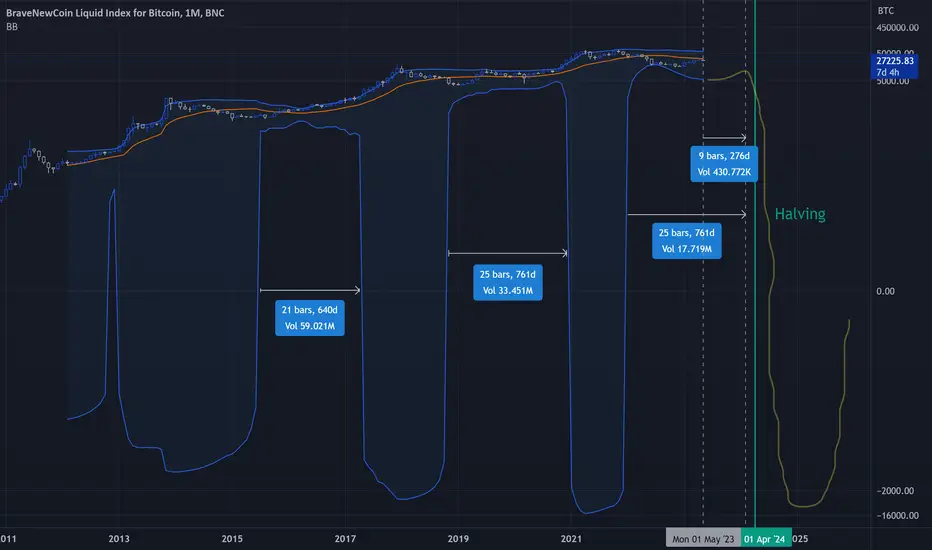
Bitcoin Halving Timeline- The next bitcoin halving is expected to occur in April 2024, when the number of blocks hits 740,000. It will see the block reward fall from 6.25 to 3.125 bitcoins.
- this is a different view of using Bollinger Bands, when Bands are drastically falling, Bullrun is starting.
- i took as timelines the older bullruns. ( 21 bars - 25 bars )
- Take it easy, logic is still a theory.
- Patience will reward.
Happy Tr4Ding !
BITCOIN BLUEPRINT
Bitcoin Blueprint for 2024...
Looking at the OVERWATCH, Can see divergences printing on the weekly for peaks and bottoms. Can see the trendshift on each trend apart from the trapped liquidity from the bull trap up at 69k. (yellow dotted line)
Image credit: @bitcoin__apex
BTC Power Law Analysis: Convergence of Slope Models
This chart shows two sets of bands overlaid. The first, with blue bands and white central line, tracksBitcoin's price movements through predefined values associated with the BTC Power Law. The code I used came from @savingface on Discord, where it was scripted to adheres closely to Bitcoin Power Law slope observed by Giovanni Santostasi, and written about on Medium. It overlays a set of bands derived from moving averages that take in all of BTC's historical price data.
Notably, when the x axis is also made logarithmic, the Power Law curve becomes linear. It is a limitation of TradingView that only the y axis can be viewed in logarithmic mode, so we are unable to appreciate the logarithmically linear growth of BTC in this chart.
Interestingly, as the bands based on moving averages become smoother with lengthening history of Bitcoin, we see a highly evident convergence between the BTC Power Law bands and the slope derived from moving averages. This highlights an increasing consistency between both models that strengthens confidence in the BTC Power Law slope as a predictor.
Traders can leverage this information to identify significant levels in market expansion and contraction. At the time of writing, we appear to be breaching the central line of each slope. My prediction is that we move up a full two lines, but at least one, during the continuation of the current bull market.

2017-2024 Fractal BitcoinTracking this Fractal 2024
Exp near future correction from 80 to 60...Load...
Bitcoin WayKeep that in mind :
- More we go Down.
- More the next bullrun will go High.
- Fibonacci Law Rule.
- Happy thanksgiving to everyone! 🐔
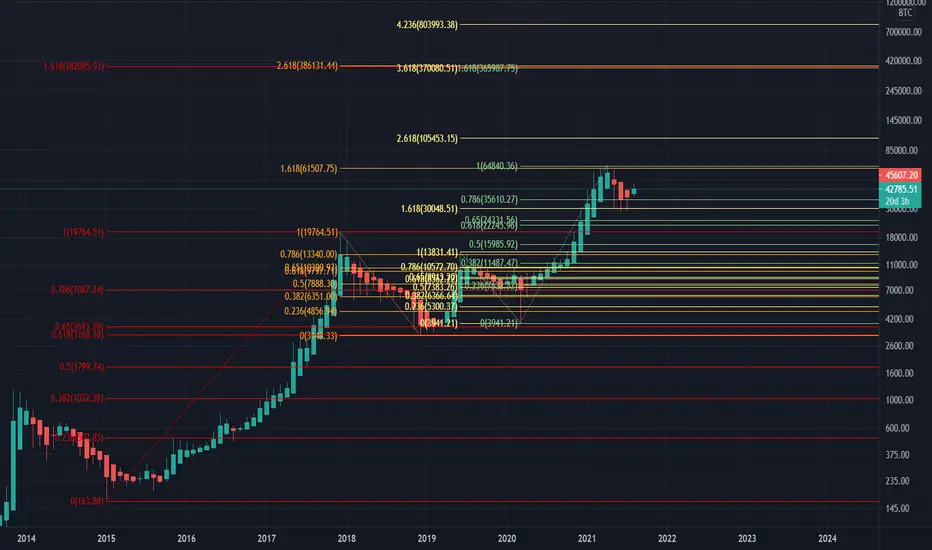
Fibonacci MaximalistJoin me and become a Fibonacci Maximalist. Thanks be to Leonardo Bonacci and the Italians. All my sells are at 360-400k. All glory to God.
Updated version of the related idea below:
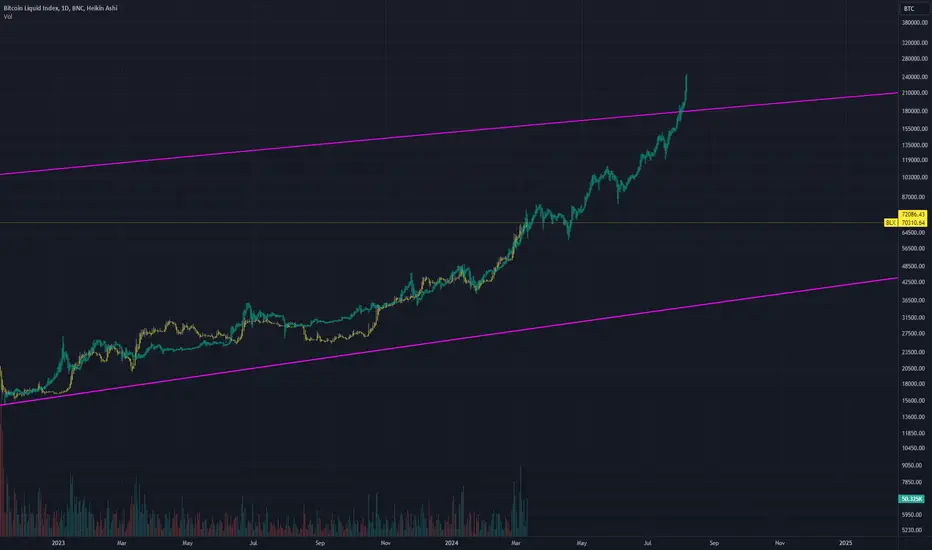
How to outpace inflation with this 1 cool trickBuy bitcoin.
Shoutout to @TechDev_52
I wanted to re-create his chart with my thoughts. Please give him a like and follow.
Only thing worth noting about these BBands is it uses EMA instead of SMA, and 50 settings instead of default. Still a great way to catch a general trend and pattern.
fib target of ~360K

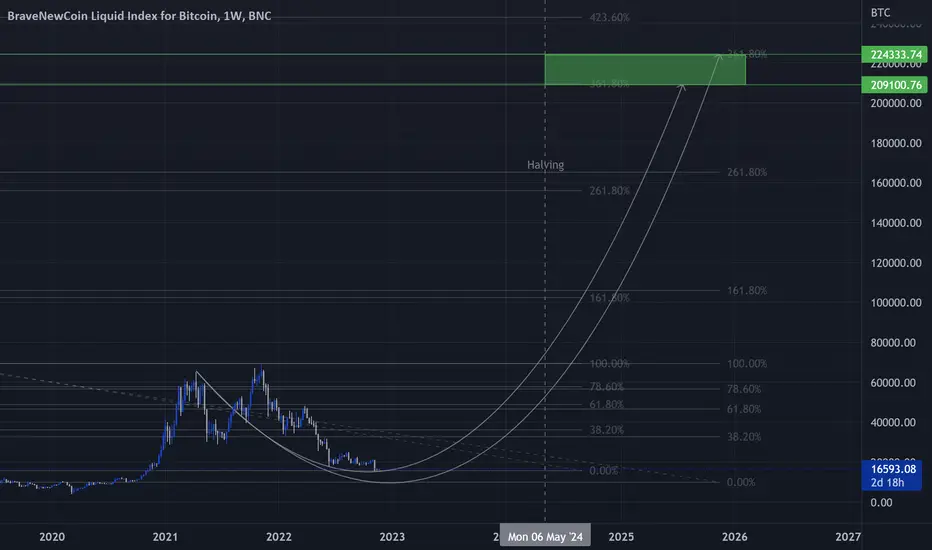
Massive Bullrun ahead BTCLet's see where it's going. The next Bull run will be grazy, top would like be around 220k MAX. Think this would be a really weird candle on higher time frames cause the veeeery high sell presure.

how it worksinterestingly enough, when compared to TOTAL - crypto total market capitalization chart tends to track bitcoin almost perfectly - or visa versa.

Idk much about TA beyond drawing lines and stuff but...Does this Fib look promising? I'm reminded of a post by this person in 2022
x.com
The same person who supposedly predicted Queen Elizabeth's death 216 days before she died.
I learned that this person could also very likely be a complete fraud.
But we're approaching sub $80k and this fib is hitting many points.
Remember idk wtf I'm talking about.

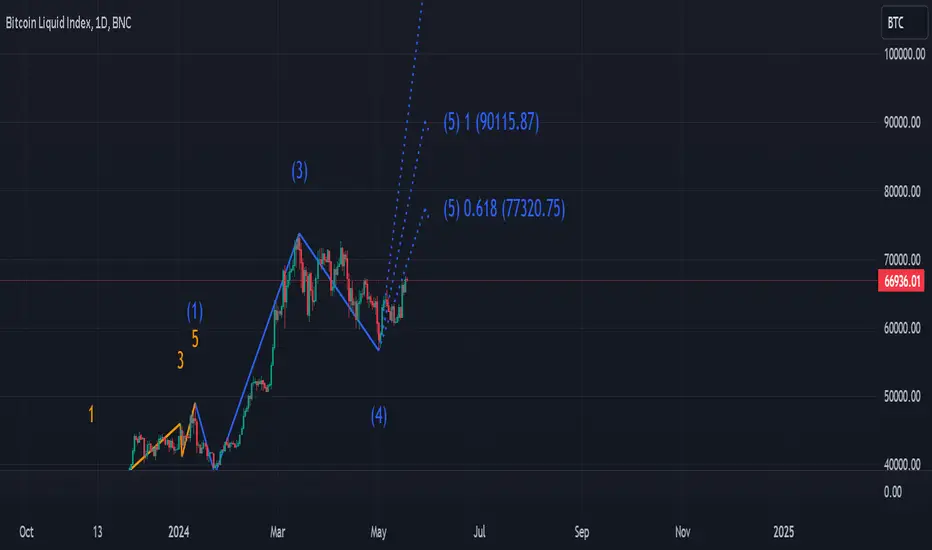
BTC USD 1D Elliot WavesBased on the Elliott Wave count, we are currently in the fourth wave (4) of the Bitcoin cycle.
If the pattern continues, the fifth wave (5) could lead to significant price appreciation.
Crypto is in a bull run now. Following with Bank of America...As you can see, Bitcoin is in a bull run because the Banks are pumping crypto. I mean if you're a banker, you know crypto is better than the dollar so why not, right? From the looks of it, bankers are going to push the economy forward for the next year before cooling off again, maybe stopping around October of 2025. Maybe a few months before or after, who knows. It's really up to them to decide when the markets should cool. Must be good to be a banker.

#LONG I am bullish on BTC until this pattern plays out
we will have a touch in the 81,000 area and then a DROP in the 52-50k area.
And then we will have ALTS season.
BTC from 52k to 125-130k.
(this is not financial advice)
Bitcoin May 2023 Forecast - 12 Months of AccumulationThe chart is telling me that we could see the next 6-9 months slowly grind lower as the global economy enters recession. This will be a great opportunity to scale into long positions slowly for Bitcoin as we gear up for 2024-2025 bull run. If you can get an average price between FWB:21K - FWB:25K you will be nice and cozy in your position for the next two years. Upside target is between $100K-$250K for this next bull run. Please manage your risk carefully as this is truly the only thing that you can control.
Best of luck.
Blorenz
BLX, Bitcoin on the long termA view on BTC's cycles. Check the market cycles on a full bitcoin view.
BTC Monthly RSI Tells the storyRSI has reset and the price is at previous bull run ATH. See how much more we can/will run? Patience....its almost time.

BTC TimetravelHere you can see the diferent time phases from bitcoin. If this time is not different, then we should see a run soon into the green phase.

5th Wave Extension can bring bitcoin to 250KTo show you how an 5th wave extension looks like we need to look back to the bullrun of 2015
Bitcoin started the move in 2015 with an impulsive move into wave 1
Then a sideways flat correction ABC into wave 2
This created the Base Channel, when the price breaks out of it, wave 3 has started
Once wave 3 ended we corrected and held support on the Base channel in wave 4
Afther that the extended wave 5 begins and we create a parabola
After the buying climax we retrace back to end the elliot wavecycle
Now we come back to present to see if we can have an 5th wave extension in this cycle
The confusion part is that this elliot wavecycle there are 2 halvings included
one halving right before the 3th wave and the second one will happen during the 5th wave were are now in
Bitcoin is almost at max supply, so in the future the halving will have less and less impact on the price
This viewed from a supply standpoint, not a psychology standpoint, that will remain i guess
This view also concludes that we are in lenghtening cycles, so the price moves are also spread out in time so there's a relative belief the returns are diminishing in a time-related view
Looking back to the chart i posted, some of the moves are already set in stone
The only variabel is where that 5th wave of the 5th wave will end
We are now in wave 2 correcting to find a higher low between 22k en 20k
Wave 3 wil end around previous All Time High to begin re-accumulation in wave 4 between 42k en 65k
This chart projects a extended 5th wave to up tot 250k, real moonboy targets
For the more realistic people, this charts show no extended wave 5
The only difference is the 5th wave in comparisson with the other chart
The theory is to reach peak euphoria when we pierce 100k en come back down to start the bearmarket
To end this analysis, it's difficult to look that far in the future but it gives you an good idea for what is to come, some things are likely to happen en some things are now to early to tell
Know where you are in the cycle, there is much time to go, have patience and let the trade come to you

1340 The Bitcoin ProphecyThis is about an authentic Bitcoin halving index.
We place the prices between the halving dates at a common starting point. But what makes this index more credible? I’ve seen many similar indexes, but none of them were properly constructed. Satoshi Nakamoto mined the genesis block on January 3, 2009. This date marks the beginning of the Bitcoin network. Everything we know today as cryptocurrency started from here. There was no exchange rate at that time. The first known exchange rate came 591 days later, on July 18, 2020. So, if we want to correctly represent the halving cycles on the chart, we need to shift this first cycle by 591 days from the other halvings brought to a common point. It can be observed that the Bitcoin price drops ~1340 days after each halving, including the genesis block.
Analysis: You can find the previous analysis at the following link:
I published the above-referenced analysis on March 23, 2021. After that, all we needed was patience. Then, on May 1, 2023, I posted the following text in the Crypto Bitcoin Hungary Facebook group: “Analysis for skeptics: On January 11, 2024 ± 2 days —> BTC collapses, and so do the ALTs.”
Initially, the following comments arrived, I quote a few:
- I see the May Day celebration went well!
- I only believe in Alarik because he is a real time traveler
-I think Biden will either die or not. Now, top that!!!
- At least it’s comforting that not everyone in foreign groups believes they are Nostradamus
- Are you some kind of prophet?
Then, as January 11 approached, the comments changed:
- Predict more for us, Master!
- I caught the peak!
- You were right
- I’ve been following this post for a long time, now I want to be one of the first to congratulate you You can seal it now, it came true. With ARK/SEC setting such a date for the ETF (conspiracy theories, anyone? ) one way or another, but I think you’ll be right. If they accept it, then either a) after one last “ETF pump” comes the increasingly due correction, or b) immediately on the “buy the rumor sell the news” basis, but you’ll be right. If they don’t accept it, probably after such a pump there will also be a significant FUD-based correction, so… you’ll be right. There’s not really a losing outcome. In any case, you seriously made me wonder whether coincidences exist, or ARK and SEC deliberately set the deadline for this day
The continuation of the analysis: Actually, since the exchange rate perfectly brought the expected fall, everyone is curious about the next date: a bigger fall is expected around December 15, 2027 . This date fits well into the almost traditional series of end-of-year seasonal rises, which is usually followed by a fall.
(enough) May Satoshi be with you!
The-Line, Bitcoin prophet

Bitcoin Market State - February 2024Current highest probability scenario for BTC. In this sequence I believe that Bitcoin is more likely to push for a liquidity sweep above the ATH till September, before plunging to the 5k-8k target (currently estimated to be reached in 2025)
In general, this is not a bull market move, but a higher order corrective structure. As before, I continue to anticipate altcoins to pop off during the bullish sequence.