Here Comes the Best time to Accumulate $NASDAQ:AAPL ! NASDAQ:AAPL
TIme To Get into it.
Try to accumulate the Stock at level between 190- Current price
Growth is Inevitable.
Nasdaq is Out Smarting the Eleites.
AAPL34 trade ideas
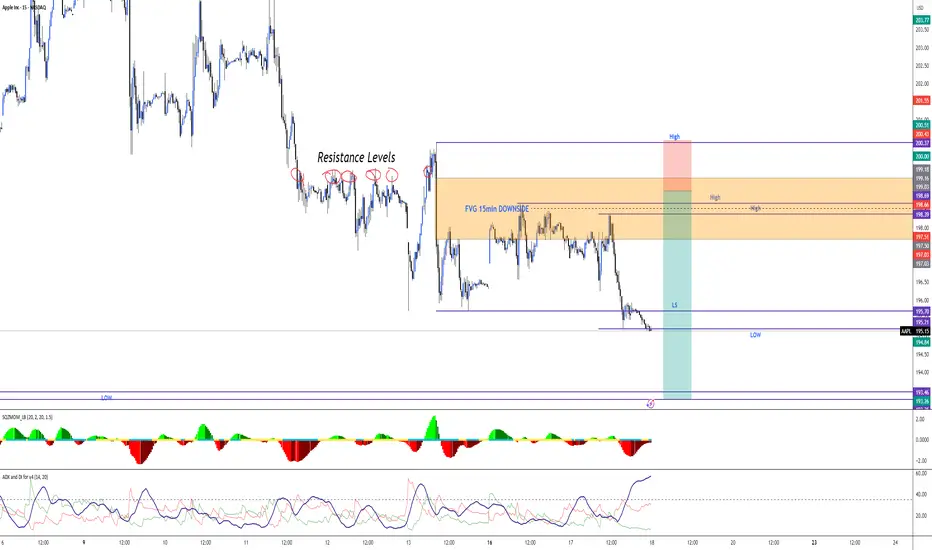
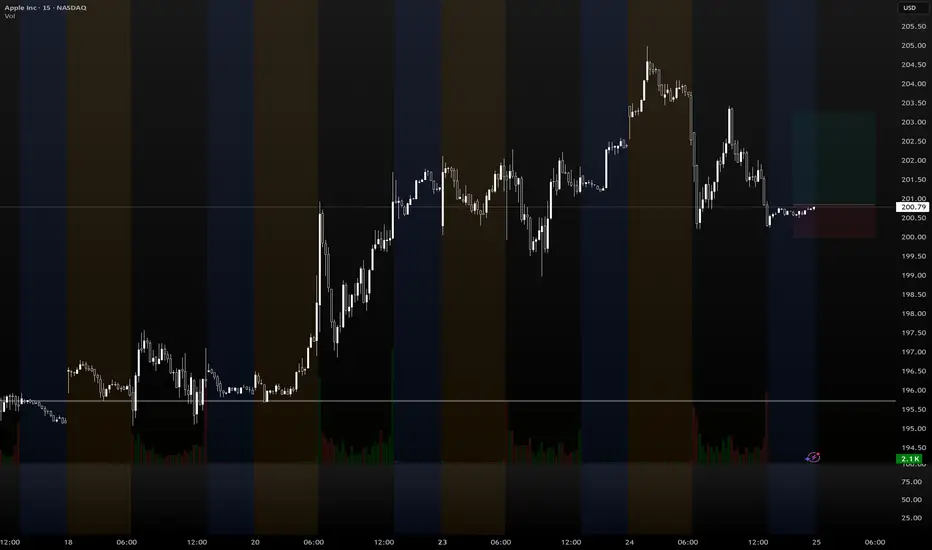
Is Apple setting up for a move? Liquidity sweep + FVGWe're keeping a close eye on Apple (AAPL) after a clear liquidity sweep around $198.40 and $198.70. Although the overall trend remains weakly bearish, the technical elements of the VEP Trader strategy are starting to align for a potential setup — if the market reacts from this institutional zone.
🔎 VEP Context:
Weak bearish trend confirmed via Squeeze Momentum on the 1D chart.
Clean sweep of prior liquidity zones.
Price enters a 15-minute Fair Value Gap, putting us on alert for a possible reversal.
🛠️ Setup Under Watch:
Potential Entry: above $198.70 (inside 15m FVG)
Suggested Stop Loss: above $200.00
TP1: $195.15
TP2: $193.25
👉 No confirmation yet, but if a new FVG forms and Squeeze confirms direction on the 5M or 2M, this may evolve into a clean bearish play.
✅ Key Confluences
Element Current Status
Liquidity Swept ✅
FVG Active on 15m 🟧
Trend Weak bearish 🟡
Confirmation Still pending 🔄
🧠 Final Thoughts
We don’t trade emotions — we trade structure. If momentum aligns and structure forms, AAPL may provide a clean, technical opportunity with solid R:R.
Watching for institutional reaction.
Apple is standing at the edgeApple (AAPL) is losing its long-term structure — second retest of the broken trendline suggests a bearish setup
On the 3D chart, Apple shows signs of structural breakdown. The weekly trendline from 2023 was broken and retested — twice. The price failed to regain it and now trades below, with candles showing weakness: low body closes, upper wicks, and no upside follow-through.
MA200 is now above price, and all EMAs are turning down. Volume Profile shows a heavy resistance block near $197. If the price remains below, sellers are in control.
Key levels:
— $192.20 = 0.5 Fibo support.
— Breakdown ➝ targets: $180 → $167 → $152.
Fundamentals:
Apple's recent reports show decelerating growth, weak China demand, and compressed margins. While AI buzz supports sentiment, institutional flow suggests distribution. BigTech may be topping out, and Apple is positioned for pullback.
Strategy:
Short below $196 with confirmation. Stop: $198. Targets: $180 / $167 / $152.
Failure to reclaim $192–197 = broken trend confirmed.
This is not a growth setup. This is where trends end — and profit-taking begins.

APPLE Big circle building editionSmart phones, some of them look pretty nice tbh.
However, something I read recently about cloud storage really interested me with apple.
Among other things obviously, like big stacks of cash.
Apple has a lot of money essentially.
Apple has a lot of talented people.
SF real estate is scary.
TA and chart description.
basically, we are under a short term trend break and have a lot of indicators pushing a top with a drastic overextension, so you might expect a possible rebound from all of that in alignment. Which you can then notice the gap at 154, and see how it can close that gap and essentially climb in a stable path to nearly 400 after creating some massive support at the 263 mark.
Excited to see how this one moves in price, Excited to see what apple comes out with in the future.
Good luck trading.
Guideline is to show the idea, try not to follow it, instead focus on the price targets and trends.

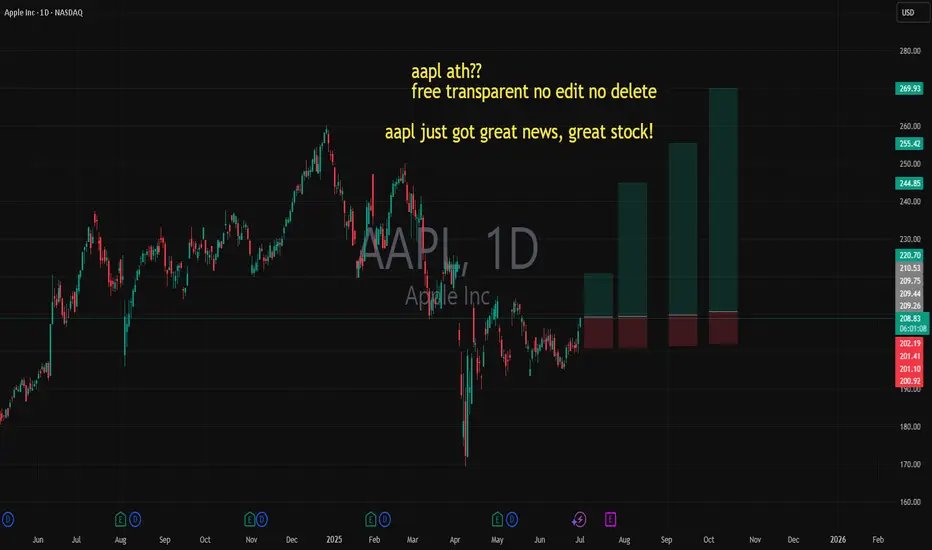
aapl just got great news, great stock! ATH coming?? YEA???aapl just got great news, great stock!
bullish. so very bullish
let us know!
free transparent no edit no delete
🐉We value full transparency. All wins and fails fully publicized, zero edit, zero delete, zero fakes.🐉
🐉Check out our socials for some nice insights.🐉
information created and published doesn't constitute investment advice!
NOT financial advice
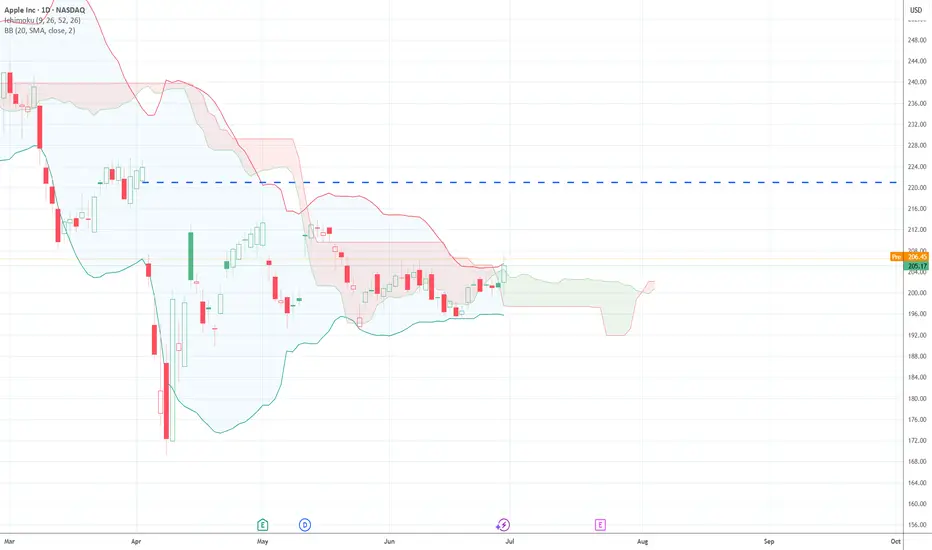
$AAPL Long TradeAAPL finally broke above the daily cloud yesterday. Also the daily bands are very tight. July tends to be the most bullish month of the year for NASDAQ:AAPL
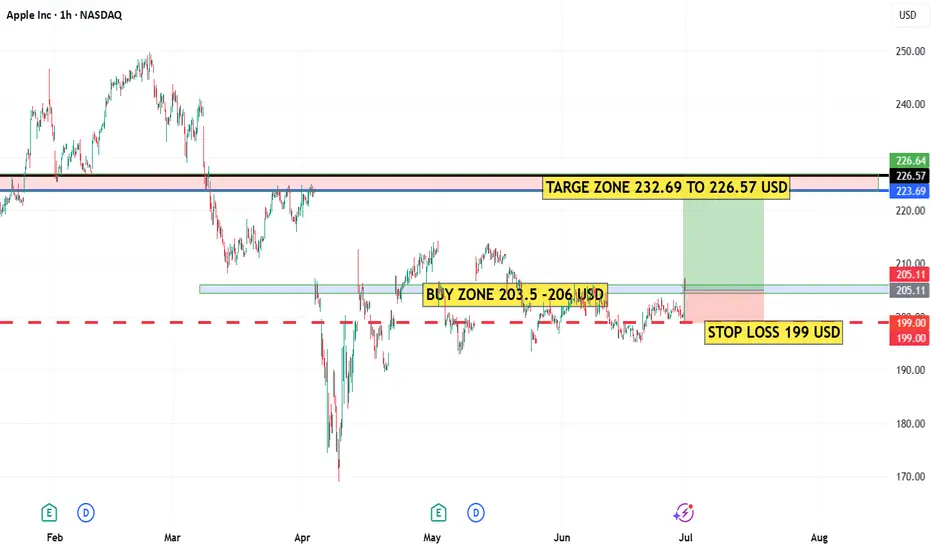
AAPLThe AAPL stock is currently one of the strong stocks and is in a buying zone, as shown in the chart. The target is the strong red zone, which represents a supply area. The stop-loss level is also indicated on the chart.
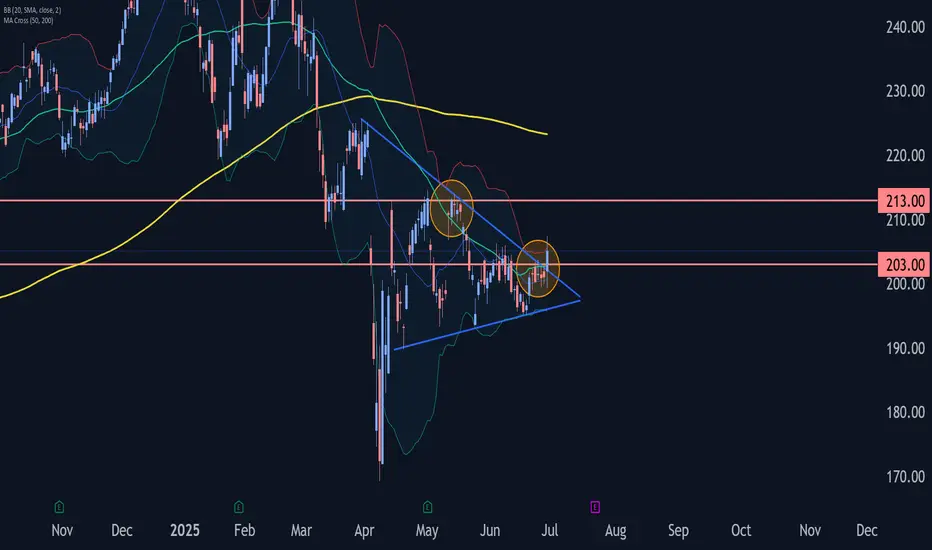
Apple Wave Analysis – 30 June 2025
- Apple broke resistance zone
- Likely to rise to resistance level 213.40
Apple recently broke the resistance zone between the resistance level 203.00 (which has been reversing the price from the start of June) and the resistance trendline of the daily Triangle from March.
The breakout of this resistance zone should add to the bullish pressure on Apple.
Apple can be expected to rise to the next resistance level 213.40, which reversed the previous waves (A), (C) and (2), as can be seen below.
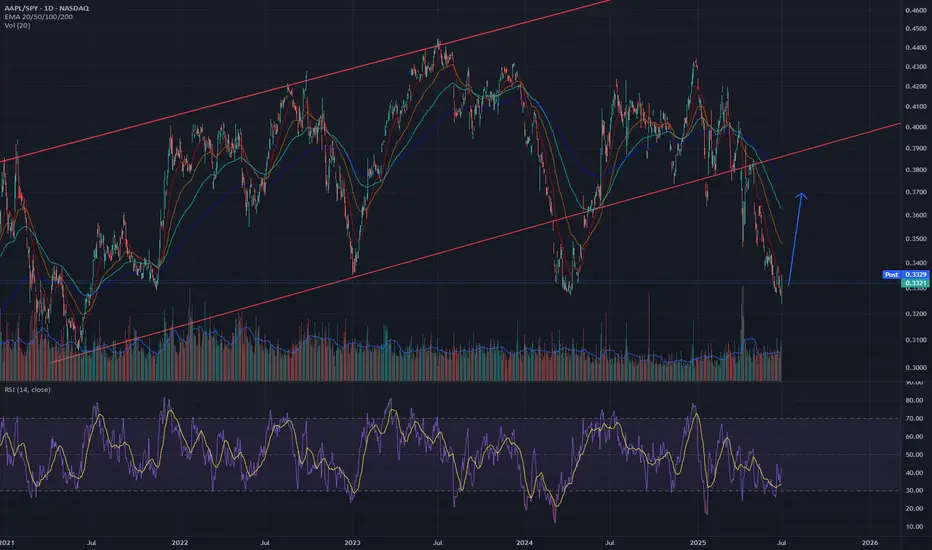
Yes AAPL has been trash. Yes AAPL will short term pumpThere is no world in which you can look at this aapl/spy chart and not identify that this isn't a GREAT risk/reward entry. You're telling me AAPL won't at least retest the 200 DMA this year?? You're telling me it's not worth it for a leap long as it's sitting at range lows??
Easiest money play I've seen in a minute.
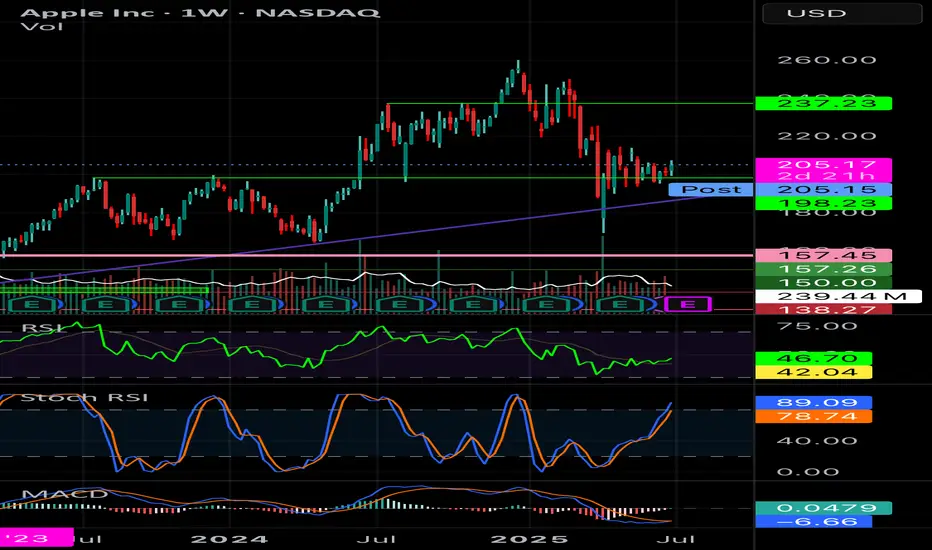
AAPL Weekly ChartOn the weekly chart, AAPL seems to find support on a previous resistance level after testing it several times. Macd has signaled a green as well. Seems optimistic.
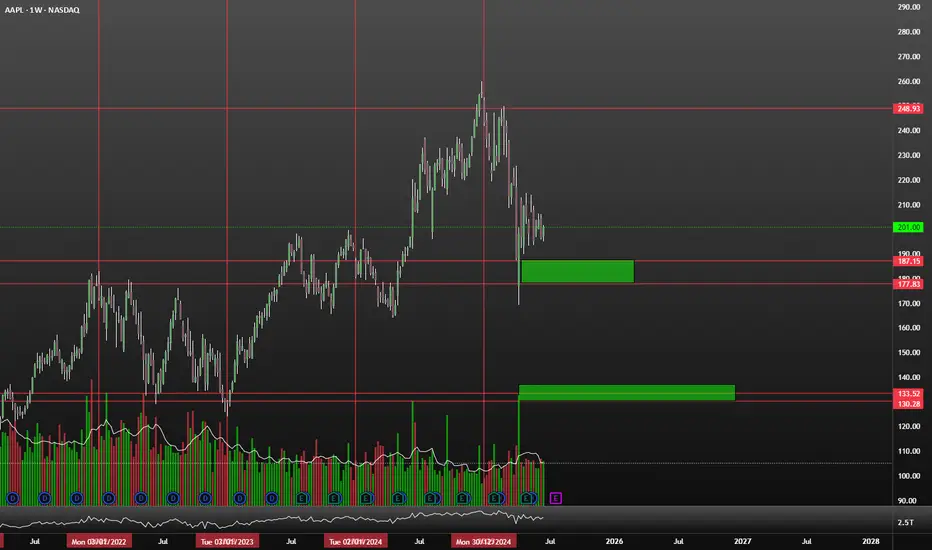
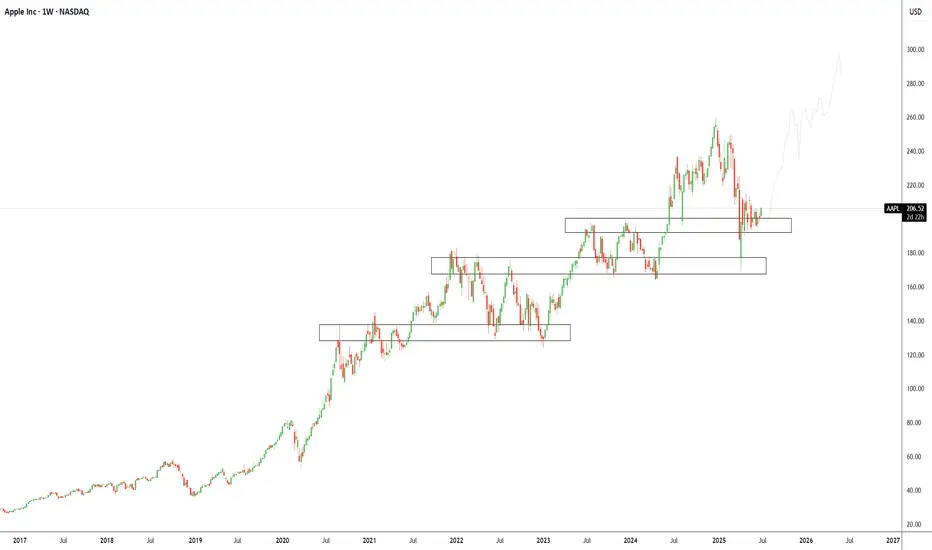
Apple Inc (APPL): Trend Continuation to $300+Overview Summary
We’ve added new long positions on Apple ( NASDAQ:AAPL ) recently after a textbook rejection from a well-established support/demand zone between $185–$200. This area has consistently acted as a launchpad for previous rallies and is now once again serving as a structural support on the weekly timeframe.
Apple’s ability to consistently innovate through product cycles, expand its services ecosystem, and integrate AI-driven features into its devices provides strong conviction for long-term upside. With Vision Pro, Apple Intelligence, and chip-level innovations underway, the company is positioning itself to benefit from both hardware and software expansion over the next decade.
Technically, the price has formed a multi-year stair-step structure with clear levels of accumulation. We believe NASDAQ:AAPL is beginning its next leg higher after consolidating above this zone. A clean move to retest all-time highs is likely, and a long-term target of $300 aligns with both trend structure and growth potential.
Green Zone Capital remains bullish on NASDAQ:AAPL with a long-term horizon and will continue to scale into strategic pullbacks within the broader uptrend, our current setup is:
Bias: Long
Type: Long-Term Accumulation
Entry Zone: $190–$205
Target: $300+
Invalidation: $165
Technical Analysis:
Apple is currently sitting at a critical demand zone that has historically acted as a base for previous multi-month rallies. Our TradingView chart highlights several key structural zones showing Apple’s tendency to build stair-step accumulation ranges followed by breakouts. The current zone between $185–$205 has been tested and held multiple times, confirming its significance.
We are seeing bullish rejection candles forming on the weekly timeframe, showing buyer interest is returning. This confluence of technical support and long-term structural demand confirms our long entry thesis.
Macro/Fundamental Thesis:
Apple remains one of the strongest tech companies globally with unmatched brand equity, pricing power, and integration across hardware, software, and services. The company continues to expand aggressively into AI with Apple Intelligence, spatial computing with Vision Pro, and strategic chip development.
With record cash reserves, a loyal consumer base, and continued innovation cycles across iPhone, Mac, and Services, Apple remains a strong defensive and offensive tech allocation in any long-term portfolio. Despite current macro volatility, Apple has consistently outperformed over market cycles.
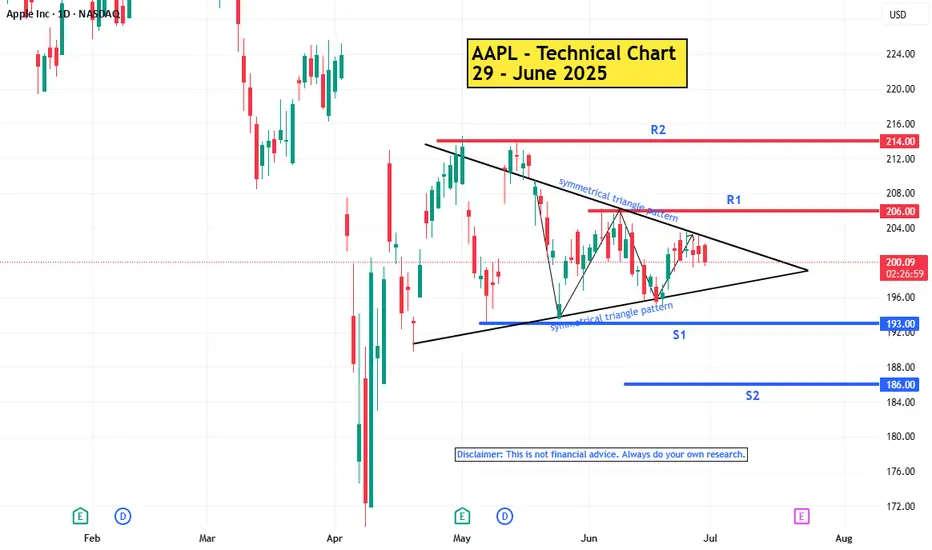
AAPL : Technical Analysis Report - 29 June 2025
Trend:
The primary trend (big picture) is downward. Bearish momentum is weak.
Short Term Trend : sideways / consolidation. Momentum in sideways trends is usually weak and indecisive. Sideways within a long term downtrend is often a continuation pattern.
Reasons:
Market Uncertainty: Waiting for news, earnings, or macro events.
Accumulation/Distribution: Smart money prepares for the next move (either continuation or reversal).
Pattern : Symmetrical Triangle Pattern
The pattern represents a temporary pause in the prevailing trend. The symmetrical triangle is considered a continuation pattern. This means that the price is likely to continue in the direction of the trend that preceded the triangle's formation. Neutral pattern until the breakout direction is confirmed.
Key levels :
R2 - 214
R1 - 206
S1 - 193
S2 - 186
Tips for Trading
Wait for a confirmed breakout (e.g., a daily candlestick close above/below the trendline) to avoid false signals
-----------------------
Note :
If you’re interested in receiving detailed technical analysis reports on your selected stocks, feel free to reach out to me. I can provide you with customized reports covering trends, key levels, momentum, patterns, and price projections to support your investment decisions.
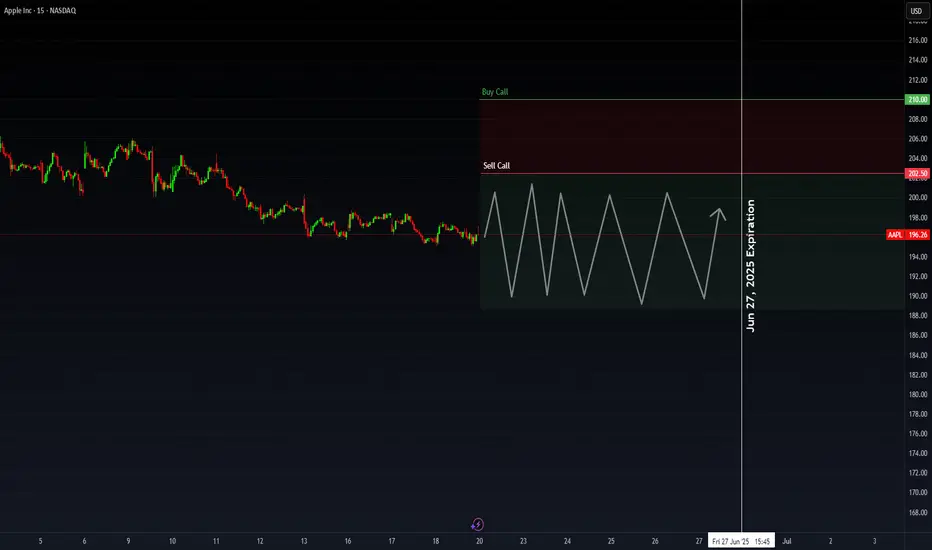
AAPL: Premium PlayApple beat expectations this quarter—revenue, profit, EPS—all slightly better than analysts hoped. But the stock dropped to $196.26, down from $212.83. Why? Investors are still worried about tariffs, margin pressure, and supply chain changes.
Tim Cook talked about strong product sales (iPhone, Mac, iPad) and all-time high Services revenue. But he also admitted tariffs and regulatory issues are weighing on Apple’s outlook.
My Covered Call Strategy
I’m selling the $202.5 call and buying the $210 call for June 27, 2025. Big money seems to be doing the same—there was a huge premium sale over $2 million, likely betting Apple stays range-bound short term.
- Why this works:
- Resistance near $202.50 gives me a clear ceiling
- Apple fundamentals are strong, but macro risk caps upside
Chart Notes
- Resistance: $202.50 and $210
- Support: Around $192.50
Bottom line:
I like this trade as a way to bring in income while defining my risk. If Apple grinds sideways or pushes a bit higher, the trade still pays. Clean structure, high odds.
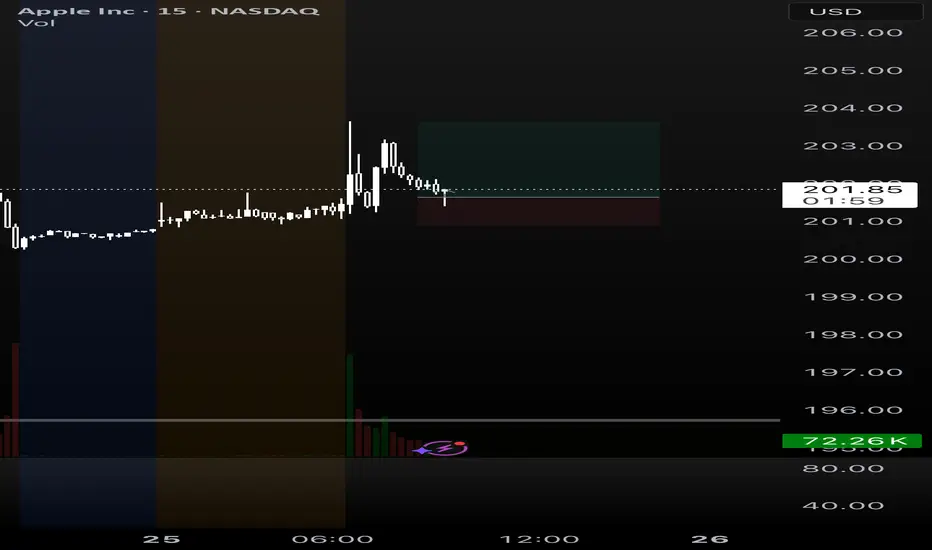
(Daytring) APPL quickly trade1. Premarket created a support line
2. Sma 200,50 is here
3. Price goes up in the moring just pull back to retest.
=> entry. Take profit whenever i feel good
(Daytrading) APPL going upH1 chart is respecting the uptrend.
Price has retested the 50 SMA on the H1 timeframe.
Price also touched the Ichimoku Cloud on H1.
→ Based on the risk-to-reward ratio, I’m expecting a Call position.
Impact on the Dollar and Forex — Artavion AnalyticsThe development of central bank digital currencies (CBDCs) — especially the digital yuan (e-CNY) — is becoming a key factor in transforming global currency flows. While the US dollar still dominates, the architecture of global liquidity is beginning to shift.
At Artavion, we see the e-CNY not just as a technological experiment but as a tool of China’s currency policy. Its goal is to strengthen the yuan’s role in international settlements and reduce dependence on the dollar, particularly in developing regions.
Why the Digital Yuan Matters
The e-CNY is already being used in China for retail payments and is being tested in cross-border transactions (e.g., in the mBridge project with the UAE and Thailand). This enables the creation of alternative payment systems not tied to SWIFT.
If the digital yuan gains broader acceptance, especially for commodity and energy settlements, its role in forex will grow, potentially weakening the dollar’s monopoly in certain regions.
CBDCs and Forex Structure
CBDCs won’t displace the dollar in the near term, but they are already influencing the structure of currency trading:
New currency pairs are emerging, especially in Asia;
Transactions are becoming faster and cheaper, particularly in the B2B segment;
Market participants are adjusting strategies to real-time settlements and the potential programmability of currencies.
Risks and Limitations
Privacy: CBDCs are under full state control;
Fragmentation: There is no unified technical standard across different countries’ CBDCs;
Geopolitics: The rise of the e-CNY could intensify currency competition with the dollar.
Artavion’s Conclusion
The digital yuan will not replace the dollar, but it is creating an alternative — especially in regions seeking autonomy from Western financial infrastructure. For traders and investors, this means reassessing currency risks and exploring new opportunities in decentralized settlement channels.
Fintech or Government Regulation? — A Perspective from MacromicsStablecoins have evolved from a supplementary tool into a cornerstone of the digital economy. They are used in DeFi, cross-border settlements, and provide liquidity in crypto markets. Today, the question is not whether stablecoins are needed, but who will control them — private fintech companies or government regulators.
Fintech: Flexibility, Speed, Innovation
Projects like USDC, USDT, and Paxos have demonstrated that private companies are capable of launching robust digital assets, quickly adapting them to markets, APIs, wallets, and decentralized platforms.
Advantages:
24/7 availability;
Operational independence;
Flexible integration architecture.
The downside is legal uncertainty. Without licenses and oversight, issuers are exposed to regulatory risk.
Government Pressure and CBDCs
The US, EU, and China are moving toward tight control over stablecoin issuance. The EU has adopted the MiCA regulation, while the US is discussing mandatory licensing of issuers. China and India are betting exclusively on CBDCs, banning private stablecoins altogether.
While CBDCs currently lack the flexibility of private solutions, they offer an alternative for the public sector and B2B settlements.
Forex Market: Myth or Strategy? — Analysis by Valtrix GroupEvery year in June, forex traders pay close attention to historical price movements, hoping to identify recurring seasonal patterns. But does June really offer a strategic edge, or is it a marketing myth and an overrated idea?
At Valtrix Group, we view seasonality as a secondary but useful filter — especially during periods of low volatility and a lack of macroeconomic catalysts.
What Does History Tell Us?
Historical data on major currency pairs (EUR/USD, USD/JPY, GBP/USD) shows that June often exhibits:
A rise in volatility in the first half of the month — driven by inflation data releases (U.S., EU);
Moderate strengthening of the U.S. dollar, particularly between the FOMC meeting and the quarterly earnings season;
In some years — flat movements caused by low liquidity ahead of the summer holiday season.
However, long-term statistics are mixed. For example, from 2013 to 2023, EUR/USD rose in June in 6 out of 10 years and declined in 4, showing no strong directional bias.
Why Seasonality Doesn’t Always Work
The forex market is driven not only by technicals and statistics but also by macroeconomics, geopolitics, and monetary policy. When major events occur in June (Fed meetings, crises, elections), seasonal patterns can easily be disrupted.
Moreover, algorithmic trading and arbitrage strategies reduce the likelihood of consistent price movements repeating year after year.

Why ETH Is Regaining Investor Focus — Lexenvide OverviewAfter several months of relative stagnation, Ethereum (ETH) has returned to the spotlight for both institutional and retail investors. Since the beginning of June, ETH has strengthened by more than 15%, breaking through key resistance levels and showing signs of renewed momentum.
At Lexenvide, we view ETH’s rise not as a short-term speculation, but as the result of a combination of fundamental drivers, improved technical structure, and growing expectations around infrastructure upgrades.
What’s Driving Renewed Interest in ETH?
Approval of Ethereum ETF in the U.S.
The SEC’s decision to approve a spot Ethereum ETF (expected this summer) has been a key catalyst for renewed interest. Similar to the Bitcoin ETF, it opens the door for institutional capital — including pension and index funds — to enter the Ethereum ecosystem.
Rising Activity in DeFi and Staking
Following the Dencun upgrade in March, network fees have dropped, sparking renewed activity in DeFi protocols, particularly in L2 solutions like Arbitrum and Optimism. At the same time, staking volumes are rising: according to Beacon Chain data, the share of staked ETH is approaching 27%.
Strengthening Market Structure
Amid moderate volatility, ETH is increasingly being seen as the “second digital gold,” especially in the context of a shaky stock market. Token supply reduction via burning (EIP-1559) is also adding upward pressure on price.
Cryptocurrencies in Central Bank in 2025 — Analysis by BITDPSThe global financial architecture is shifting, driven by a dual erosion of trust: from the dollar to gold, and from traditional currencies to digital assets. In 2025, central banks around the world are revising their strategies to include assets once considered alternative — gold and cryptocurrencies.
At BITDPS, we analyze global central bank portfolio decisions and observe that gold and digital assets are no longer viewed as opposites, but as complementary.
Gold: A Safe-Haven Asset Amid Geopolitical Tensions
According to the World Gold Council (WGC), central banks have added over 1,200 tonnes of gold to their reserves since the beginning of 2024 — a record high in recent decades. Key reasons include:
Geopolitical instability;
Erosion of trust in the dollar due to U.S. monetary expansion;
Strengthening of local currencies in emerging economies (India, China, Turkey).
Gold is once again being seen as a neutral and sanction-resistant asset, especially in the face of secondary sanctions and potential exclusion from SWIFT.
Cryptocurrencies: Cautious Integration, Not Ignorance
While Bitcoin and other cryptocurrencies are not yet part of official reserves, some central banks are:
Testing CBDCs inspired by blockchain infrastructure;
Exploring asset tokenization models, including bonds and gold;
Investing in research on digital financial tools for cross-border settlements.
🗨️ “It’s not about buying Bitcoin — it’s about transforming how we think about money,” emphasizes a BITDPS analyst.
BITDPS Conclusion
In 2025, gold is solidifying its role in central bank portfolios as a hedge against political and currency risks. Cryptocurrencies, meanwhile, are emerging as catalysts for digital reform and technological experimentation. Both asset classes are now core components of long-term resilience strategies.
Stabilization or New Growth Wave? — Analysis by Paribas GroupThe launch of spot Bitcoin ETFs and the anticipation of similar approval for Ethereum have been among the key drivers of crypto market growth in the first half of 2025. However, after the initial liquidity inflows, the market has shifted into a sideways consolidation phase. This has investors asking: have we reached the peak, or is the market preparing for its next move?
At Paribas Group, we see the current state as a phase of consolidation — not the end of the cycle. Growth fueled by ETFs is not just a “one-day hype” but a structural change in how investors access crypto assets.
What Have ETFs Brought to the Crypto Market?
With ETF launches in the U.S., followed by expansion into Europe and Asia, cryptocurrencies have, for the first time, gained institutionally regulated access:
Over $15 billion in net inflows into Bitcoin ETFs in the first five months;
New classes of investors — pension funds, insurance firms, asset managers;
Reduced asset volatility amid more stable liquidity.
This is shaping a new investment culture: shifting from short-term speculation to long-term positioning.
Why Has the Market Slowed Down?
Following the initial surge, several developments occurred:
Profit-taking by retail participants;
Capital rotation between Bitcoin and Ethereum in anticipation of an ETH ETF;
Waiting for new catalysts — such as Fed monetary policy, DeFi regulation, and ETF rollouts in Asia.
🗨️ “Market silence is not weakness — it’s a phase of accumulation,” notes a Paribas Group analyst.
Paribas Group Conclusion
We expect a second wave of crypto market growth in the second half of 2025, provided the following factors align:
Approval of an Ethereum ETF and rising institutional interest in altcoins;
Easing of monetary policy;
Progress in the legal framework for DeFi and asset tokenization.
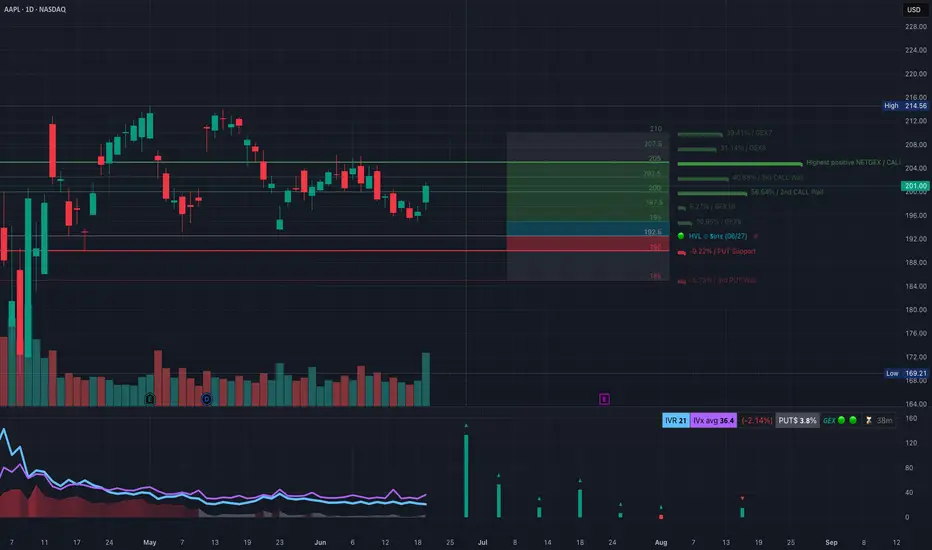
AAPL at a Key Breakout Zone! Can Bulls Hold This Level?🔍 Technical Analysis Overview (Daily + 1H)
Apple (AAPL) just printed a powerful bullish candle, reclaiming $201 with strong volume. This move broke above recent consolidation and swept minor liquidity under $196 before reclaiming key levels. From a Smart Money Concepts (SMC) lens, we’ve confirmed a bullish CHoCH and BOS (Break of Structure), with price now entering a potential supply zone.
* Trend: Short-term reversal to the upside.
* Volume: Strong breakout volume supports bullish continuation.
* Liquidity Sweep: Price swept lows around $195 and reclaimed — a classic SMC setup.
* Rejection Watch: Overhead supply around $202–$204 is the next test zone.
🧠 Key Levels to Watch
* Resistance Zones:
* $202.5 → GEX3rd CALL Wall
* $204 → Highest positive NetGamma / Call Bias
* $207.5 → GEX2
* Support Zones:
* $197.5 → GEX9
* $192 → HVL + 50% Zone
* $190 → GEX Put Support
* $185 → 3rd Put Wall
⚙️ Options Sentiment (GEX Analysis)
* 📈 GEX Tilt: Call walls dominating from $200 → $210.
* 🧲 Gamma Magnet: $202–$205 could act as a magnet zone short-term.
* ❗ Volatility: IV Rank at 21 and IV% below avg = room to expand.
* 🛡️ Put Protection: Strong GEX support around $190–$192 — buyers stepped in here.
🔄 Intraday Outlook (1H Chart)
Price already filled the green demand zone (~$195–$197), swept key liquidity, and confirmed CHoCH. The strong bullish engulfing candle closed above the descending trendline and is now entering the supply zone marked in red.
* 📌 Possible Scenarios:
* Bullish: If price reclaims and holds above $201.30 → watch for $204–$205 squeeze.
* Bearish: Rejection at $202–$204 and loss of $200 could push us back to $197 retest.
🔁 Scalping Levels
* Breakout Long Trigger: Above $202.5
* 🎯 Target: $204.5 → $207
* ❌ Stop: Below $200.3
* Short-term Reversal Short: From $203.5–204 zone
* 🎯 Target: $200.5 then $198
* ❌ Stop: Above $205
🎯 Swing Trade Plan
* Entry: $200.50–201.00 zone (hold retest)
* Stop: $196.5
* Target:
* TP1 = $204.5
* TP2 = $207.5
* TP3 = $210
🧠 Final Thoughts
AAPL is entering a high-confluence zone both technically and via options data. If bulls hold above $200, there’s a strong chance we tag $204+ soon. But keep in mind — heavy resistance above may cause choppiness. Ideal strategy? Trail stops tight and scale out into GEX walls.
Disclaimer: This analysis is for educational purposes only and does not constitute financial advice. Always do your own research and manage your risk.
AAPL ema sloping downHeard about Trump's lil phone. Chile...
Well AAPL i aiming for 195 - 193. With this trump phone news, I am thinking it can go lower... toward my blue line. Not all in one day, but not regaining 201 and holding it is not good.
Hoping this posts as I have been having issues publicly posting over the last 2 weeks.
