/MES S&P Futures (ChopDay)Good morning guys here we have a 4hr ES Futures chart that I created clearly showing you a Yellow dotted bounding box which shows what I call a No Trade Zone / Institutional Liquidity Grab. In simple terms " Dont Trade / sit on your hands "
It seems that we are consolidating and awaiting for market direction either Up or Down, my educated guess is that we may have a little pump but higher probability to the downside based on my studies. You will see wicks above and below the bodies of the 4hr candles, that to me tells a story, what is the story? A day where the market will chop around most likely and take your money it is Bulls too scared to move higher and Bears scared to pull the trigger to the downside thinking they will get trapped but in my eyes the market is overbought and exhausted, it needs a break. Does it mean that it will drop, absolutely NOT, the market can in fact continue to push higher if it wants but in my opinion, it seems that down should be the way at least for the next few weeks or months.
ISP1! trade ideas

Follow through to the upside is expectedFollow through to the upside in the S&P 500 daily chart is expected for Tuesday after the dramatic return of buyers on Monday.


Path into Q3Outlook for the Next Few Months
• Now–August OpEx: -2.5% to -5% slow correction
• August–September OpEx: potential 5–7.5% additional decline
• By late Q3: cumulative 10–12.5% drawdown (target S&P ~5700).
• October: possible bounce — or acceleration if data worsens
• End of Year: risk of deep drop à la Oct–Dec 2018 if trends continue
Macro Backdrop
• Watch for margin compression, CPI surprise, and unemployment uptick
• Private data shows more fragility than government numbers
• QRA-driven liquidity tightening may amplify downside risk
Political Timing and Fed Policy
• Administration may welcome controlled decline to enable early 2026 rate cuts
• If market doesn’t decline soon, blow-off top/melt-up into midterms possible

ES - Daily Session Trade Plan - Update August 4th, 2025 8am EST update -
Overnight price found a low at 6252 reached 6310 as the high. 6296, 6277, 6252 are the 3 main supports below. A flush and level reclaim of any of these supports should see price continue higher with targets of 6325, 6350, 6375.
IF price loses 6252 or Fridays low at 6240, these would be the higher quality levels we would want price to flush and reclaim for a move higher.
6297 support holds and we break the overnight high at 6310, the back test of this breakout would be worth a level to level move up to 6325.
The main levels I am watching is 6252 or 6240 to be tested, flushed and reclaimed. It would be best to wait for the 9:30am open and see how price reacts. I could see price flush in the first 30 mins, then catch bears offside and reclaim the Fridays lows. That would be a great short squeeze area to ride a couple of levels of back testing the overnight price.
Below Fridays lows and I will be waiting for price to build structure at the supports of 6225, 6210, 6194, 6175. If ES is selling hard into these areas, I would wait to enter any longs until I see structure build and reclaim the levels I have outlined. Let price come to you and be patient.

S&P 500 Intraday & Swing Entries H1 entry is close to getting activated for intraday.
If you want a swing trade then wait for H4 entry (you might be waiting a while obviously)
Reason for entries - We have broken out of Balance since July 25th and currently in a trend phase until we establish a new value area, or return to the one we broke out from.
So since Trend and Momentum is UP, then we should find Low Volume Areas to enter in the direction of the trend for a classic pullback entry trade.
07/30/25 Trade Journal, and ES_F Stock Market analysis EOD accountability report: +960
Sleep: 5 hours
Overall health: still struggling with sleep due to heat waves
VX Algo System Signals from (9:30am to 2pm)
— 8:30 AM Market Structure flipped bearish on VX Algo X3!✅
— 9:45 AM Market Structure flipped bullish on VX Algo X3! ✅
— 10:30 AM Market Structure flipped bullish on VX Algo X3!❌
— 11:30 AM Market Structure flipped bearish on VX Algo X3!❌
— 12:00 PM VXAlgo NQ X1DD Buy Signal, ✅
— 12:30 PM Market Structure flipped bullish on VX Algo X3!✅
What’s are some news or takeaway from today? and What major news or event impacted the market today?
I have started to noticed that the last 3 days, we have been getting false triggers on market structure signals and it almost feels MM are trying to do it to break people's algo that trade on that.
This is a good reminder that no matter how successful the signal has been for the last 30 days, you still need to have risk management. additionally, it's also a good way to test people's faith and trick new traders in going back to doing random things because it makes them think market can behave randomly and nothing works.
this is why i always tell people to religiously test out a system for 30 days before giving up.
News
*FEDERAL RESERVE SKIPS RATE CUT, KEEPS FED FUNDS RATE AT 4.50%
What are the critical support levels to watch?
--> Above 6410= Bullish, Under 6400= Bearish

/ES held its main channel!ES held its main channel in the early 2025 dip. Now currently inside the red megaphone with a breakout target of 7500.

Tech Earnings & Fed Meeting - July 30th - ES 100pt drop?I trade ES Futures and have identified an important support shelf that if broken could accelerate lower.
There is lower monthly volume below 6400 area. The monthly Point of Control is currently at 6300. The monthly 61.8% retracement is 6316. We have a fed meeting today and while trapping can happen, my lean is that we lose the 6400 level this week and could reach the 6316 target very quickly. Each level drawn are the more significant levels as to where institutional buyers may step in.

Stock Index Matrix: ES, NQ, YM Weekly BiasES: $6,323.25
NQ: $23,171.50
YM: $44,504
Bearish for all markets mentioned

ES Scenario 2 29-07Finally, scenario 2 was realized today, touching and perfectly respecting the levels that we had previously indicated, rising upwards to the equilibrium point and then continuing downwards. While the Nasdaq was more bullish at the beginning, it also fell quite a bit.

POC Pressure Cooker – MES Prepares for VolatilityWe’re heading into the NY session with MES balancing between key levels. The 50% retracement of the recent range (6436) is acting as a pivot, while the POC at 6428 is the immediate area of interest. The structure is tight here’s both sides of the play:
Key Levels to Watch:
- Upper Range: 6457–6460 (recent swing high)
- Mid-Range Pivot: 6436 (Fib 50%)
- POC & Support Zone: 6428 (volume shelf)
- Lower Range: 6415 → 6400
🟩 Bullish Scenario
A breakout and hold above 6440–6445 could lead to a retest of 6457–6460, with potential continuation to 6470+ if momentum accelerates.
- Confluence: Higher low structure above 6428, EMAs curling up, and price reacting positively to POC.
- Invalidation: Clean break and close below 6428.
🟥 Bearish Scenario
A failure to hold 6430 and a push through 6428 (POC) could see sellers target 6415, then possibly 6400.
- Confluence: Descending red trend line still capping price, and VWAP rejections could support a downside move.
- Invalidation: Break above 6457 with strong buyer aggression.
Staakd Notes:
This is a range-play environment. The real edge is in waiting for a break + retest of 6440 or 6428 to confirm direction. NY open volatility is likely to provide a fake out before the true move. Give it 30 mins from open.
Closing Line:
“Price is coiled between POC and the 50% mark. We’ll let NY open show its hand then react, not predict.”

29 july 2025Possible short on ES. NY took out the previous day's high while ES did not, thus forming an SMT. There is a 4 hour poor low from the previous week's wednesday and relative equal lows on friday.
As we are approaching the end of the month there could very well be a sell off to put in the month's wick before continuing higher next week.

NQ & ES Key Levels 29-07-2025These are the most sensitive points today and only these two scenarios can exist. Take advantage of these key levels for short term trades, scalps or swing trades

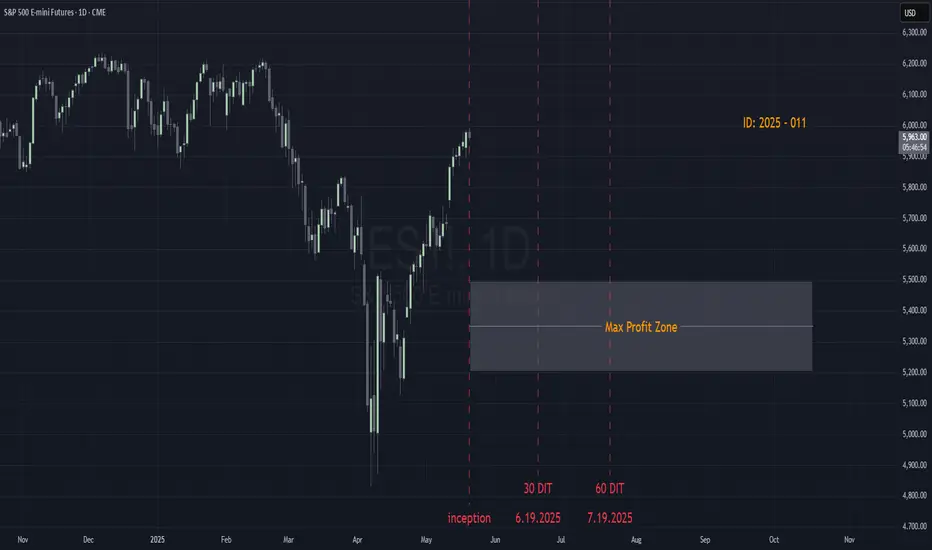
ID: 2025 - 0095.5.2025
Trade #9 of 2025 executed.
Trade entry at 137 DTE (days to expiration).
Trade construct is a PDS (put debit spread) at Delta 15 combined with a PCS (put credit spread) at Delta 15. Overlapping short strikes give it the "unbalanced" butterfly nomenclature.
Sizing and strike selection is designed to keep the risk/reward "AT EXPIRATION" to a 1:1 risk profile. This lets charm work it's magic (second order greek), while exploiting the fact that this is a non-directional bias. The process is a disciplined and systematic approach letting time decay evaporate the extrinsic time value from the short options until target profit is achieved.
OF NOTE: This trade opened at EXCELLENT fills, and there is zero risk to the upside. The danger is of a catastrophic move to the downside, which will bring in phenomenal gains for ID 006 and 008. 😊
Happy Trading!
-kevin


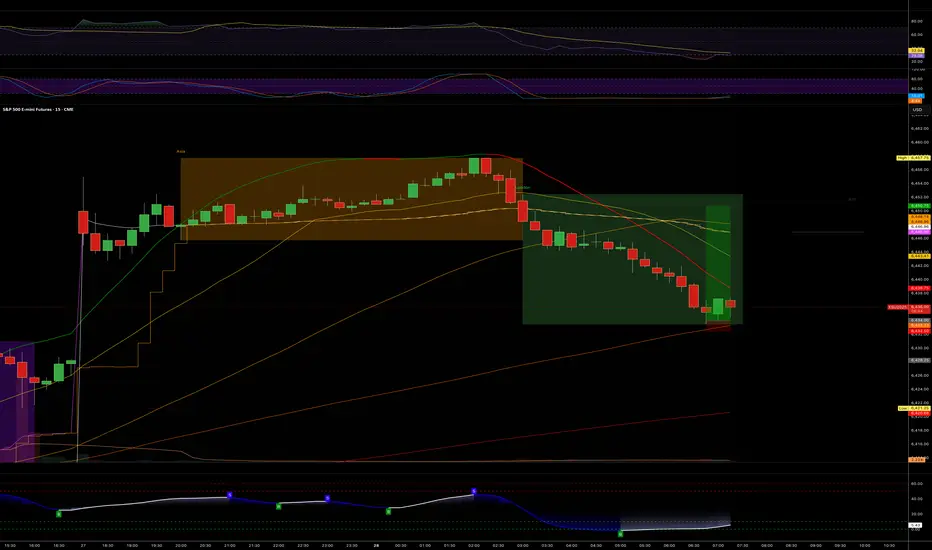
Early entry on !ES New York Session?If London -> New York session will be a reversal, this may be a solid entry...
- Lower time frames showing RSI Divergence (bottoming out).
- Higher time frames look like it could be a v shape recovery.
From a macro standpoint, I am anticipating a volatile week. A lot of news - but nothing today (monday). It would not surprise me to see Monday do the inverse of what is to come later in the week. So I am not trading today, outside of what is currently in position (Long Silver, Gold, & ES).
07/25/25 Trade Journal, and ES_F Stock Market analysis
EOD accountability report: +228
Sleep: 5 hours
Overall health: Still struggling to catch up on sleep. gonna take gg sleeping pills today
** VX Algo System Signals from (9:30am to 2pm) **
— 9:07 AMMarket Structure flipped bearish on VX Algo X3! :white_check_mark:
— 9:53 AM Market Structure flipped bullish on VX Algo X3! :white_check_mark:
— 10:30 AM Market Structure flipped bullish on VX Algo X3! :white_check_mark:
— 11:00 AM VXAlgo ES X1 Sell Signal :x:
**What’s are some news or takeaway from today? and What major news or event impacted the market today? **
Market structure algo was flipping a lot today, even in premarket, which tells me that MM was changing position a lot and things could be unreliable so i decided to end the trading day early at $200 and closed up shop on my main acccount.
**News**
*S&P 500 ENDS AT A NEW RECORD HIGH
**What are the critical support levels to watch?**
--> Above 6395= Bullish, Under 6372= Bearish
Video Recaps -->https://tradingview.sweetlogin.com/u/WallSt007/#published-charts

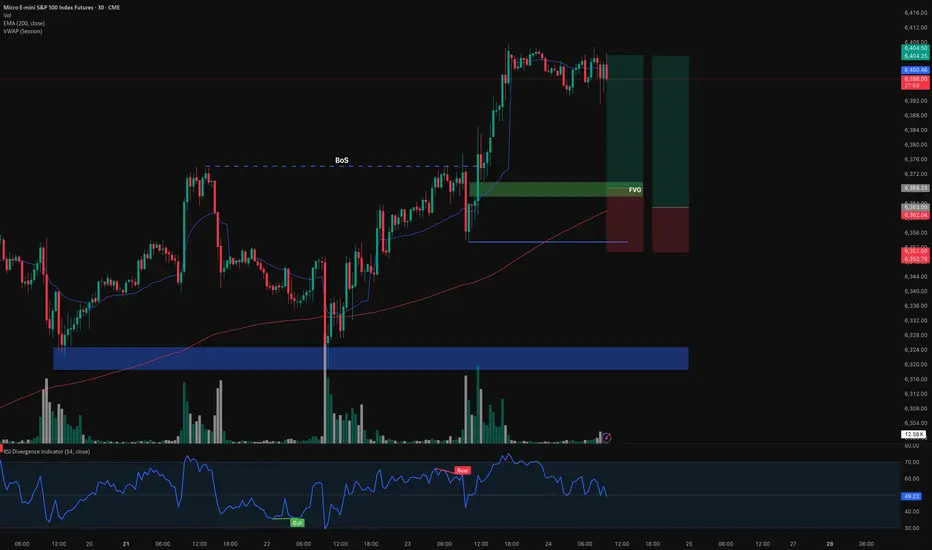
Long MES I see CME_MINI:ESU2025 is on a uptrend with a BOS( break of structure) at $6421, there is a trend line marked in blue that has been tested several times.
There is a support in confluence with POC area from a previous session. Above VWAP → Favorable for short positions (or considered expensive for long positions).
Below VWAP → Favorable for long positions (or considered expensive for sellers).
Personally, I build my position in zones — especially around key levels like order blocks, imbalance fills, or liquidity sweeps (Smart Money Concepts). I prefer scaling in when entering trades to catch better prices.


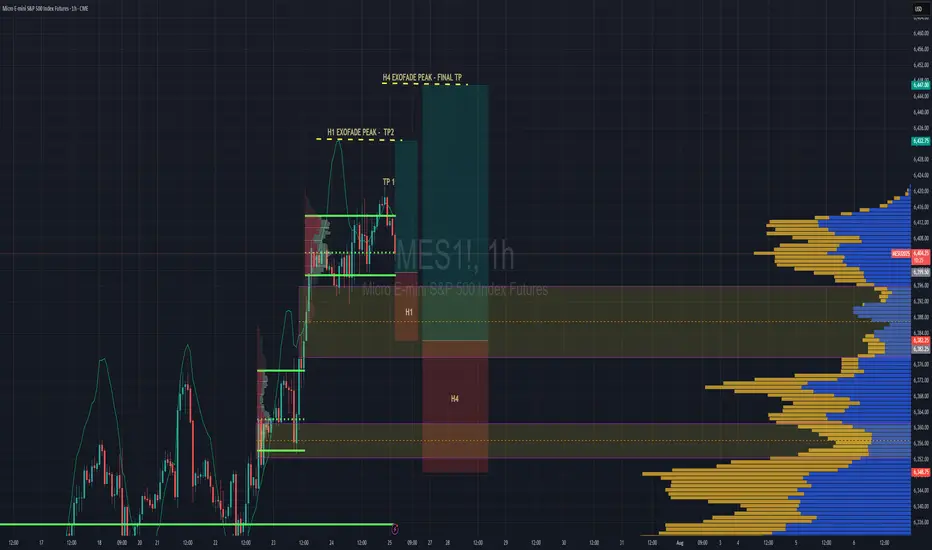
Long MESentry 6338
stop loss 6351
TP 6404.50
1. currently in a uptrend
2. FVG at 6368
3. above 200ema
Before I enter my trade at Id like to look for some market structure to form.
if it breaks below 6353.5 and makes a ChoCh im no longer bullish
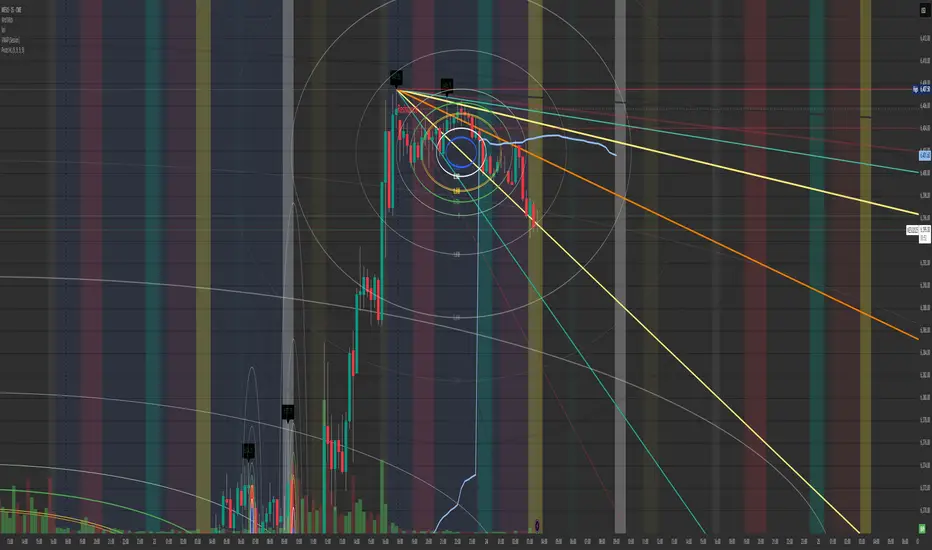
$ES and $NQ look to be dropping like a hot rock after the close.Looking at the Fib Circles and the previous day high along with the Gann. Well I know this is the micro ES but they run at the same % of p/l. If you notice how the high during yesterdays session and the low. Notice the Blue circle in the center?
Any and every time I can draw out the circle from high to low daily levels from past to current. (as you have seen in my previous examples.) Either the trend completely hits the limit of the blue circle. Than reverts to the buyers stepping up or sellers dropping down below the blue circle. Its like a plague to the momentum of the market and can change it in any direction.
I have noticed this as well. If the bid/ask price is within it during the time of the candle. It jumps or completely runs down through it meaning that I believe its a good place to either buy in any uptrend or sell in a Monthly/weekly/daily/hourly analytic.
That's what the Gann Fibonacci level tool is useful for in my eyes. If the trend keeps going down below any level I find that there's probably about a 10%-20% chance it will keep going down.
For me the Gann Is better than any trendline because it shows the fib along with the trend.
Not investment advice just a perspective I have had working with it since someone showed the wrong way. Than I remembered Highs first down to Lows of the tf, being it 15 min/hourly/daily/Weekly/Monthly.
Just a thought
Anyone have any opinions?
If so give me a ring and follow so I can get chart ideas that will great fully improve my futures trades.
Have a profitable day and be safe all.
Paul.
ID: 2025 - 0115.20.2025
Trade #11 of 2025 executed.
Trade entry at 150 DTE (days to expiration).
Excellent fills this morning, well under mid.
Target profit is 5% ROI
Happy Trading!
-kevin