S&P 500: The Underlying Trend Remains BullishLast week, the S&P 500 index entered a consolidation phase amid a packed fundamental calendar. The Fed’s monetary decision, PCE inflation, the NFP report, and trade negotiations all triggered short-term profit-taking. However, this consolidation has remained technically well-structured, with key supports intact, and the broader trend remains bullish.
Let’s conduct a technical assessment as this week unfolds under geopolitical pressure, with the Friday, August 8 ultimatum set for Russia.
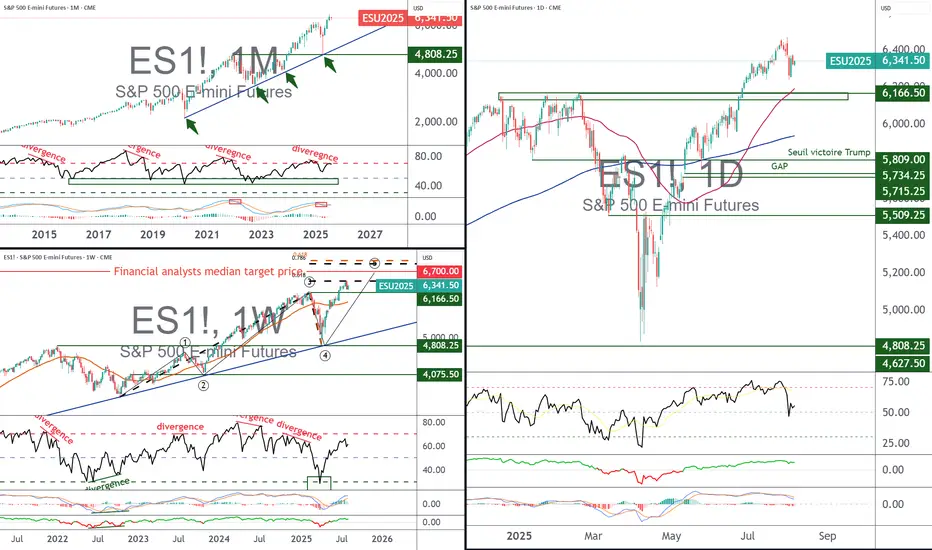
1. The underlying trend in the S&P 500 remains bullish above the major support at 6050/6150 points
Let’s first examine the different timeframes for the S&P 500 futures contract. The triptych below shows monthly, weekly, and daily candlesticks. All three timeframes send the same message: the underlying trend in the S&P 500 remains bullish as long as the major support at 6050/6150 points holds on a weekly closing basis. This support zone corresponds to the former all-time high from last winter. In the short term, a retest of the support cannot be ruled out before the trend resumes.
2. Quantitative analysis does not show an overbought situation, with the percentage of stocks above the 50-day moving average still below extreme levels
Last week’s consolidation helped deflate a potential overbought condition. The percentage of S&P 500 stocks trading above their 50-day moving average was approaching an overbought zone, but is now back to 50%, giving the index renewed capacity to resume its bullish trend.
3. The Dow Jones is in an accumulation phase below its all-time high
The Dow Jones also shows a promising technical setup, potentially forming a bullish continuation inverse head-and-shoulders pattern. A breakout above the 45,000-point resistance is needed to confirm this signal. The equal-weighted S&P 500 index shows a similar technical structure.
4. Retail investor sentiment is still far from euphoric extremes
Market tops are always built in euphoria, especially among retail traders. According to the latest data from the American Association of Individual Investors (AAII), buying interest has increased and is slightly above the historical average, but still far from its typical overheating zone. This sentiment indicator confirms that the underlying trend in the S&P 500 remains bullish above the 6050/6150-point support (based on S&P 500 futures).
DISCLAIMER:
This content is intended for individuals who are familiar with financial markets and instruments and is for information purposes only. The presented idea (including market commentary, market data and observations) is not a work product of any research department of Swissquote or its affiliates. This material is intended to highlight market action and does not constitute investment, legal or tax advice. If you are a retail investor or lack experience in trading complex financial products, it is advisable to seek professional advice from licensed advisor before making any financial decisions.
This content is not intended to manipulate the market or encourage any specific financial behavior.
Swissquote makes no representation or warranty as to the quality, completeness, accuracy, comprehensiveness or non-infringement of such content. The views expressed are those of the consultant and are provided for educational purposes only. Any information provided relating to a product or market should not be construed as recommending an investment strategy or transaction. Past performance is not a guarantee of future results.
Swissquote and its employees and representatives shall in no event be held liable for any damages or losses arising directly or indirectly from decisions made on the basis of this content.
The use of any third-party brands or trademarks is for information only and does not imply endorsement by Swissquote, or that the trademark owner has authorised Swissquote to promote its products or services.
Swissquote is the marketing brand for the activities of Swissquote Bank Ltd (Switzerland) regulated by FINMA, Swissquote Capital Markets Limited regulated by CySEC (Cyprus), Swissquote Bank Europe SA (Luxembourg) regulated by the CSSF, Swissquote Ltd (UK) regulated by the FCA, Swissquote Financial Services (Malta) Ltd regulated by the Malta Financial Services Authority, Swissquote MEA Ltd. (UAE) regulated by the Dubai Financial Services Authority, Swissquote Pte Ltd (Singapore) regulated by the Monetary Authority of Singapore, Swissquote Asia Limited (Hong Kong) licensed by the Hong Kong Securities and Futures Commission (SFC) and Swissquote South Africa (Pty) Ltd supervised by the FSCA.
Products and services of Swissquote are only intended for those permitted to receive them under local law.
All investments carry a degree of risk. The risk of loss in trading or holding financial instruments can be substantial. The value of financial instruments, including but not limited to stocks, bonds, cryptocurrencies, and other assets, can fluctuate both upwards and downwards. There is a significant risk of financial loss when buying, selling, holding, staking, or investing in these instruments. SQBE makes no recommendations regarding any specific investment, transaction, or the use of any particular investment strategy.
CFDs are complex instruments and come with a high risk of losing money rapidly due to leverage. The vast majority of retail client accounts suffer capital losses when trading in CFDs. You should consider whether you understand how CFDs work and whether you can afford to take the high risk of losing your money.
Digital Assets are unregulated in most countries and consumer protection rules may not apply. As highly volatile speculative investments, Digital Assets are not suitable for investors without a high-risk tolerance. Make sure you understand each Digital Asset before you trade.
Cryptocurrencies are not considered legal tender in some jurisdictions and are subject to regulatory uncertainties.
The use of Internet-based systems can involve high risks, including, but not limited to, fraud, cyber-attacks, network and communication failures, as well as identity theft and phishing attacks related to crypto-assets.
ISP1! trade ideas
Neutral zone trade formingThe daily structure in the S&P 500 implies this set up for a neutral zone market environment which means a sideways move. The market is waiting for information to create a directional move.

Day 2 — Trading Only S&P Futures — -$100, Grinding Back from Los Day 2 — Trading Only S&P Futures
Daily P/L: -100
Sleep: 8 hours
Emotions: Good
:thought_balloon: Today’s Trade thoughts:
I rushed into a trade thinking 6330 was going to be a good area of support to buy and oversized my position going 5 mes deep in my first trade and adding 5 more at the 48 min MOB at 6325 and got stopped out at the bottom down -400 and pretty much spent the rest of the day grinding back up.
Overall market seem to have rejected the higher timeframe resistance and deciding which direction to go.
:bell:News Highlights:
U.S. STOCKS END LOWER, VIX JUMPS AFTER WEAK ISM SERVICES DATA
:bar_chart: VX Algo Signals (9:30am – 2pm EST):
— 9:30 AM VXAlgo ES X1 Buy signal
— 9:40 AM VXAlgo NQ X1 Buy Signal
— 9:48 AM Market Structure flipped bullish on VX Algo X3!
— 11:00 AM VXAlgo ES X1 Buy signal (triple buy signal)
— 12:50 PM VXAlgo NQ X1DD Sell Signal
— 1:00 PM Market Structure flipped bullish on VX Algo X3!
— 1:30 PM VXAlgo NQ X1DD Buy Signal**
:chart_with_upwards_trend: Key Levels for Tomorrow:
Above 6332 = Bullish
Below 6310 = Bearish

ES - August 5th/6th Opening Session - PlanI had identified a potential bear flag this afternoon and stated that we needed to lose 6324 to start moving lower with targets of 6306 and 6296. This is still valid, and I anticipate the opening session to start that sell off to these targets. IF, price moves above 6336 before breaking below 6324 then the bear flag will be invalid, and we continue up higher before a pull back.
I plan to update my August 6th Daily Plan by 7am EST. I am hoping we get a nice pull back overnight so we can find some good setups to long for points tomorrow!

ES THOUGHTSES is on the verge of retracing to its monthly 50% correction mark, so my bias is bearish. Price retrace up nicely, looking for shorts to go lower. simple, sweet and short.

ES - August 5th - Afternoon Update1:25pm EST - Afternoon Update.
Price looks to be building a bear flag from the am sell off. This would be validated with a loss of 6323 level and you could look to short down to 6310, 6298. I would take my profit at 6310, as you could get a short squeeze right below or at the 6298 level. As a long ES trader, shorting for 10pts is not my edge. IF, you like to short that would be what to watch for.
I am still looking for a long at 6298 or 6275-77 flush and reclaim of these levels. We need some volatility and we might get some after 2pm today.

/MES S&P Futures (ChopDay)Good morning guys here we have a 4hr ES Futures chart that I created clearly showing you a Yellow dotted bounding box which shows what I call a No Trade Zone / Institutional Liquidity Grab. In simple terms " Dont Trade / sit on your hands "
It seems that we are consolidating and awaiting for market direction either Up or Down, my educated guess is that we may have a little pump but higher probability to the downside based on my studies. You will see wicks above and below the bodies of the 4hr candles, that to me tells a story, what is the story? A day where the market will chop around most likely and take your money it is Bulls too scared to move higher and Bears scared to pull the trigger to the downside thinking they will get trapped but in my eyes the market is overbought and exhausted, it needs a break. Does it mean that it will drop, absolutely NOT, the market can in fact continue to push higher if it wants but in my opinion, it seems that down should be the way at least for the next few weeks or months.

Follow through to the upside is expectedFollow through to the upside in the S&P 500 daily chart is expected for Tuesday after the dramatic return of buyers on Monday.


ES - Daily Session Trade Plan - Update August 4th, 2025 8am EST update -
Overnight price found a low at 6252 reached 6310 as the high. 6296, 6277, 6252 are the 3 main supports below. A flush and level reclaim of any of these supports should see price continue higher with targets of 6325, 6350, 6375.
IF price loses 6252 or Fridays low at 6240, these would be the higher quality levels we would want price to flush and reclaim for a move higher.
6297 support holds and we break the overnight high at 6310, the back test of this breakout would be worth a level to level move up to 6325.
The main levels I am watching is 6252 or 6240 to be tested, flushed and reclaimed. It would be best to wait for the 9:30am open and see how price reacts. I could see price flush in the first 30 mins, then catch bears offside and reclaim the Fridays lows. That would be a great short squeeze area to ride a couple of levels of back testing the overnight price.
Below Fridays lows and I will be waiting for price to build structure at the supports of 6225, 6210, 6194, 6175. If ES is selling hard into these areas, I would wait to enter any longs until I see structure build and reclaim the levels I have outlined. Let price come to you and be patient.

S&P 500 Intraday & Swing Entries H1 entry is close to getting activated for intraday.
If you want a swing trade then wait for H4 entry (you might be waiting a while obviously)
Reason for entries - We have broken out of Balance since July 25th and currently in a trend phase until we establish a new value area, or return to the one we broke out from.
So since Trend and Momentum is UP, then we should find Low Volume Areas to enter in the direction of the trend for a classic pullback entry trade.
07/30/25 Trade Journal, and ES_F Stock Market analysis EOD accountability report: +960
Sleep: 5 hours
Overall health: still struggling with sleep due to heat waves
VX Algo System Signals from (9:30am to 2pm)
— 8:30 AM Market Structure flipped bearish on VX Algo X3!✅
— 9:45 AM Market Structure flipped bullish on VX Algo X3! ✅
— 10:30 AM Market Structure flipped bullish on VX Algo X3!❌
— 11:30 AM Market Structure flipped bearish on VX Algo X3!❌
— 12:00 PM VXAlgo NQ X1DD Buy Signal, ✅
— 12:30 PM Market Structure flipped bullish on VX Algo X3!✅
What’s are some news or takeaway from today? and What major news or event impacted the market today?
I have started to noticed that the last 3 days, we have been getting false triggers on market structure signals and it almost feels MM are trying to do it to break people's algo that trade on that.
This is a good reminder that no matter how successful the signal has been for the last 30 days, you still need to have risk management. additionally, it's also a good way to test people's faith and trick new traders in going back to doing random things because it makes them think market can behave randomly and nothing works.
this is why i always tell people to religiously test out a system for 30 days before giving up.
News
*FEDERAL RESERVE SKIPS RATE CUT, KEEPS FED FUNDS RATE AT 4.50%
What are the critical support levels to watch?
--> Above 6410= Bullish, Under 6400= Bearish

/ES held its main channel!ES held its main channel in the early 2025 dip. Now currently inside the red megaphone with a breakout target of 7500.

Tech Earnings & Fed Meeting - July 30th - ES 100pt drop?I trade ES Futures and have identified an important support shelf that if broken could accelerate lower.
There is lower monthly volume below 6400 area. The monthly Point of Control is currently at 6300. The monthly 61.8% retracement is 6316. We have a fed meeting today and while trapping can happen, my lean is that we lose the 6400 level this week and could reach the 6316 target very quickly. Each level drawn are the more significant levels as to where institutional buyers may step in.

Stock Index Matrix: ES, NQ, YM Weekly BiasES: $6,323.25
NQ: $23,171.50
YM: $44,504
Bearish for all markets mentioned

ES Scenario 2 29-07Finally, scenario 2 was realized today, touching and perfectly respecting the levels that we had previously indicated, rising upwards to the equilibrium point and then continuing downwards. While the Nasdaq was more bullish at the beginning, it also fell quite a bit.

POC Pressure Cooker – MES Prepares for VolatilityWe’re heading into the NY session with MES balancing between key levels. The 50% retracement of the recent range (6436) is acting as a pivot, while the POC at 6428 is the immediate area of interest. The structure is tight here’s both sides of the play:
Key Levels to Watch:
- Upper Range: 6457–6460 (recent swing high)
- Mid-Range Pivot: 6436 (Fib 50%)
- POC & Support Zone: 6428 (volume shelf)
- Lower Range: 6415 → 6400
🟩 Bullish Scenario
A breakout and hold above 6440–6445 could lead to a retest of 6457–6460, with potential continuation to 6470+ if momentum accelerates.
- Confluence: Higher low structure above 6428, EMAs curling up, and price reacting positively to POC.
- Invalidation: Clean break and close below 6428.
🟥 Bearish Scenario
A failure to hold 6430 and a push through 6428 (POC) could see sellers target 6415, then possibly 6400.
- Confluence: Descending red trend line still capping price, and VWAP rejections could support a downside move.
- Invalidation: Break above 6457 with strong buyer aggression.
Staakd Notes:
This is a range-play environment. The real edge is in waiting for a break + retest of 6440 or 6428 to confirm direction. NY open volatility is likely to provide a fake out before the true move. Give it 30 mins from open.
Closing Line:
“Price is coiled between POC and the 50% mark. We’ll let NY open show its hand then react, not predict.”

29 july 2025Possible short on ES. NY took out the previous day's high while ES did not, thus forming an SMT. There is a 4 hour poor low from the previous week's wednesday and relative equal lows on friday.
As we are approaching the end of the month there could very well be a sell off to put in the month's wick before continuing higher next week.

NQ & ES Key Levels 29-07-2025These are the most sensitive points today and only these two scenarios can exist. Take advantage of these key levels for short term trades, scalps or swing trades

ID: 2025 - 0095.5.2025
Trade #9 of 2025 executed.
Trade entry at 137 DTE (days to expiration).
Trade construct is a PDS (put debit spread) at Delta 15 combined with a PCS (put credit spread) at Delta 15. Overlapping short strikes give it the "unbalanced" butterfly nomenclature.
Sizing and strike selection is designed to keep the risk/reward "AT EXPIRATION" to a 1:1 risk profile. This lets charm work it's magic (second order greek), while exploiting the fact that this is a non-directional bias. The process is a disciplined and systematic approach letting time decay evaporate the extrinsic time value from the short options until target profit is achieved.
OF NOTE: This trade opened at EXCELLENT fills, and there is zero risk to the upside. The danger is of a catastrophic move to the downside, which will bring in phenomenal gains for ID 006 and 008. 😊
Happy Trading!
-kevin


Early entry on !ES New York Session?If London -> New York session will be a reversal, this may be a solid entry...
- Lower time frames showing RSI Divergence (bottoming out).
- Higher time frames look like it could be a v shape recovery.
From a macro standpoint, I am anticipating a volatile week. A lot of news - but nothing today (monday). It would not surprise me to see Monday do the inverse of what is to come later in the week. So I am not trading today, outside of what is currently in position (Long Silver, Gold, & ES).
07/25/25 Trade Journal, and ES_F Stock Market analysis
EOD accountability report: +228
Sleep: 5 hours
Overall health: Still struggling to catch up on sleep. gonna take gg sleeping pills today
** VX Algo System Signals from (9:30am to 2pm) **
— 9:07 AMMarket Structure flipped bearish on VX Algo X3! :white_check_mark:
— 9:53 AM Market Structure flipped bullish on VX Algo X3! :white_check_mark:
— 10:30 AM Market Structure flipped bullish on VX Algo X3! :white_check_mark:
— 11:00 AM VXAlgo ES X1 Sell Signal :x:
**What’s are some news or takeaway from today? and What major news or event impacted the market today? **
Market structure algo was flipping a lot today, even in premarket, which tells me that MM was changing position a lot and things could be unreliable so i decided to end the trading day early at $200 and closed up shop on my main acccount.
**News**
*S&P 500 ENDS AT A NEW RECORD HIGH
**What are the critical support levels to watch?**
--> Above 6395= Bullish, Under 6372= Bearish
Video Recaps -->https://tradingview.sweetlogin.com/u/WallSt007/#published-charts
