ISP1! trade ideas

Long MESentry 6338
stop loss 6351
TP 6404.50
1. currently in a uptrend
2. FVG at 6368
3. above 200ema
Before I enter my trade at Id like to look for some market structure to form.
if it breaks below 6353.5 and makes a ChoCh im no longer bullish
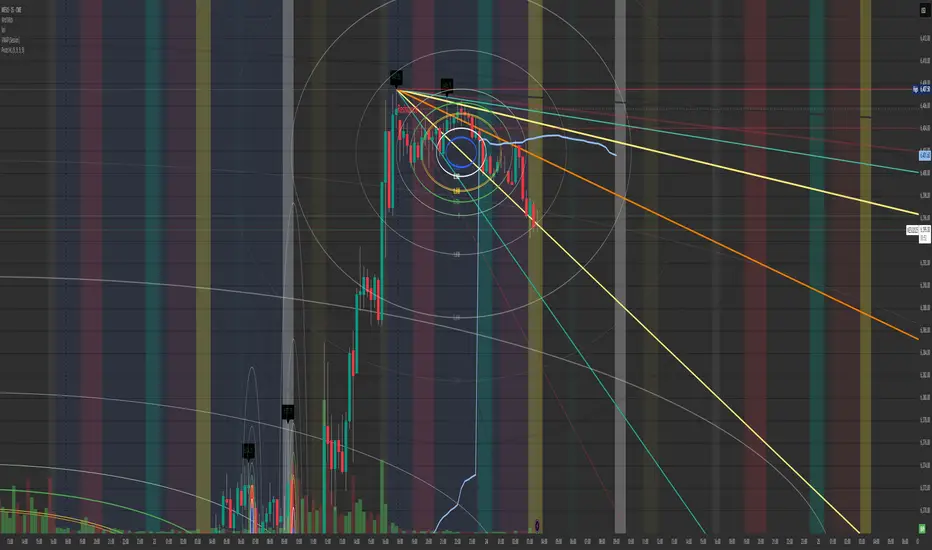
$ES and $NQ look to be dropping like a hot rock after the close.Looking at the Fib Circles and the previous day high along with the Gann. Well I know this is the micro ES but they run at the same % of p/l. If you notice how the high during yesterdays session and the low. Notice the Blue circle in the center?
Any and every time I can draw out the circle from high to low daily levels from past to current. (as you have seen in my previous examples.) Either the trend completely hits the limit of the blue circle. Than reverts to the buyers stepping up or sellers dropping down below the blue circle. Its like a plague to the momentum of the market and can change it in any direction.
I have noticed this as well. If the bid/ask price is within it during the time of the candle. It jumps or completely runs down through it meaning that I believe its a good place to either buy in any uptrend or sell in a Monthly/weekly/daily/hourly analytic.
That's what the Gann Fibonacci level tool is useful for in my eyes. If the trend keeps going down below any level I find that there's probably about a 10%-20% chance it will keep going down.
For me the Gann Is better than any trendline because it shows the fib along with the trend.
Not investment advice just a perspective I have had working with it since someone showed the wrong way. Than I remembered Highs first down to Lows of the tf, being it 15 min/hourly/daily/Weekly/Monthly.
Just a thought
Anyone have any opinions?
If so give me a ring and follow so I can get chart ideas that will great fully improve my futures trades.
Have a profitable day and be safe all.
Paul.
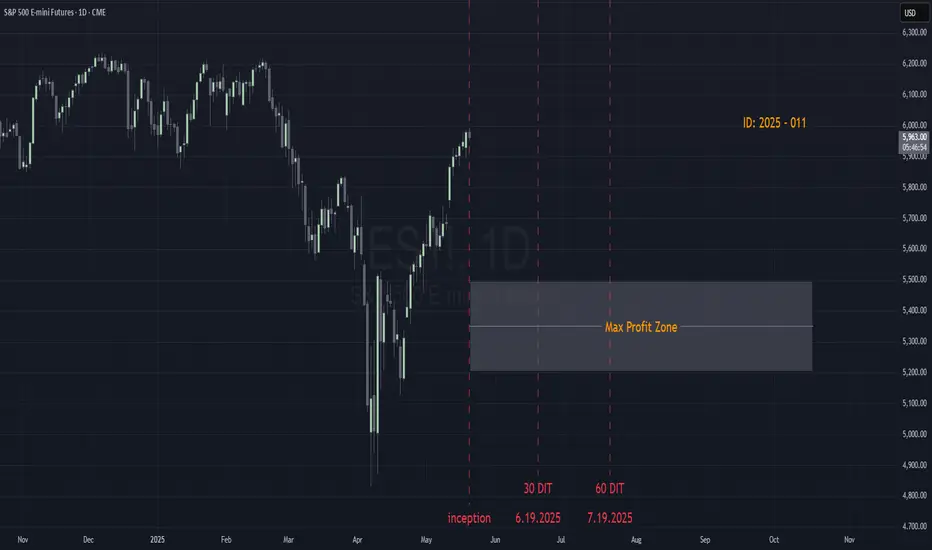
ID: 2025 - 0115.20.2025
Trade #11 of 2025 executed.
Trade entry at 150 DTE (days to expiration).
Excellent fills this morning, well under mid.
Target profit is 5% ROI
Happy Trading!
-kevin
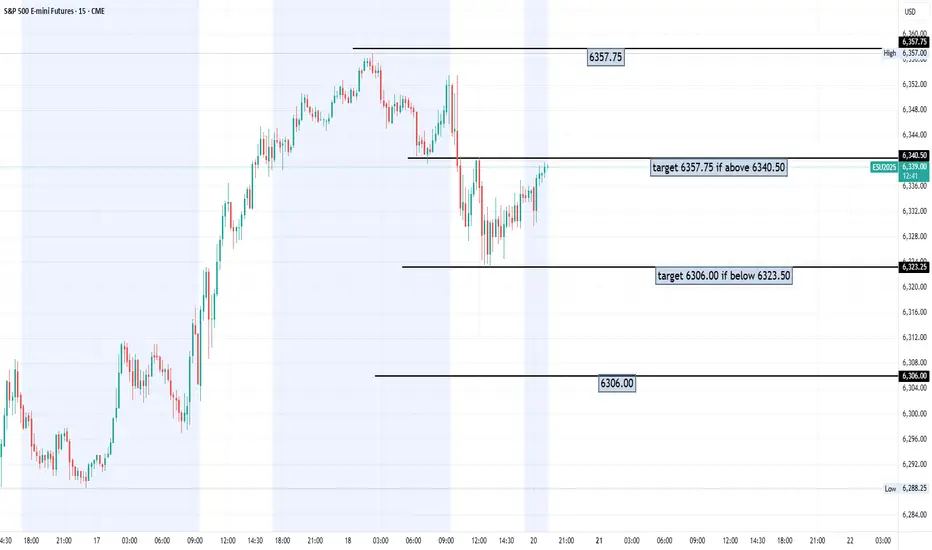
Buyers show convictionClose near the high of the Wednesday daily chart in the S&P 500 implies that buyers are showing conviction and willing to hold positions into the close. If these buyers are present the next price objective to close above would be 6415.

Bearish MovementIm expecting price to return to NY open (8AM (EST) Candle) and react there to return to the downside since it broke NY open structure. We are at the ATH at the moment which created a double top.
Lets see how this goes…

Expect Correction august/septemberMarkets MUST correct, everything is overbought and sentiment is Extreme greed. RSI points to extreme overbought territory, VIX very low and not going any lower (reached bottom).
Usually august/september the market corrects. so i expect a correction around 5-8%.
Be prepared, dont chase FOMO. Be careful.
SP:SPX TVC:SPX CBOE:SPX CBOE:XSP AMEX:SPY
Sideways to higherThe structure in the daily chart of the S&P 500 implies that Wednesday would trade inside of Tuesday's range and with a positive close possibly above Tuesday's high.

07/22/25 Trade Journal, and ES_F Stock Market analysis
EOD accountability report: +
Sleep: 6 hours
Overall health: Good
** VX Algo System Signals from (9:30am to 2pm) **
— 9:40 AM Market Structure flipped bearish on VX Algo X3!
— 10:20 AM VXAlgo ES X1 Buy signal
— 11:30 AM VXAlgo NQ X1DD Sell Signal
— 2:00 PM Market Structure flipped bullish on VX Algo X3!
**What’s are some news or takeaway from today? and What major news or event impacted the market today? **
Very clean trading day for me, signals worked out really well and everything played out accordingly
**News**
S&P 500 CLOSES AT A NEW ALL-TIME HIGH ABOVE 6,000
**What are the critical support levels to watch?**
--> Above 6339= Bullish, Under 6320= Bearish
Video Recaps -->https://tradingview.sweetlogin.com/u/WallSt007/#published-charts

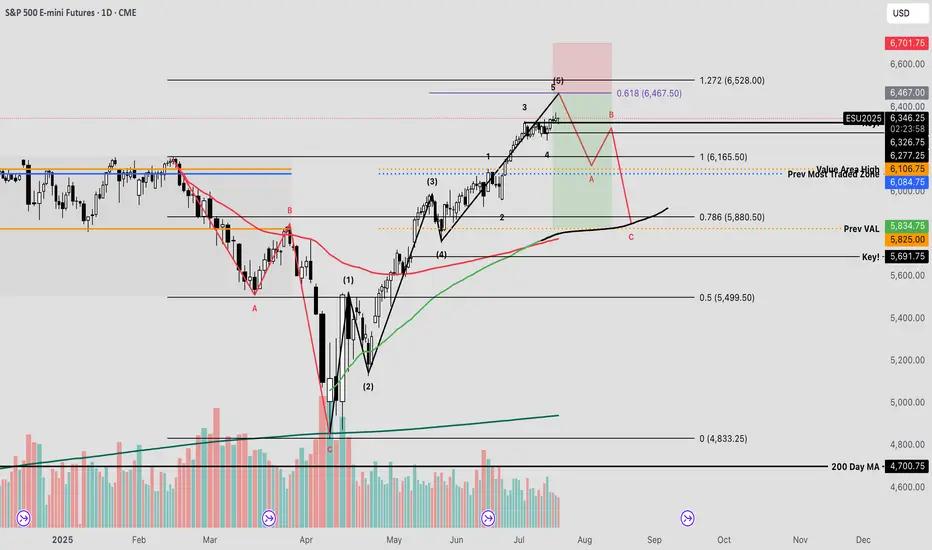
SPY The Final Countdown Since the April lows, equity markets have exhibited strong performance, with many stocks appreciating by nearly 100%—some even exceeding that threshold. Given the velocity of this rally, a corrective pullback may be imminent before the broader uptrend resumes.
The current reading on the Fear & Greed Index places market sentiment firmly within the "extreme greed" territory—historically a zone where investors often begin to lock in profits or initiate contrarian positions against the prevailing trend.
From a technical standpoint, I’ve conducted an Elliott Wave impulse analysis to evaluate the recent price structure. This method, which utilizes Fibonacci-based mathematical relationships, provides insight into the expansion and contraction phases of market cycles.
Using the trend-based Fibonacci extension tool, one can estimate potential termination zones for impulse waves. In the current scenario, the fifth wave appears to be approaching completion. By analyzing the proportional relationships between waves 1, 3, and 4, a key confluence level emerges at the 61.8% extension—commonly referred to as the “golden pocket”—just above the 6400 level on the futures chart.
I plan to set alerts at this price level to secure profits, hedge existing positions, and potentially initiate a short trade—should market structure confirm a reversal through a valid breakdown trigger.
Gold silver7.22 2025 gold is at a pivotal Junction and it looks bullish but it's come to ABCD patterns and reversal patterns that indicate that it could go lower and the silver it doesn't look quite the same but it's moving to levels that it hasn't been for a long period of time so this may indicate the possibility of a breakout higher. There are more details in the video and I think that coffee May go higher even though it may not look like a good trade but it's a trade you can take with very small risk and I talk about it more in the video. Palladium traded to an ABCD pattern and it looks very bullish but anything that looks like an ABCD pattern that's been filled you have to be concerned that it's going to reverse and take the market in the other direction.

Wait and seeAlthough the S&P 500 daily chart for Monday implies sellers coming into the market, the past behavior over the last few days has been a lack of follow-through to the downside. The market seems to be structuring itself to a wait and see approach. This means the markets waiting for additional information to respond directionally and it could be earnings that could stimulate this market.

DIYWallSt Trade Journal: $531 Profit & Navigating Volatile Morn**07/21/25 Trade Journal, and ES_F Stock Market analysis **
EOD accountability report: +531.25
Sleep: 6 hours
Overall health: worked on the newsletter last night and didn't get much sleep.
** VX Algo System Signals from (9:30am to 2pm) **
— 9:30 AM VXAlgo NQ X3 Buy
— 9:42 AM Market Structure flipped bullish on VX Algo X3!
— 10:40 AM VXAlgo ES X1 Sell Signal
— 12:42 PM VXAlgo ES X1 Buy signal
**What’s are some news or takeaway from today? and What major news or event impacted the market today? **
market moved very well this morning after bullish market structure signal, but because it was so violent, it was hard to hold that position for long.
throughout the rest of the day, it moved extremely slow and eventually formed a double top and came all the way down to market opening price lol.
**News**
*FED CHAIR POWELL HIT WITH CRIMINAL REFERRAL BY HOUSE GOP TRUMP ALLY - FOXNEWS
**What are the critical support levels to watch?**
--> Above 6339= Bullish, Under 6320= Bearish
Video Recaps -->https://tradingview.sweetlogin.com/u/WallSt007/#published-charts

How to Trade Doji Candles on TradingViewLearn to identify and trade doji candlestick patterns using TradingView's charting tools in this comprehensive tutorial from Optimus Futures. Doji candles are among the most significant candlestick formations because they signal market indecision and can help you spot potential trend reversal opportunities.
What You'll Learn:
• Understanding doji candlestick patterns and their significance in market analysis
• How to identify valid doji formations
• The psychology behind doji candles: when buyers and sellers fight to a draw
• Using volume analysis to confirm doji pattern validity
• Finding meaningful doji patterns at trend highs and lows for reversal setups
• Timeframe considerations for doji analysis on any chart period
• Step-by-step trading strategy for doji reversal setups
• How to set stop losses and profit targets
• Real example using E-Mini S&P 500 futures on 60-minute charts
This tutorial may help futures traders and technical analysts who want to use candlestick patterns to identify potential trend reversals. The strategies covered could assist you in creating straightforward reversal setups when market indecision appears at key price levels.
Learn more about futures trading with Tradingview: optimusfutures.com
Disclaimer:
There is a substantial risk of loss in futures trading. Past performance is not indicative of future results. Please trade only with risk capital. We are not responsible for any third-party links, comments, or content shared on TradingView. Any opinions, links, or messages posted by users on TradingView do not represent our views or recommendations. Please exercise your own judgment and due diligence when engaging with any external content or user commentary.
This video represents the opinion of Optimus Futures and is intended for educational purposes only. Chart interpretations are presented solely to illustrate objective technical concepts and should not be viewed as predictive of future market behavior. In our opinion, charts are analytical tools—not forecasting instruments. Market conditions are constantly evolving, and all trading decisions should be made independently, with careful consideration of individual risk tolerance and financial objectives.

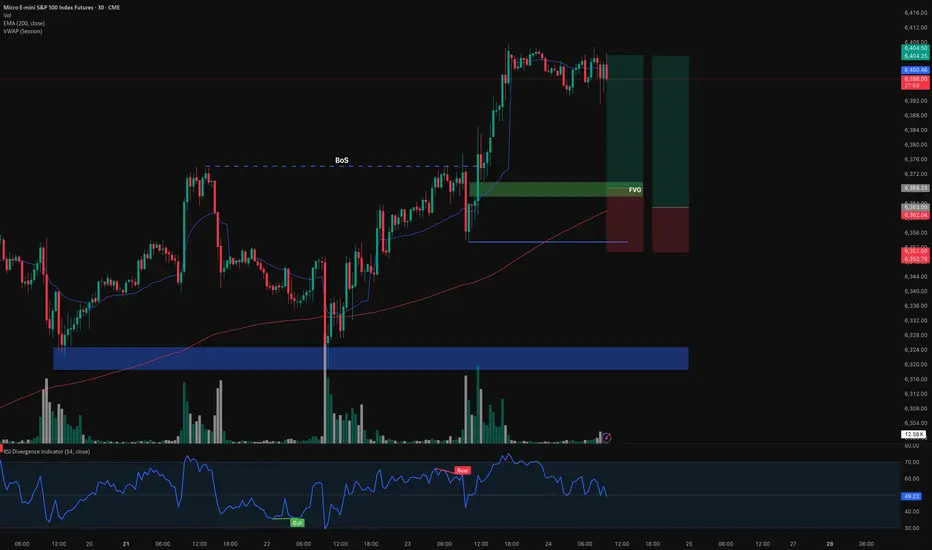
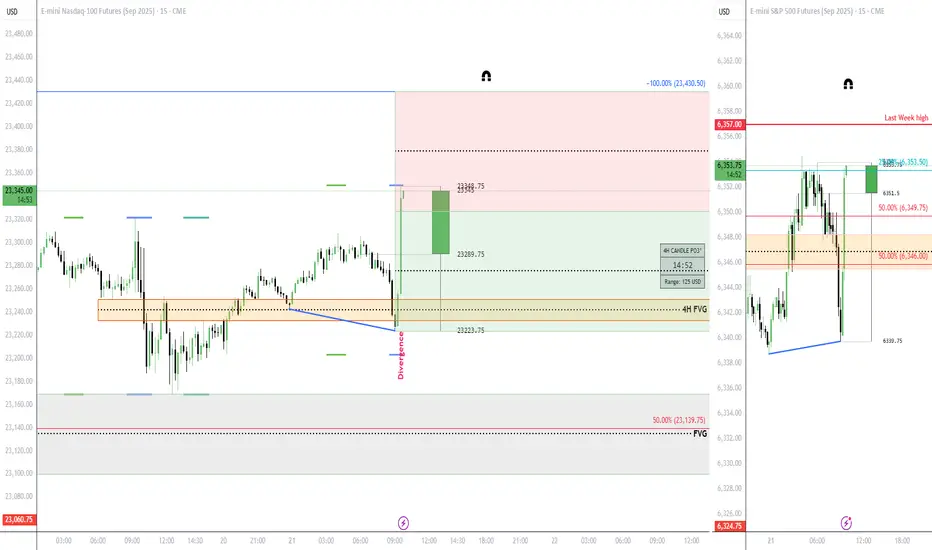
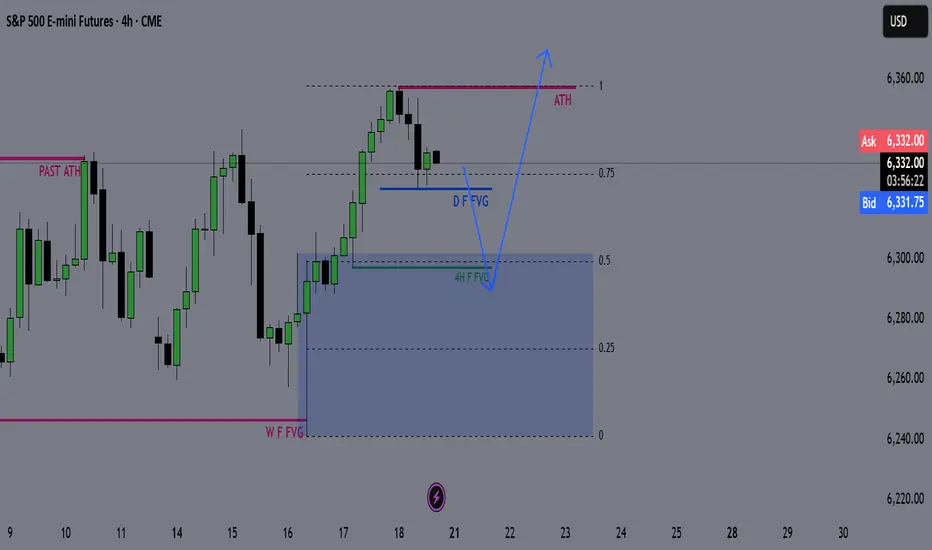
NQ & ESBullish up to this projected range. The green area is discount and is where a trade can be entered, the red zone is premium and is where I will not enter any trade. Do not take this as financial advice.
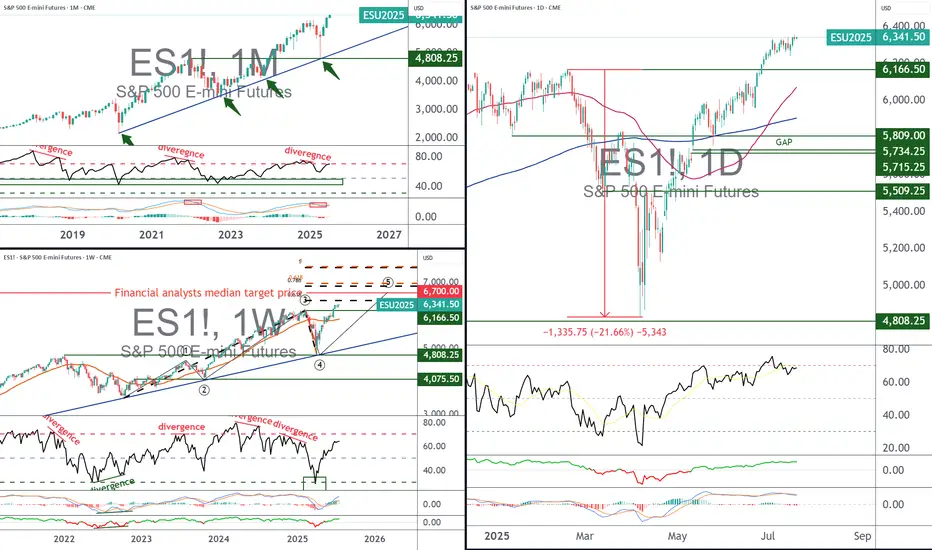
S&P 500, what target for the end of 2025?With the S&P 500 index (the S&P 500 future contract is used as a reference in this analysis) having surpassed its all-time record of 6,165 points at the end of June, and still against a backdrop of trade diplomacy, what technical and fundamental price target can we aim for over the next 12 months? 6,500 points? 6,700 points? 7,000 points? To answer this question, we need to cross-reference the median opinions of financial analysts with the theoretical objectives of technical analysis to assess the remaining potential of the S&P 500.
In terms of fundamentals, the new deadline for trade negotiations between the United States and its trading partners is Friday August 1, and the Fed is unlikely to cut the federal funds rate on Wednesday July 30.
1) Fundamentals and technical analysis: what are the common targets for the end of 2025?
I'd like to start by looking ahead to the next few months and establishing an average target for the S&P 500 between now and the end of the year. Naturally, this is a medium-term projection (several months) and leaves room for short-term correction/retraction phases. Bear in mind that even an underlying uptrend alternates between bullish impulses and short-term correction periods.
According to FactSet, financial analysts' median price target for the S&P 500 over the next 12 months is 6,700 points. As for the theoretical price targets of technical analysis, they are based here on Elliott waves and Fibonacci extensions, giving a range of between 6450 points and 6900 points.
The chart below shows the Japanese candlesticks in weekly data for the S&P 500 future contract with theoretical technical targets based on Fibonacci extensions.
The chart below comes from FactSet and represents the median target of financial analysts for the S&P 500 index with a 12-month horizon
2) Market tops are built on euphoria, and at this stage, sentiment indicators are not in a state of extreme optimism
Is the underlying bullish move under threat from market sentiment that has become over-optimistic? The answer is negative, according to the latest sentiment survey from the American Association of Retail Investors (AAII). The seller's tank is still full, with 39% expecting a bear market. Bear in mind that final market tops are built in euphoria, when the % of sellers falls to the bottom.
The survey below is conducted once a week by the American Retail Investor Association
3) Quantitative analysis does not yet describe an extreme overbought technical situation for S&P 500 stocks
Another approach, the quantitative approach to financial markets, also shows that the market is not yet in a risk zone of hyper-exposure to buying. The percentage of S&P 500 stocks above the 50-day moving average is not yet in the overbought zone.
In conclusion, although there will always be short-term technical corrections, the underlying uptrend of the S&P 500 is not threatened at this stage.
The blue curve below represents the percentage of S&P 500 stocks above the 50-day moving average. This is a quantitative analysis of the financial markets.
DISCLAIMER:
This content is intended for individuals who are familiar with financial markets and instruments and is for information purposes only. The presented idea (including market commentary, market data and observations) is not a work product of any research department of Swissquote or its affiliates. This material is intended to highlight market action and does not constitute investment, legal or tax advice. If you are a retail investor or lack experience in trading complex financial products, it is advisable to seek professional advice from licensed advisor before making any financial decisions.
This content is not intended to manipulate the market or encourage any specific financial behavior.
Swissquote makes no representation or warranty as to the quality, completeness, accuracy, comprehensiveness or non-infringement of such content. The views expressed are those of the consultant and are provided for educational purposes only. Any information provided relating to a product or market should not be construed as recommending an investment strategy or transaction. Past performance is not a guarantee of future results.
Swissquote and its employees and representatives shall in no event be held liable for any damages or losses arising directly or indirectly from decisions made on the basis of this content.
The use of any third-party brands or trademarks is for information only and does not imply endorsement by Swissquote, or that the trademark owner has authorised Swissquote to promote its products or services.
Swissquote is the marketing brand for the activities of Swissquote Bank Ltd (Switzerland) regulated by FINMA, Swissquote Capital Markets Limited regulated by CySEC (Cyprus), Swissquote Bank Europe SA (Luxembourg) regulated by the CSSF, Swissquote Ltd (UK) regulated by the FCA, Swissquote Financial Services (Malta) Ltd regulated by the Malta Financial Services Authority, Swissquote MEA Ltd. (UAE) regulated by the Dubai Financial Services Authority, Swissquote Pte Ltd (Singapore) regulated by the Monetary Authority of Singapore, Swissquote Asia Limited (Hong Kong) licensed by the Hong Kong Securities and Futures Commission (SFC) and Swissquote South Africa (Pty) Ltd supervised by the FSCA.
Products and services of Swissquote are only intended for those permitted to receive them under local law.
All investments carry a degree of risk. The risk of loss in trading or holding financial instruments can be substantial. The value of financial instruments, including but not limited to stocks, bonds, cryptocurrencies, and other assets, can fluctuate both upwards and downwards. There is a significant risk of financial loss when buying, selling, holding, staking, or investing in these instruments. SQBE makes no recommendations regarding any specific investment, transaction, or the use of any particular investment strategy.
CFDs are complex instruments and come with a high risk of losing money rapidly due to leverage. The vast majority of retail client accounts suffer capital losses when trading in CFDs. You should consider whether you understand how CFDs work and whether you can afford to take the high risk of losing your money.
Digital Assets are unregulated in most countries and consumer protection rules may not apply. As highly volatile speculative investments, Digital Assets are not suitable for investors without a high-risk tolerance. Make sure you understand each Digital Asset before you trade.
Cryptocurrencies are not considered legal tender in some jurisdictions and are subject to regulatory uncertainties.
The use of Internet-based systems can involve high risks, including, but not limited to, fraud, cyber-attacks, network and communication failures, as well as identity theft and phishing attacks related to crypto-assets.
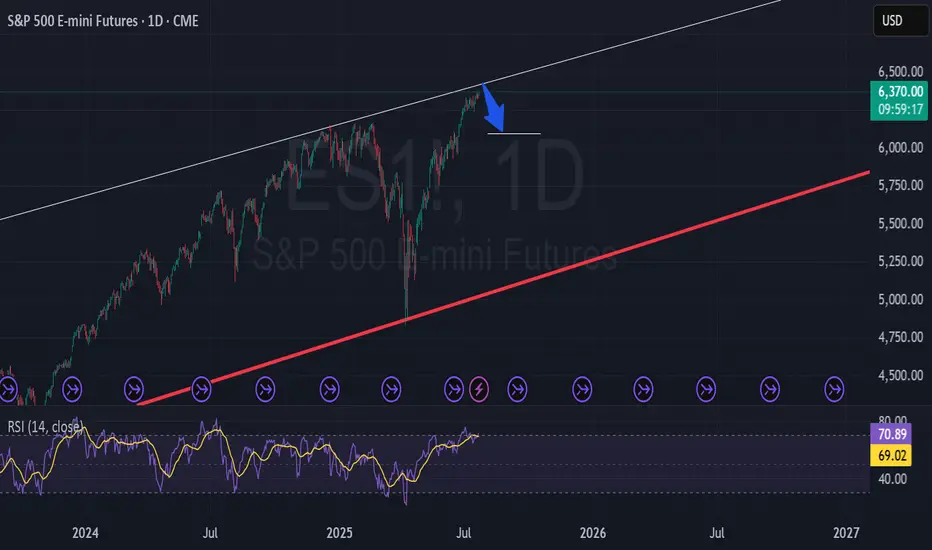
ES Weekly Outlook & Game Plan 20/07/2025ES Weekly Outlook & Game Plan
🧠 Fundamentals & Sentiment
Market Context:
ES continues its bullish momentum, driven by institutional demand and a supportive U.S. policy environment.
📊 Technical Analysis:
Price is currently in price discovery, and the weekly structure remains strongly bullish — so I prefer to follow the strength.
We might see a minor retracement before pushing further above the all-time high (ATH).
🎯 Game Plan:
I'm expecting a potential retracement to the 0.5 Fibonacci level, which is the discount zone in a bullish environment.
Interestingly, the 4H liquidity zone aligns perfectly with the 0.5 Fib level — this confluence suggests price may gather enough energy from there to make new highs.
✅ Follow for weekly recaps & actionable game plans.
NASDAQ: Still Bullish! Look For Valid Buys!Welcome back to the Weekly Forex Forecast for the week of July 21-25th.
In this video, we will analyze the following FX market:
NASDAQ (NQ1!) NAS100
The Stock Indices are strong, and showing no signs of selling off. Buy it until there is a bearish BOS.
Enjoy!
May profits be upon you.
Leave any questions or comments in the comment section.
I appreciate any feedback from my viewers!
Like and/or subscribe if you want more accurate analysis.
Thank you so much!
Disclaimer:
I do not provide personal investment advice and I am not a qualified licensed investment advisor.
All information found here, including any ideas, opinions, views, predictions, forecasts, commentaries, suggestions, expressed or implied herein, are for informational, entertainment or educational purposes only and should not be construed as personal investment advice. While the information provided is believed to be accurate, it may include errors or inaccuracies.
I will not and cannot be held liable for any actions you take as a result of anything you read here.
Conduct your own due diligence, or consult a licensed financial advisor or broker before making any and all investment decisions. Any investments, trades, speculations, or decisions made on the basis of any information found on this channel, expressed or implied herein, are committed at your own risk, financial or otherwise.

S&P 500: Buyers Are Still In Control! Continue To Look For LongsWelcome back to the Weekly Forex Forecast for the week of July 21-25th.
In this video, we will analyze the following FX market:
S&P 500 (ES1!)
The Stock Indices are strong, and showing no signs of selling off. Buy it until there is a bearish BOS.
Enjoy!
May profits be upon you.
Leave any questions or comments in the comment section.
I appreciate any feedback from my viewers!
Like and/or subscribe if you want more accurate analysis.
Thank you so much!
Disclaimer:
I do not provide personal investment advice and I am not a qualified licensed investment advisor.
All information found here, including any ideas, opinions, views, predictions, forecasts, commentaries, suggestions, expressed or implied herein, are for informational, entertainment or educational purposes only and should not be construed as personal investment advice. While the information provided is believed to be accurate, it may include errors or inaccuracies.
I will not and cannot be held liable for any actions you take as a result of anything you read here.
Conduct your own due diligence, or consult a licensed financial advisor or broker before making any and all investment decisions. Any investments, trades, speculations, or decisions made on the basis of any information found on this channel, expressed or implied herein, are committed at your own risk, financial or otherwise.

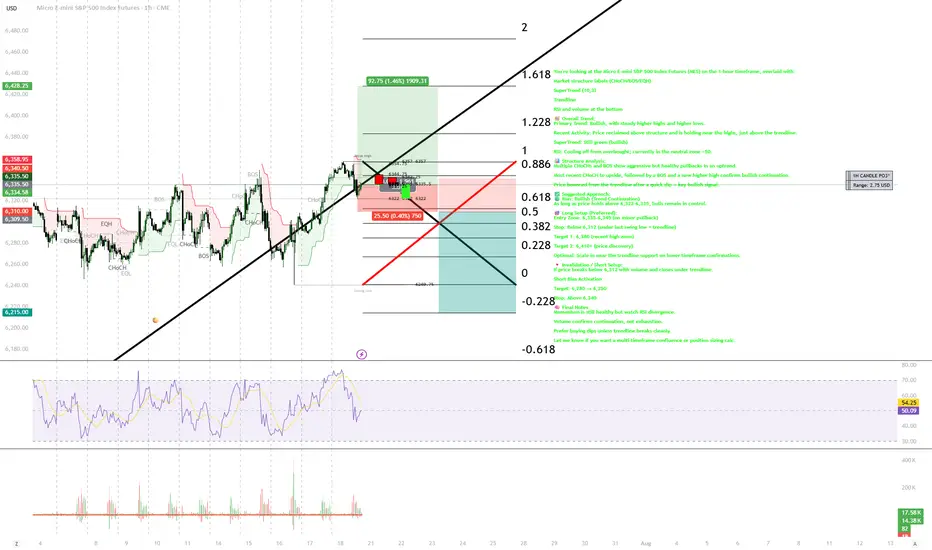
CHAT GPT TRADING You're looking at the Micro E-mini S&P 500 Index Futures (MES) on the 1-hour timeframe, overlaid with:
Market structure labels (CHoCH/BOS/EQH)
SuperTrend (10,3)
Trendline
RSI and volume at the bottom
🧭 Overall Trend:
Primary Trend: Bullish, with steady higher highs and higher lows.
Recent Activity: Price reclaimed above structure and is holding near the highs, just above the trendline.
SuperTrend: Still green (bullish)
RSI: Cooling off from overbought; currently in the neutral zone ~50.
📊 Structure Analysis:
Multiple CHoCHs and BOS show aggressive but healthy pullbacks in an uptrend.
Most recent CHoCH to upside, followed by a BOS and a new higher high confirms bullish continuation.
Price bounced from the trendline after a quick dip — key bullish signal.
✅ Suggested Approach:
🟢 Bias: Bullish (Trend Continuation)
As long as price holds above 6,322–6,335, bulls remain in control.
🎯 Long Setup (Preferred):
Entry Zone: 6,335–6,345 (on minor pullback)
Stop: Below 6,312 (under last swing low + trendline)
Target 1: 6,380 (recent high zone)
Target 2: 6,410+ (price discovery)
Optional: Scale in near the trendline support on lower timeframe confirmations.
🔻 Invalidation / Short Setup:
If price breaks below 6,312 with volume and closes under trendline:
Short Bias Activation
Target: 6,280 → 6,250
Stop: Above 6,340
🧠 Final Notes:
Momentum is still healthy but watch RSI divergence.
Volume confirms continuation, not exhaustion.
Prefer buying dips unless trendline breaks cleanly.
Let me know if you want a multi-timeframe confluence or position sizing calc.
ID: 2025 - 0084.16.2025
Trade #8 of 2025 executed. So simple, yet far from easy...
Trade entry at 93 DTE (days to expiration).
The last few weeks have been quite challenging, mostly due to increase volatility (3rd highest expansion in history), as well as widening bid/ask spreads. This trade idea will dovetail with trade id: 006 to balance delta without incurring more slippage due to spreads. This trade will hold to expiration without any adjustments until the final 30 days of trade life.
Happy Trading!
-kevin

Inside day on MondayThe structure in the daily S&P 500 chart implies an inside day for Monday. It indicates a loss of momentum and is potentially bearish.
