What Lies Beneath Rigetti’s Quantum Ambitions?Rigetti Computing, Inc. stands at the forefront of quantum innovation, chasing a future where computational power reshapes industries. Yet, allegations of securities fraud have cast a formidable shadow over its aspirations. The Rosen Law Firm’s investigation, sparked by claims that Rigetti may have misled investors with overstated progress or understated risks, intensified after a 45% stock drop on January 8, 2025—triggered by Nvidia CEO Jensen Huang’s assertion that practical quantum computers remain 20 years distant. This collision of legal scrutiny and market shock prompts a tantalizing question: can a company’s bold vision endure when its foundation is questioned?
The securities fraud allegations strike at the heart of Rigetti’s credibility. As the company advances its cloud-based quantum platform and scalable processors, the probe—echoed by The Schall Law Firm—examines whether its disclosures painted an overly rosy picture, potentially luring investors into a speculative abyss. Huang’s sobering timeline only amplifies the stakes, exposing the fragility of trust in a field where breakthroughs are elusive. What does it mean for a pioneer to navigate such treacherous waters, where technical promise meets the demand for transparency? This riddle challenges us to dissect the interplay of innovation and integrity.
For Rigetti’s investors, the unfolding drama is both a cautionary tale and a call to action. With millions of shares and warrants poised for market entry amid a $0.515 stock price, the allegations fuel uncertainty and ignite curiosity about resilience in crisis. Could this investigation, if resolved favorably, strengthen Rigetti’s resolve and refine its path? Or will it unravel a quantum dream deferred? As the company balances cutting-edge pursuit with legal reckoning, the enigma deepens, urging readers to ponder the price of progress and the courage required to sustain it against all odds.
RGTI34 trade ideas

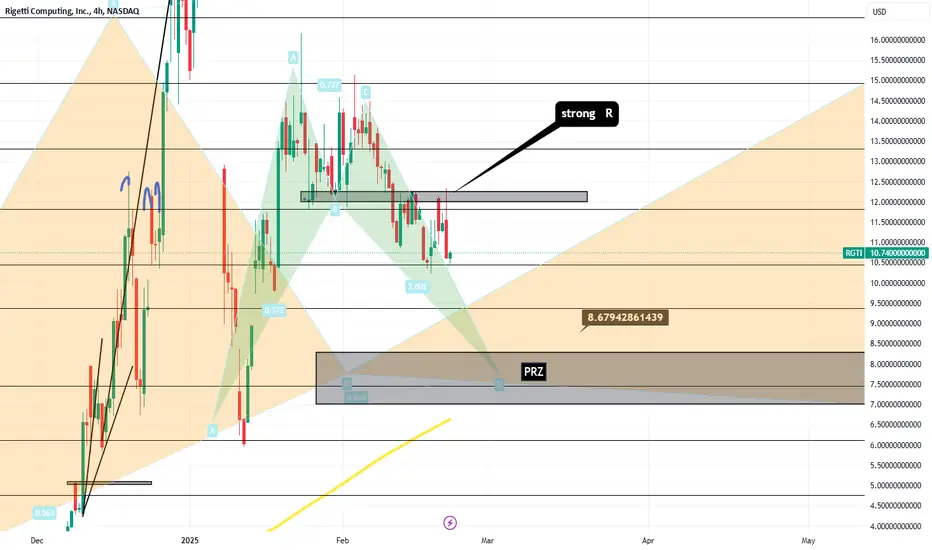
RGTI 4h time frame LONG SHORT scenario
RGTI 4h time frame scenario
1. $12 strong R
2. expect to fall near $8 PRZ
Rigetti Computing to breakout soonRigetti Computing Inc NASDAQ:RGTI – Breakout Trade Setup 💪🔥🚀
Entry: Above $12.50 for confirmation
Stop Loss: $10.50 to manage risk
Target: $31.63 based on measured move projection
Risk-Reward Ratio: High potential reward compared to risk
Why This Trade? 📚💡
The stock has been consolidating under a descending trendline and is attempting a breakout. High volume suggests strong buying interest. The measured move target shows significant upside potential.
Risk Management ☔
Use a tight stop below $10.50 in case of a false breakout. Consider scaling out profits near $20 to lock in gains before reaching the full target. Monitor price action for confirmation.
Final Thoughts ✅
RGTI presents a strong breakout opportunity with high growth potential. Watch for sustained momentum before entering the trade.

Tracking the Bubble PhasesThe amount of hyper speculation in quantum stocks is still mind boggling. I see this tracking a classic bubble pattern where we may start to flip from the "return to normal" phase to a "fear" sell off as we get closer to earnings (early March). Short this back to under $6 from the bull trap.

$NASDAQ:RGTI Pennant Pattern with 72% upsideNASDAQ:RGTI I'm revising an earlier post to clarify that this is actually a Pennant pattern that has formed for RGTI.
Entry Point:
Conservative - wait until the stock closes above $13.98, which should indicate a breakout.
Riskier - Anything above $12.03
Price Target:
The upside is 72% - $24.00

RGTI - expect a pull back before it takes off againI think this is possible that this stock can take off having hit its first floor

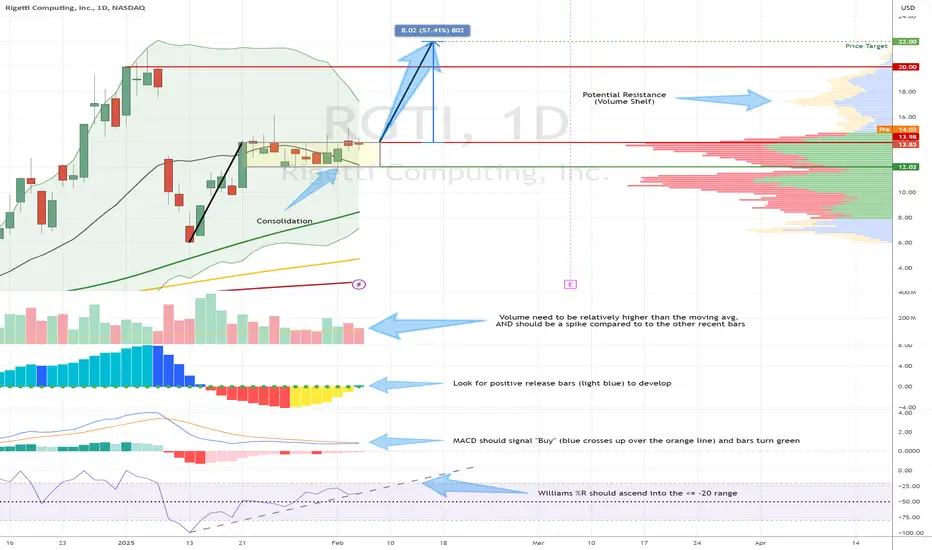
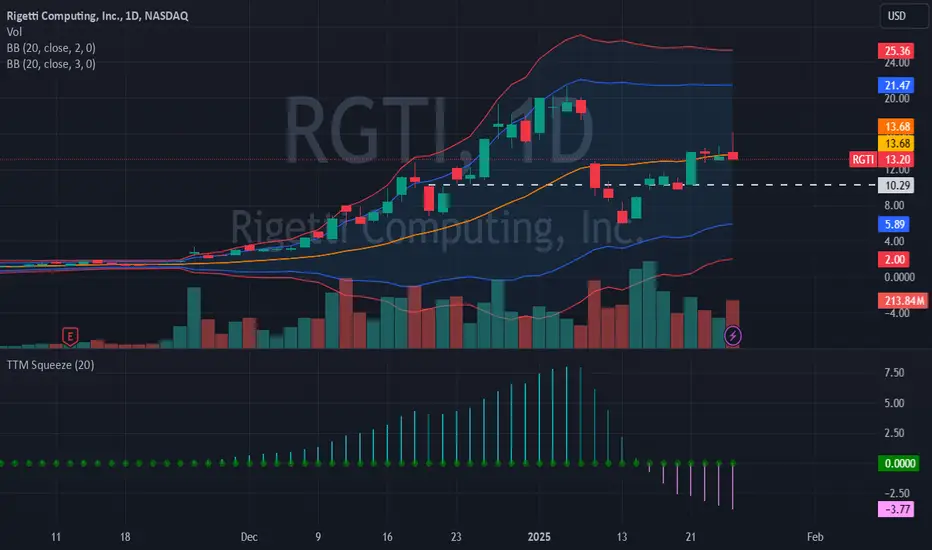
$NASDAQ:RGTI 57% Upside: Consolidation Breakout WatchNASDAQ:RGTI has been in a consolidation pattern for the past ~11 trading days. Creating a nice volume shelf of support. It continues to bump up to the line of resistance, but hasn't broken through.
Here's the trade:
Conditions:
The stock price closes above the line of resistance ($13.98)
Volume is relatively higher than recent bars (a spike)
Squeeze is firing indicating a positive release (light blue bars)
MACD has signaled a buy
Williams %R continues to ascend, preferably into the upper 20%
Entry: Anything above the 13.98 close.
Price Target:
$22.00 - 57% above the resistance line.
Note: There may be some resistance and pullback when trying to cross $17 and $20
Caution!
Quantum computing stocks have been volatile, so pay attention!
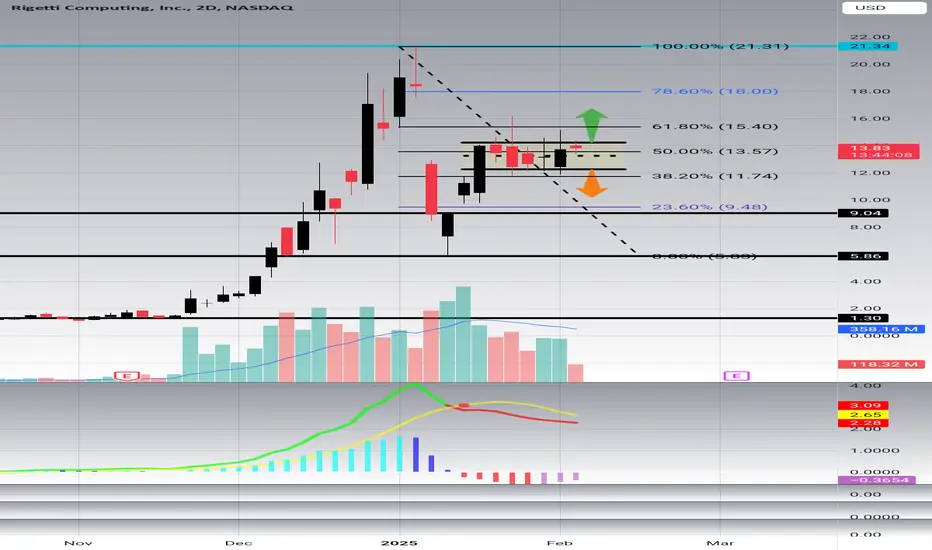
LoadingGood day Team:
I hope all is well.
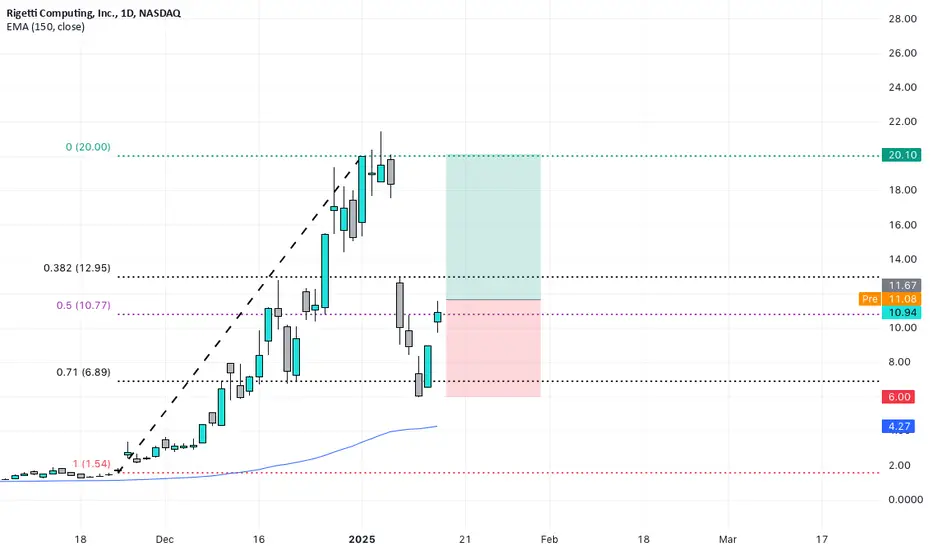
Here RGTI on the 2D is consolidating after a correction in the golden zone of a fibonacci level.
What is needed per theory is a healthy upward breakout of the channel with a bullish MACD cross over, but a breakout downward will hypothetically lead to more bearish activity.
Please observe key levels on chart
Have a safe day
RGTI: both ways potential Chart on the daily looks like being in no-mans is about to decide of its further direction.
I have two main alternatives:
1. If price moves above Jan 24th highs the road is opened to following resistance zone: 20-25, 28-33 and a push towards ideal macro-resistance target at 37-45 levels;
2. If price break down bellow Feb 3rd lows, odds are moving in favour of one potential leg down to potentially test 4-3 macro support levels.
Weekly macro view:
Thank you for your attention!

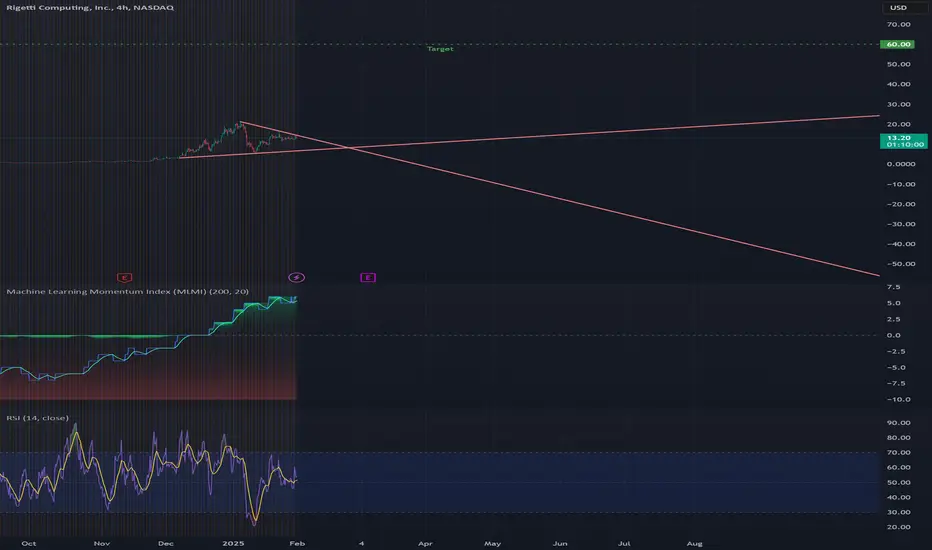
RGTI BullishMLMI: This indicator is trending upwards, suggesting increasing momentum. If it continues to rise, it reinforces bullish strength.
RSI: Currently around 53-54, which is neutral but leaning bullish. If it moves above 60, it would confirm stronger momentum.
-----------------------------------------------
Rigetti Computing (RGTI) is a leading quantum computing company focused on developing superconducting quantum processors and hybrid quantum-classical computing solutions. Founded in 2013, Rigetti aims to commercialize quantum computing for applications in AI, optimization, and scientific research. The company competes with major players like IBM and Google in the race for quantum supremacy.
10 looks like an area where it can go againSince the high move and the downfall, the central line could mean the stock is still repositioning itself and has yet to find the outcome of the direction in which it is confident. The stochastic RSI is centrally located, and the MACD, even though a bearish run has crossed over, short-term EMA and other oscillators and indicators seem bullish. Still, it's 50-50 in sentiment. 2 gaps need to be filled at mid-10, where we will be comfortable reevaluating.
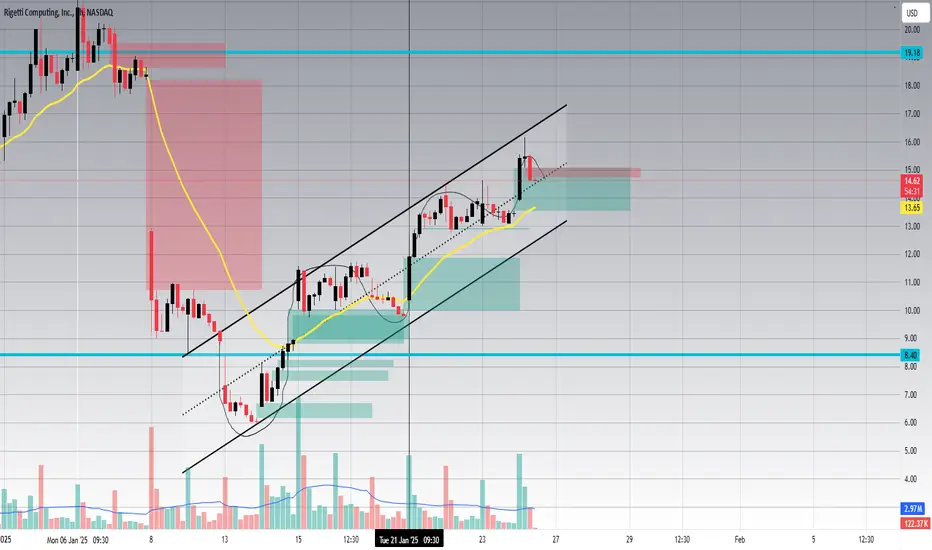
Cycling Down on Hourly?Please be cautious of upward parallel channel, price at this time may cycle back down to the bottom of the upward parallel channel, be mindful of 21 EMA in yellow on the chart. If you do not mind, please observe the charts for key levels. Price should be bullish above 21 EMA and inside the Parallel channel.
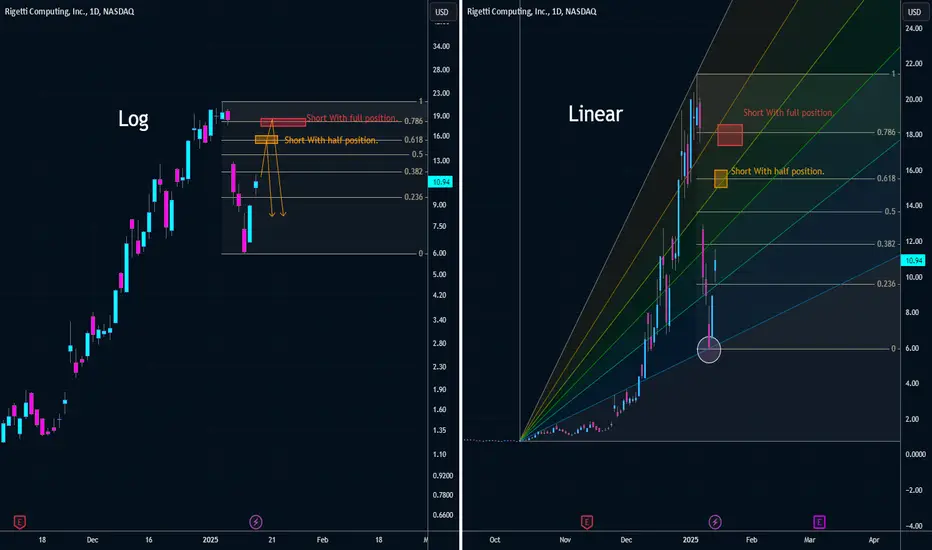
Bottom or Dead Cat?I believe this rebound in RGTI will ultimately be a bull trap, but this could be a very strong rebound given how fast we plunged from $20 to $6. I'm on lookout to renter short if we start to make it to ~15.50 (61.8% Retracement). My chart shows the viewpoint from Log and Linear since we are dealing with such large % changes both viewpoints are helpful. Reminder that earnings is not until probably late March. It's possible my target isn't reached and we go down from here...
$15.50 -> Half position short
$18.00 -> Full position short
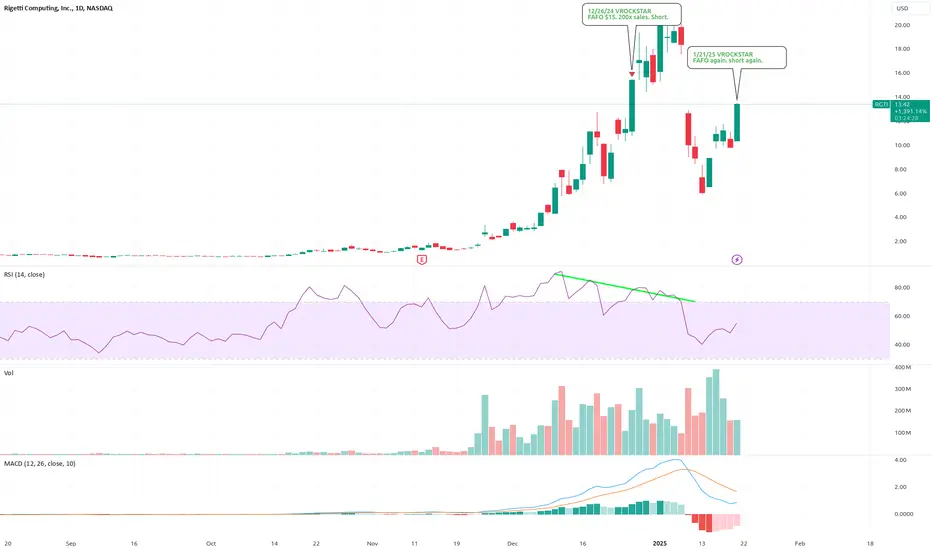
1/21/25 - $rgti - FAFO again. short again.1/21/25 :: VROCKSTAR :: NASDAQ:RGTI
FAFO again. short again.
- meme
- just know that's what you're buying. a listed meme.
- go read my previous comment if u want more substance.
- pt here, is stock has already peaked (at $20), so it's an exercise of risk mgmt to hedge my semis book (u know i like NYSE:TSM , $nvda...)
- "V will it go down tmr?" - no clue anon, but if mkt rips tmr, and this does too... i more than make up with my long book. if mkt fades, i cash again on this short. it's a hedge, my friends. best one i can find.
- so for the second time, don't say i didn't warn u. careful with this one. it's not a viable company. it's a meme. play game accordingly.
V
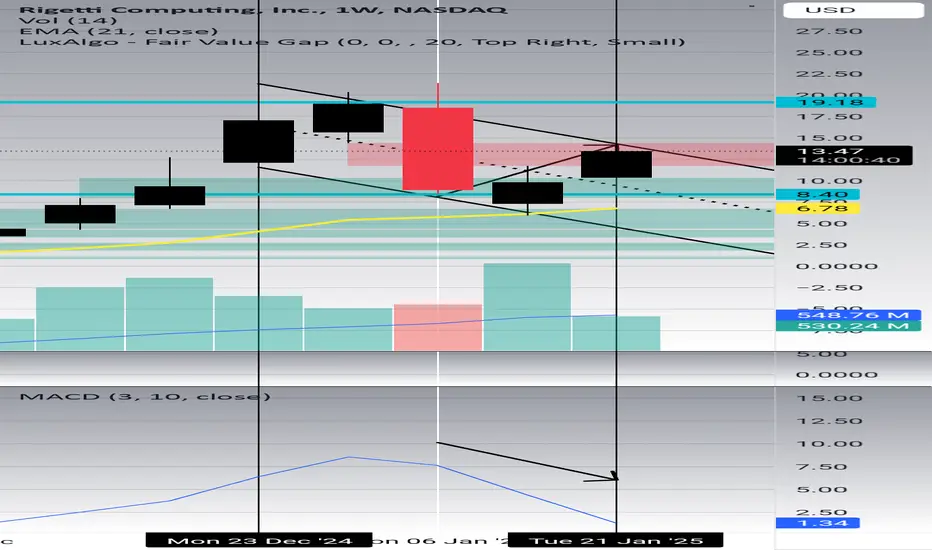
Downward Parallel Channel on WeeklyGood day
Caution on RGTI it needs to close out upward of the downward parallel channel. If we do not get a positive price breakout then price is hypothetically going to be bearish. Please observe the key levels and channel on the chart. Also, there is possible bearish MACD divergence.
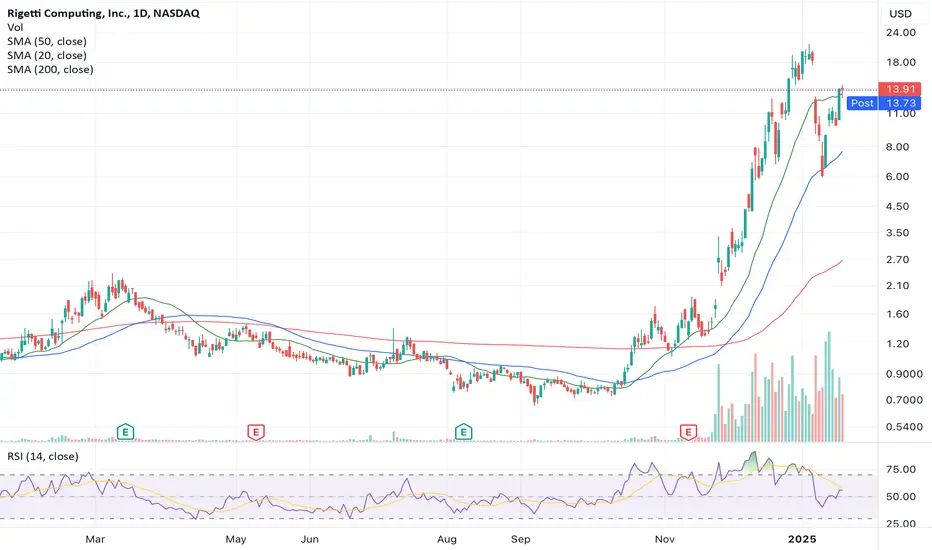
RGTI - tried to short itI think it's exhausted its uptrend. Selling short on rebound with Feb bear put spreads.
Rigetti Computing Inc. (RGTI) Long SetupRigetti Computing Inc. (RGTI) price appears to be completing ABC correction in the 15min chart, possibly completed wave (2) of an impulse wave structure and is set for a potential bullish continuation into wave (3).
Setup:
RGTI is completing wave (2) correction and is poised to enter wave (3), targeting higher levels.
Strategy:
Enter at current levels or wait for confirmation of bullish momentum breaking above $11.79.
Trade Plan:
Entry: $10.46, or confirmation entry $11.79
Stop Loss: $9.70
Take Profit: $18.26
Position Size: Adjust to limit risk to 1-2% of account equity.
Risk-Reward Ratio:
Entry at $10.26 with a stop at $9.70 and target at $18.26 offers an RRR of approximately 1:10.
Confirmation Entry RRR is ~1:3
Confirmation:
Monitor for bullish candlestick patterns or a breakout above the $11.70 level to confirm the start of wave (3).
Disclaimer:
This analysis is for educational purposes only. Trading financial markets involves risk, and you should not trade with money you cannot afford to lose. Past performance is not indicative of future results. Consult a licensed financial advisor before making any trading decisions.
Trade Advice:
Stick to your risk management rules and avoid overleveraging.
If the price breaks below $9.70, then the trade is not valid for confirmation entry.
Use alerts to monitor key levels ($11.7 for confirmation and $9.70 for the stop loss).

Ascending Triangle and Key LevelPeace and Blessings
RGTI is consolidating under a key level, and consolidating in an ascending triangle. There is a possibility of a bullish breakout with the 50 EMA crossing over the 200 EMA. For this hypothetical event to happen we need a positive price break out and price making a higher highs and lower lows above the key level. Watch out for a bearish breakout and fakeouts and possible more consolidation .
$RGTI LONG TO TWENTYA speculative theme for this year seems to be quantum computing since GOOG announced its breakthrough chip a few weeks ago. RGTI had a mammoth run, and with my Fibonacci framework I use to determine premium and discount zones, I figured this was a decent bet for a move back to the swing high of about $20 in the next few weeks. I love the fact that it has high short interest as well. Fuel. My stop loss would be at $5.90, slightly underneath what I am hoping the most recent swing low would be. I plan on holding this a few years but for a swing trade the odds are it goes back to $20 given the hype about quantum and overall market conditions.
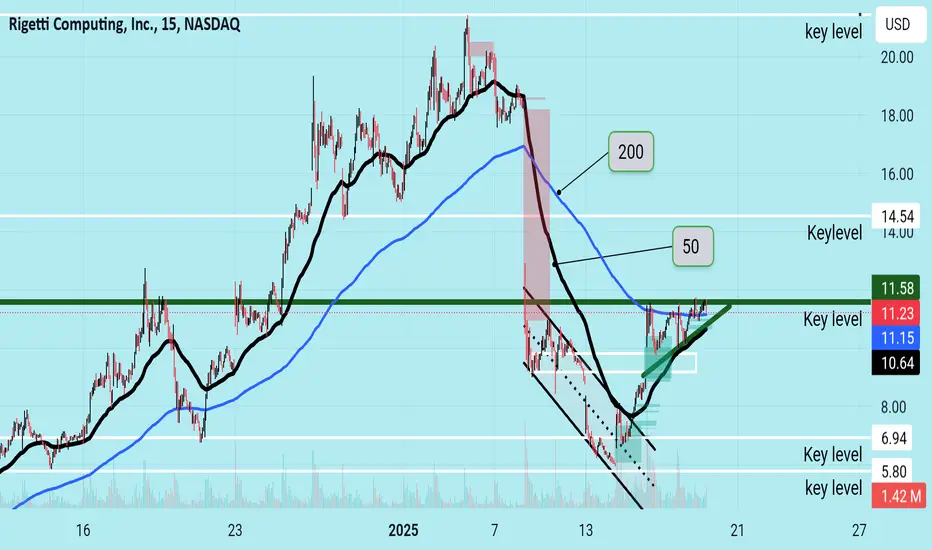
15 min *possible* break outIf RGTI breaks out of the parallel structure and also the 50 EMA there may be possible price action towards the 200 EMA. Please observe chart for key levels and FVG blocks and the parallel structure.

RGTI buy & sell zoneAll eyes on RGTI with price alerts set
Bounce at $5-$6 range
Sell at $9-$10
40% upside from low

Bullish Long-Term PerspectiveHello traders,
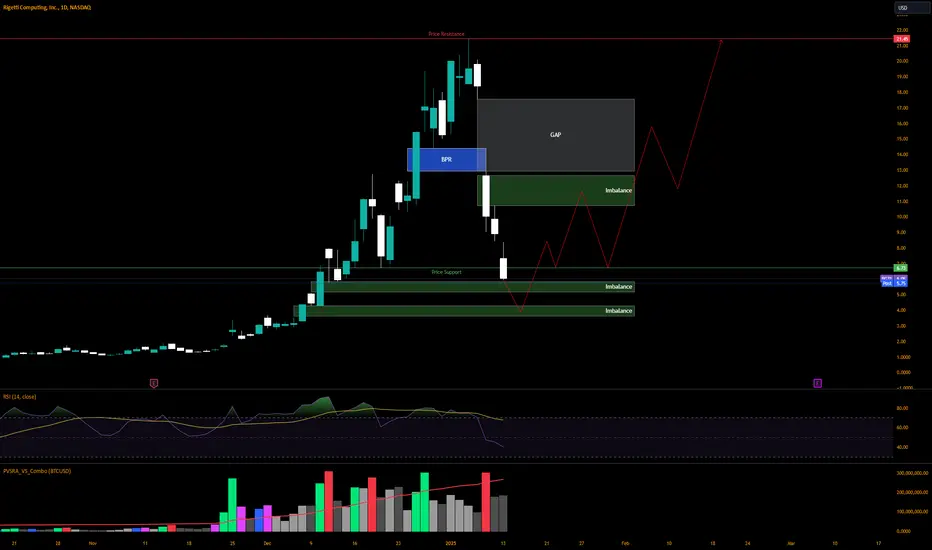
Here’s my analysis on Rigetti Computing (RGTI). The current price action indicates a potential for a bullish reversal, with key technical levels and imbalances offering opportunities for long-term growth.
Key Observations:
Support Zone: Price is approaching a strong support area around $5.00-$5.50, with significant demand historically observed in this zone.
Imbalances:
Lower Imbalance Zones: These zones around $4.50-$5.00 could act as magnets for price stabilization before a reversal.
Upper Imbalance Zones: Imbalances near $12 and $16 provide potential upside targets for long-term bullish movements.
Gap and BPR: A gap near $14 aligns with the Break of Price Range (BPR), signaling a key area to watch for future price action.
Price Resistance: The $21-$22 level serves as the ultimate resistance and a potential long-term target.
Strategy:
Buy Entry:
Near the $5.00-$5.50 support zone or upon confirmation of demand in lower imbalance zones.
Targets:
First Target: $12 (upper imbalance).
Second Target: $16 (gap fill and imbalance).
Final Target: $21-$22 (major resistance).
Stop Loss: Below $4.50 to manage risk effectively.
Supporting Indicators:
RSI: Approaching oversold conditions, suggesting a potential reversal soon.
Volume: Noticeable spikes in volume around the current levels indicate increased market interest.
Long-Term Outlook:
Rigetti Computing is showing signs of building a strong foundation for a bullish trend. The imbalances, coupled with historical demand zones, offer significant upside potential for long-term investors. Patience will be key to capitalize on this opportunity.
What are your thoughts on this setup? Share your feedback and alternative perspectives below!
Trade safe and stay disciplined! 🚀
#RGTI #TechnicalAnalysis #BullishOutlook #AIStocks #QuantumComputing #TradingPlan #SupportResistance #LongTermInvesting
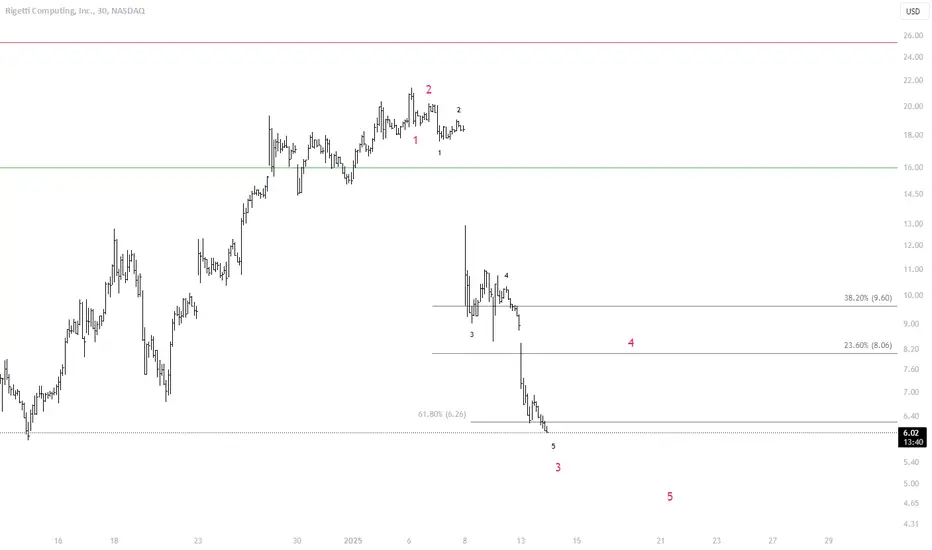
RGTI Speculative Rebound Expected Before Final Wave DownTechnical Analysis of RGTI (30-Minute Timeframe)
The stock is currently moving within a clear impulsive wave structure on the 30-minute timeframe. Based on my observations, it appears to be at the end of wave 3. I anticipate a speculative rebound in the short term, with a target around $8. However, a decline in wave 5 may follow to complete the overall impulsive movement.
⚠️ This analysis is merely a forecast based on technical observations. It does not constitute investment advice or a recommendation to buy or sell this stock.