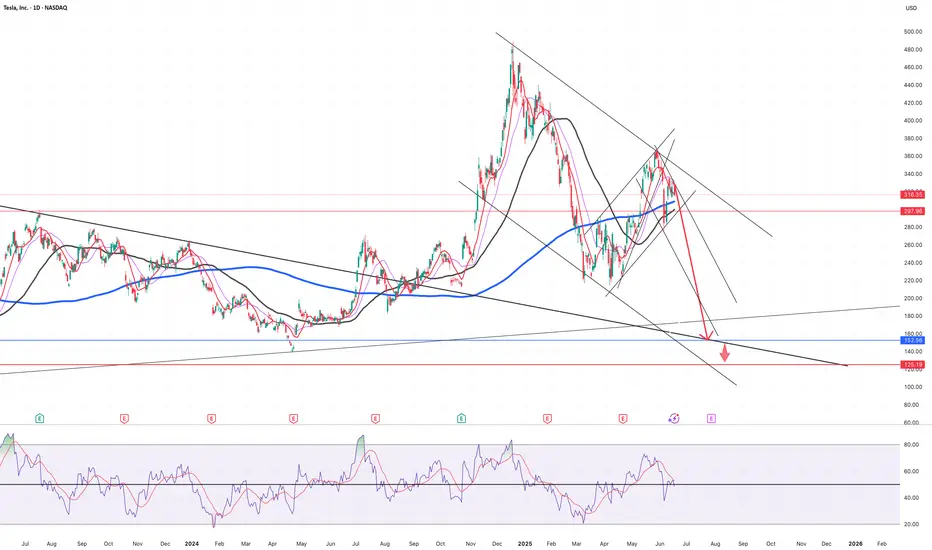
TSLA It’s still downtrendIf break support 297 below then It’s going down till 153 , (extention is 125)
The stock market is highly volatile. Please be very careful with your investments.
TSLA34 trade ideas
TSLA - idk im probably wrong.. should we buy itThese hacks, TRUMP and ELON... they're in KAHOOTS I tell ya...
Who lets the Prez babysit their son, only to have a public controversy.
On some actual thesis... TSLA is the first to get any type of sell of since april!
LET IT LEAD THE WAY
TSLA trade of the weekThis idea is something new where I'm asking my HIGHLY EXPERIMENTAL dowsing work for a "best bang for your buck" trade at the beginning of the week. Last week was pretty good saying to short SPY on Wed., so I'm going to journal these and see if it can be consistent.
If this aligns with YOUR work, great.
The idea is TSLA has a spike up towards the upper gap around $326-28. My levels on TSLA often are overshot, but anyway. Then watch for it to head towards the lower gap in the $310-307 zone and possibly down to $302.
My work is INCONSISTENT. There's more going into this than just looking at an indicator. This is energy, intention, intuition and God knows what else and it's more for myself than you. But, if you're interested, I'm happy to answer questions and share as I hope it inspires your own sense of what is possible beyond just the physical world.

TSLA: Anyone knows this powerful pattern?TSLA:
Anyone knows this powerful pattern?
The crowd gets lost in colorful indicators, forgetting that the market speaks clearly through just price and volume.
.
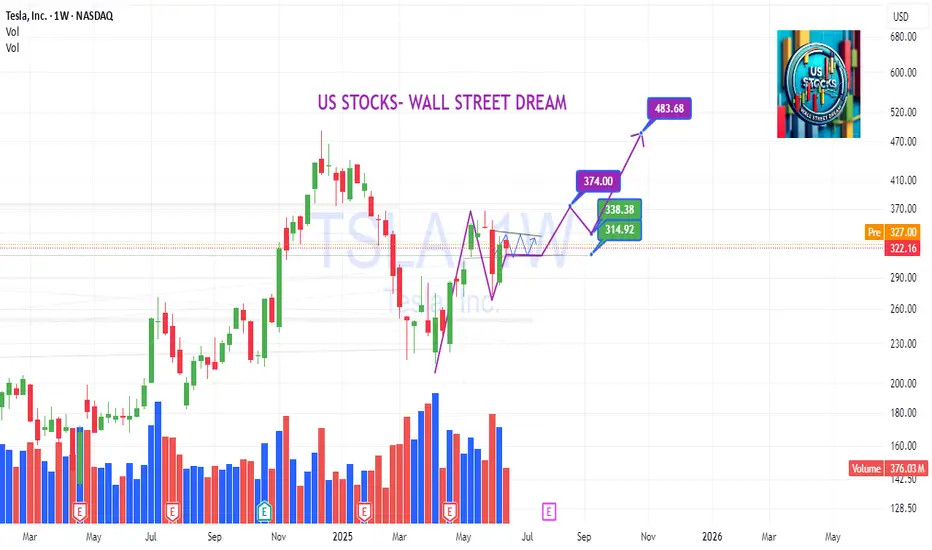
US STOCKS- WALL STREET DREAM- LET'S THE MARKET SPEAK!
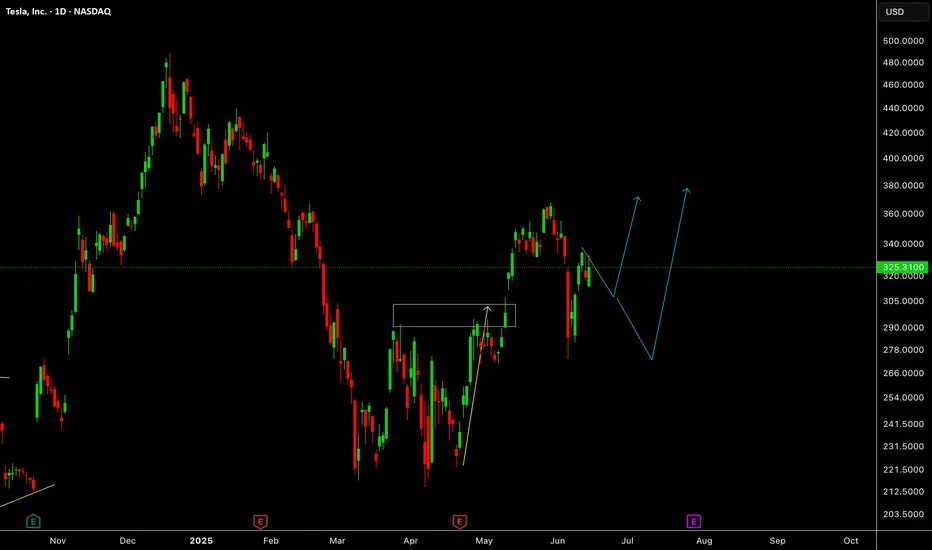
TSLA JUNE 20 2025 READ NOTESThis is momentum based price targeting & Tesla can easily do $390 but before that 342 is a solid resistance. From there we can get a dip and then price can continue the up move further
ANY NEWS IS TO BE AVOIDED
Now price action which is way superior is clearly suggesting the same up move.
I fact RSI is saying $400++ can come but it would be super dafe to exit around $390
If you nave any doubts then you can leave a comment.
$TSLA | Robotaxi Launch Incoming? - Plan Rock Solid w/ 3 TradesNASDAQ:TSLA
Launch could be as soon as Sunday, June 22. However, Musk has emphasized safety as priority. There is the potential to undercut traditional taxi services at less than $0.20 per mile. Tesla’s government and military contracts are key growth drivers but further clash between Musk and President Trump could cause further volatility in price action. Long-term $271 is a critical price point. There are several ways to play Tesla:
* Range between $270 and $350
* $330 to $400 into price discovery
* Breakdown under $270 targeting $212 and $204
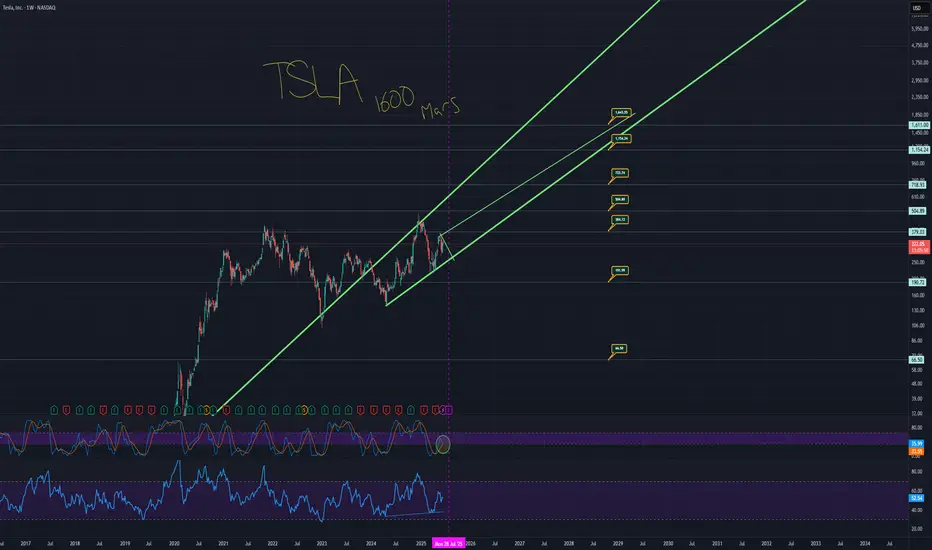
TSLA TO 1600, YOU SAW IT HERE FIRSTHere's the TA that takes Tesla legitimately to 1600.
The monthly chart has a trend that is currently acting as support.
The price has fallen under that trend.
Price action is also over a massive support trend from the weekly chart.
These are the two thickest green trends.
When you zoom back and look at TSLA as a whole, you see the bigger picture.
You have a situation where the low side takes you to around $60 to 70 dollars with a low of around $48. And then you have the high side taking you to around 1600. It sounds like a candidate for a stock reverse split.
Essentially, don't miss out on this potential solar data fast car thingy ready to really zoom.
Here is the chart with the auto fib numbers showing potential targets.
Remember, this likely doesn't occur all in one night, but the projection is really looking like it takes off from earnings. Projection line in yellow.
You have an opportunity where short term trends go to a strong long term trend which climbs to a support trend meaning price can literally take off from multiple of these trends meaning, we can price action go from 420 down to 250 and back up to 1600 in less than a year total.
TSLA shortPart of a larger analysis, at the moment Tsla rejected 332 B pivot and imo retesting possible b.o. area. missed gap up open, retest of highs sent 305p strike. looking to close at 310-305 tgt zone. n.f.a. g.l.h.f

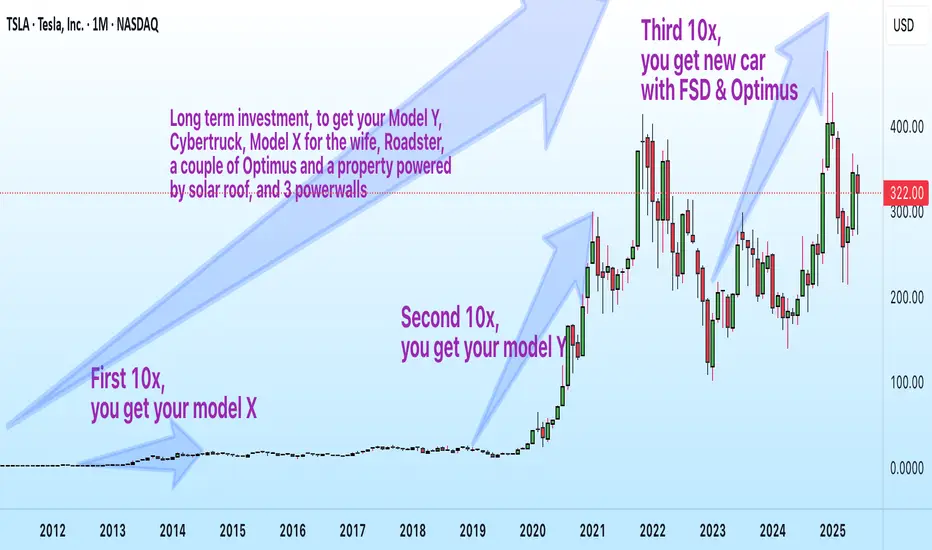
$TSLA Long-Term View: From $2 to $300+—How Far Can Vision Go?
📈 13-Year Monthly Chart of NASDAQ:TSLA
A $20,000 investment in Tesla back in 2012 wasn’t just a bet on a stock—it was a ticket to the future.
By 2014, those gains could’ve paid for a Model S.
By 2019, the same investment might’ve covered a Model Y and Model 3—one for you, one for your spouse.
Now, with Tesla pushing the limits of AI and robotics, could that investment soon deliver a full FSD suite and even a pair of Optimus robots serving in your home?
This chart tracks NASDAQ:TSLA ’s incredible rise—from just $2.19 in 2012 to $319.50 in June 2025.
Sometimes, holding is innovation.
TESLA LONG IDEAThe overall trend of TSLA is bullish. However, it has been retracing for a while. Currently, there's a confirmation showing that the stock is ready for a rally, targeting the previous high.
Using Structural Range Concept (SRC), a subset of Smart Money Concept (SMC), price has shown an intention to resume bullish trend. There was a mitigation of a demand zone in the discount level which led to an internal bullish break of structure, confirming the intention to go up.
A retracement into the demand zone is necessary to maximize return while minimizing risk. Entry is around $258.25 while the exit is around $210.72 and the final target is around $488.10. The risk reward ratio (RRR) is about 4.9 (that is, 4.9x of the risk).
Confluences for the long idea:
1. The trend is bullish
2. Price is in discount level
3. Price has given internal break of structure with inducement after mitigating a valid demand zone.
4. Price is also respecting bullish trend line.
Disclaimer: This is not a financial advice. Don't take the signal if you don't accept the risk. The outcome maybe different from the projection.

SPY & MegaCap strengthSPY saw a very strong gap up, negating most of the selling from last week.
despite rising tensions in the middle east - investors have shrugged off volatility and bought the initial dip.
This may be proving that "war" is good for stocks.
we observed a very close correlation between the indices and oil today.
As oil reversed higher - markets saw a bit of weakness. As oil fell markets rallied.
TSLA trying to break a 4 hour bullish pattern
META new Smart Glasses release causing a surge.
MSFT new all time high tap
NVDA firm with ripping semiconductors
GOOGL looking strong for continuation
AMZN moving nicely off support
AAPL lagging the mega's but positive

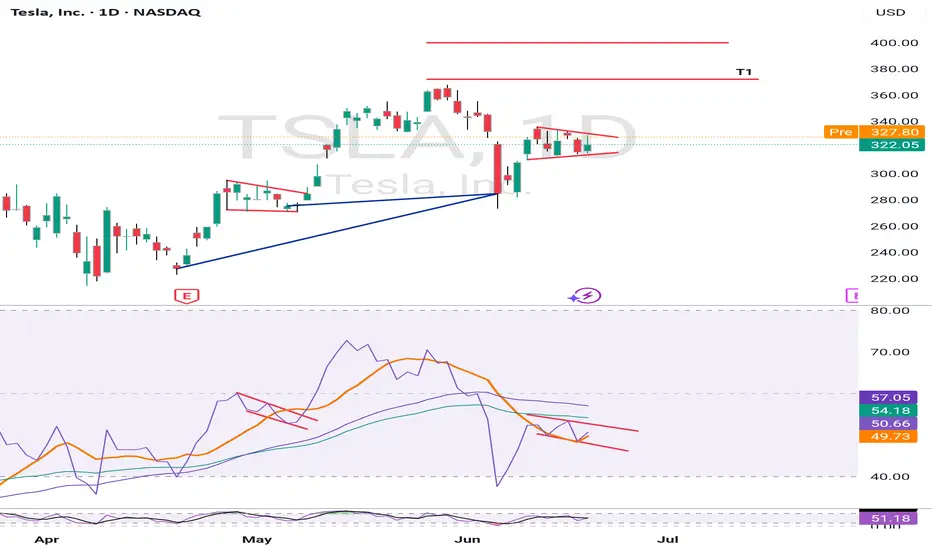
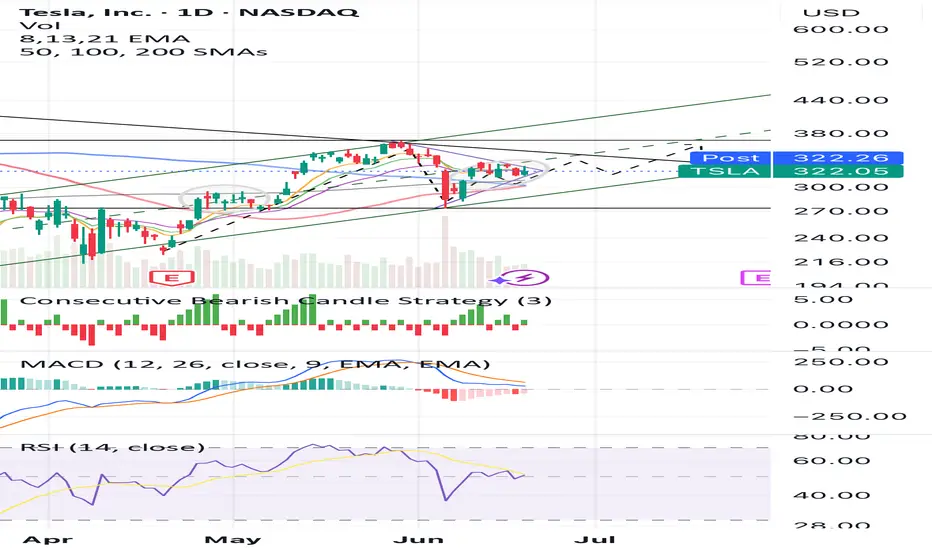
On the edge of bullish breakdownCurrent price is in a falling wedge and consolidating in 310-330 above 100 SMA within a long-term uptrend channel. Two grey circles mark previous & current consolidation zones - a clear attempt to highlight a repeating pattern that may lead to a breakout, just like in late April. MACD/RSI show signs of bullish momentum recovery. PT: 350. NFA!
What Is T-Distribution in Trading? What Is T-Distribution in Trading?
In the financial markets, understanding T-distribution in probability is a valuable skill. This statistical concept, crucial for small sample sizes, offers insights into market trends and risks. By grasping T-distribution, traders gain a powerful tool for evaluating strategies, risks, and portfolios. Let's delve into what T-distribution is and how it's effectively used in the realm of trading.
Understanding T-Distribution
The T-distribution in probability distribution plays a crucial role in trading, especially in situations where sample sizes are small. William Sealy Gosset first introduced it under the pseudonym "Student". This distribution resembles the normal distribution with its bell-shaped curve but has thicker tails, meaning it predicts more outcomes in the extreme ends than a normal distribution would.
A key element of T-distribution is the concept of 'degrees of freedom', which essentially refers to the number of values in a calculation that are free to vary. It's usually the sample size minus one.
The degrees of freedom affect the shape of the T-distribution; with fewer degrees of freedom, the distribution has heavier tails. As the degrees of freedom increase, the distribution starts to resemble the normal distribution more closely. This is particularly significant in trading when dealing with small data sets, where the T-distribution provides a more accurate estimation of probability and risk than the normal distribution.
T-Distribution vs Normal Distribution
T-distribution and normal distribution are foundational in statistical analysis, yet they serve different purposes. While both exhibit a bell-shaped curve, the T-distribution has thicker tails, implying a higher probability of extreme values. This makes it more suitable for small sample sizes or when the standard deviation is unknown.
In contrast, the normal distribution, with its thinner tails, is ideal for larger sample sets where the standard deviation is known. Traders often use T-distribution for more accurate analysis in small-scale or uncertain data scenarios, while normal distribution is preferred for larger, more stable datasets, where extreme outcomes are less likely.
Application in Trading
In trading, T-distribution is a valuable tool for analysing financial data. It is primarily used in constructing confidence intervals and conducting hypothesis testing, which are essential for making informed trading decisions.
For instance, a trader might use T-distribution to test the effectiveness of a new trading strategy. Suppose a trader has developed a strategy using the technical analysis tools and wants to understand its potential effectiveness compared to the general market performance. They would collect a sample of returns from this strategy over a period, say, 30 days. Given the small sample size, using T-distribution is appropriate here.
The trader would then calculate the mean return of this sample and use T-distribution to create a confidence interval. This interval would provide a range within which the true mean return of the strategy is likely to lie, with a certain level of confidence. If this confidence interval shows a higher mean return than the market average, the trader might conclude that the strategy is potentially effective. However, it's important to note that this is an estimation and not a guarantee of future performance.
How to Plug Probability and Normal Distribution in Your T-Calculation
To use a T-calculator for integrating probability and normal distribution, follow these steps:
- Input Degrees of Freedom: For T-distribution, calculate the degrees of freedom (sample size minus one).
- Convert Z-Score to T-Value: If using normal distribution data, convert the Z-score (standard deviation units from the mean in a normal distribution) to a T-value using the formula: T = Z * (sqrt(n)), where 'n' is the sample size.
- Enter T-Value: Input this T-value into the calculator.
- Calculate Probability: The calculator will then output the probability, providing a statistical basis for trading decisions based on the T-distribution.
Limitations and Considerations of T-Distribution
While T-distribution is a powerful tool in trading analysis, it's important to recognise its limitations and considerations:
- Sample Size Sensitivity: T-distribution is most effective with small sample sizes. As the sample size increases, it converges to a normal distribution, reducing its distinct utility.
- Assumption of Normality: T-distribution assumes that the underlying data is approximately normally distributed. This may not hold true for all financial data sets, especially those with significant skewness or kurtosis.
- Degrees of Freedom Complications: Misestimating degrees of freedom can lead to inaccurate results. It's crucial to calculate this correctly based on the sample data.
- Outlier Sensitivity: T-distribution can be overly sensitive to outliers in the data, which can skew results.
Advanced Applications of T-Distribution in Trading
T-distribution extends beyond basic trading applications, playing a role in advanced financial analyses:
- Risk Modelling: Utilised in constructing sophisticated risk models, helping traders assess the probability of extreme losses.
- Algorithmic Trading: Integral in developing complex algorithms.
- Portfolio Optimisation: Assists in optimising portfolios by estimating returns and risks of various assets.
- Market Research: Used in advanced market research methodologies to analyse small sample behavioural studies.
The Bottom Line
The T-distribution is a powerful tool, offering nuanced insights in scenarios involving small sample sizes or uncertain standard deviations. Its ability to accommodate real-world data's quirks makes it invaluable for various trading applications, from strategy testing to risk assessment. However, understanding its limitations and proper application is crucial for accurate analysis.
This article represents the opinion of the Companies operating under the FXOpen brand only. It is not to be construed as an offer, solicitation, or recommendation with respect to products and services provided by the Companies operating under the FXOpen brand, nor is it to be considered financial advice.
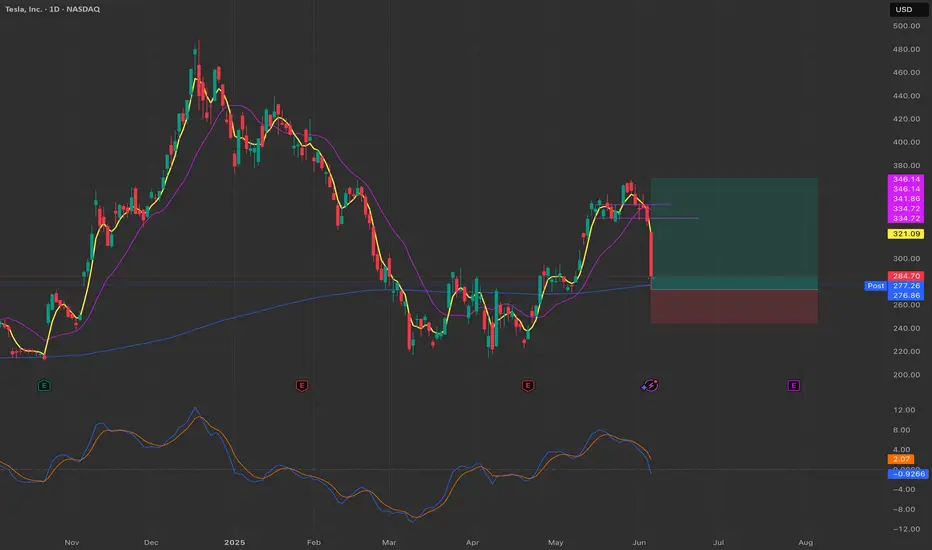
TSLA Failing at Gamma Wall! Will $322 Hold or Collapse Into $315🔬 GEX (Options Sentiment) Breakdown:
* Gamma Exposure Zones:
* Major Resistance (Gamma Wall): $327.50 → current rejection zone
* Second CALL Wall: $340 → unlikely unless gamma squeeze kicks in
* Strongest CALL Zone: $350 (very unlikely without broader tech rally)
* PUT Support Zones:
* $322.50 → HVL + initial gamma flip
* $315 = highest negative GEX / heavy PUT support
* $310 = 3rd PUT wall — deep flush risk
* Options Metrics:
* IVR: 25.2 (moderate)
* IVx avg: 70.5
* Calls Flow: 71.5% → bullish interest still high
* GEX Sentiment: 🟢🟢🟢🟢 (tilted bullish but with risk below $322.50)
* Interpretation:
* TSLA is trading below the Gamma Wall at $327.5 and just cracked the HVL zone at $322.5 — this is a bearish transition point.
* GEX model shows put acceleration below $322. If bulls don’t step in quickly, it could slide fast to $315 or even $310.
🧠 15-Minute SMC Breakdown:
* Current Price: $325.00
* Structure:
* Multiple CHoCHs and BOS levels near $330–$327
* Bearish wedge breakdown from consolidation just occurred
* Breakdown candle volume surging = institutional selling confirmed
* Entering demand zone (green box) near $324 → temporary bounce possible
* Trendlines:
* Broken wedge & horizontal support = confirms downside pressure
* If $322.50 fails, next liquidity is $315 (GEX + prior BOS zone)
⚔️ Trade Setups:
🟥 Bearish Setup (High Probability):
* Trigger: Continuation below $322.50
* Target 1: $315 (PUT support)
* Target 2: $310
* Stop-loss: Above $327.50 (Gamma Wall)
Price is transitioning below gamma support and into negative delta zone — watch for acceleration if $322.50 loses volume bid.
🟩 Bullish Scenario (Needs Reclaim):
* Trigger: Reclaim of $328
* Target 1: $331.20 (minor resistance)
* Target 2: $336–$340 (CALL wall / next GEX magnet)
* Stop-loss: Below $324.50
Would need strong market reversal and SPY/QQQ support for this to play out.
💭 My Thoughts:
* TSLA is transitioning into a bearish zone, especially with this CHoCH + GEX rejection from $327.5.
* Volume spike shows sellers are stepping in — bounces are sell opportunities unless reclaimed fast.
* Call buyers are still heavy (71.5%) — if this unwinds, downside could be even faster.
* Great setup for PUT spread or directional PUTs on breakdown.
🔚 Conclusion:
TSLA has rejected from the $327.5 Gamma Wall and now cracked a key support. With structure and options data aligned, a flush to $315 is on watch if $322.5 breaks cleanly. Bullish only above $328 with strength.
Disclaimer: This content is for educational purposes only. Always manage your risk and execute trades based on your own strategy.

Tesla🚗 Tesla (TSLA) – Long-Term Bullish Outlook 📈
Tesla is showing extreme bullish strength across higher timeframes, supported by strong fundamentals, innovation momentum, and institutional interest. The current price action suggests a solid long-term buying opportunity for patient investors and swing traders alike.
🔍 Technical Outlook:
The stock has broken key resistance levels and is maintaining higher lows.
Momentum indicators support continuation of the uptrend.
Volume and sentiment remain favorable.
📅 Investment Horizon:
Mid to Long Term (Up to 2 Years)
🎯 Target Levels:
➡️ 500 – First major resistance
➡️ 700 – Medium-term breakout target
➡️ 900 – Long-term bullish target based on macro and chart structure
📌 Strategy:
Buy on dips or sustained breakouts. Suitable for long-term portfolios with a 1–2 year holding perspective. Risk management and scaling in recommended.
💬 This is not financial advice. Always do your own research and manage risk appropriately.
#TSLA #Tesla #Stocks #TradingView #Investing #Bullish #LongTerm #SwingTrade #GrowthStocks

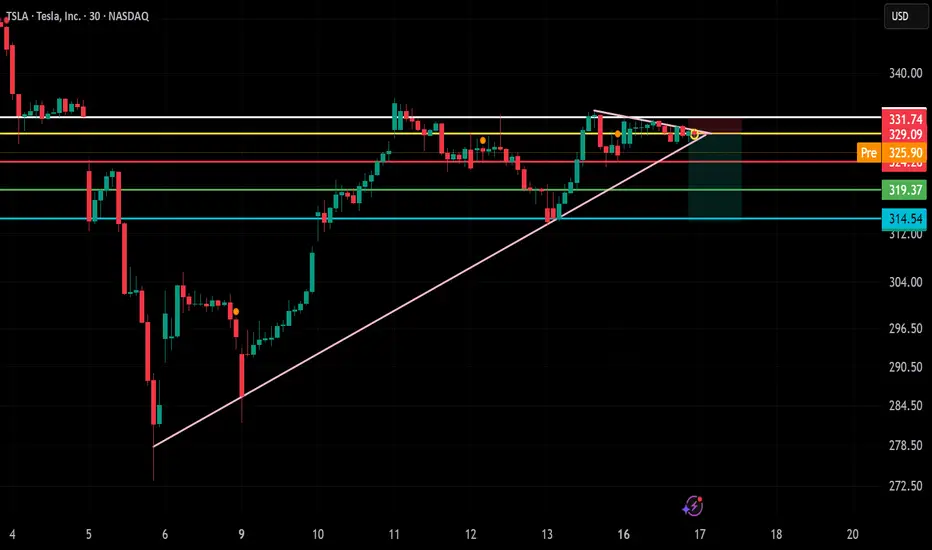
TSLA – Short Trade Setup!📉
🔍 Pattern: Rising wedge breakdown
📍 Entry: ~$329.09 (breakdown candle near resistance)
🎯 Target: $319.37 (first support), $314.54 (major support)
🛑 Stop-loss: $331.74 (above wedge and resistance zone)
✅ Why this setup?
Price is rejecting from wedge top + supply zone
Bearish structure with lower highs forming
Clear breakdown below ascending trendline
Good risk-reward targeting previous demand zones
🕒 Timeframe: 30-minute
📈 Bias: Short / Reversal from resistance
Take a bullish position on TSLA as price action confirms upside
Current Price: $325.31
Direction: LONG
Targets:
- T1 = $335.00
- T2 = $345.00
Stop Levels:
- S1 = $320.00
- S2 = $315.00
**Wisdom of Professional Traders:**
This analysis synthesizes insights from thousands of professional traders and market experts, leveraging collective intelligence to identify high-probability trade setups. The wisdom of crowds principle suggests that aggregated market perspectives from experienced professionals often outperform individual forecasts, reducing cognitive biases and highlighting consensus opportunities in Tesla.
**Key Insights:**
Tesla has shown substantial resilience in the tech-heavy market, with bullish sentiment linked to its innovative product lineup, particularly autonomous vehicles and the forthcoming robo-taxi launch. Institutional investors have actively increased positions, signaling long-term confidence in Tesla’s disruptive growth narrative. However, mixed profitability metrics and emerging competition in the global EV space keep valuations under scrutiny. Tesla’s price action around $325.31 suggests that the optimism surrounding potential catalysts outweighs near-term concerns, with technical momentum favoring further upside gains.
**Recent Performance:**
Tesla has demonstrated significant strength in recent trading sessions, successfully recovering from a minor pullback that aligned with broader market volatility. The stock climbed steadily from its $300 support level and has outperformed the broader tech sector during a period of overall market uncertainty. Heavy volume and speculative trading suggest strong engagement from both institutional and retail participants.
**Expert Analysis:**
Technical outlook for Tesla indicates bullish divergence on the daily Relative Strength Index (RSI) coupled with a successful retest of its 50-day moving average. These factors affirm that momentum remains firmly to the upside. Analysts highlight Tesla’s ability to set remarkable trends within the EV sector, backed by advancing autonomous technologies and renewable energy solutions. Near-term resistance sits at $335, where a breakout would likely trigger further upward movement toward $345.
**News Impact:**
Recent news regarding Tesla’s upcoming robo-taxi launch in June has considerably bolstered investor sentiment. Market participants view this innovation as a key milestone that could redefine Tesla’s growth trajectory. However, declining EV sales in Europe and the United States remain a concern, potentially capping excessive bullish momentum. Traders should watch for more clarity on macroeconomic factors influencing demand.
**Trading Recommendation:**
Tesla’s combination of technical strength and ground-breaking product developments underpins a favorable trading outlook. A long position with well-defined stops below $320 offers an attractive risk/reward setup, targeting $335 and $345 sequentially. While global sales trends warrant close monitoring, Tesla’s leadership within the EV and tech space supports a bullish thesis in the short term.
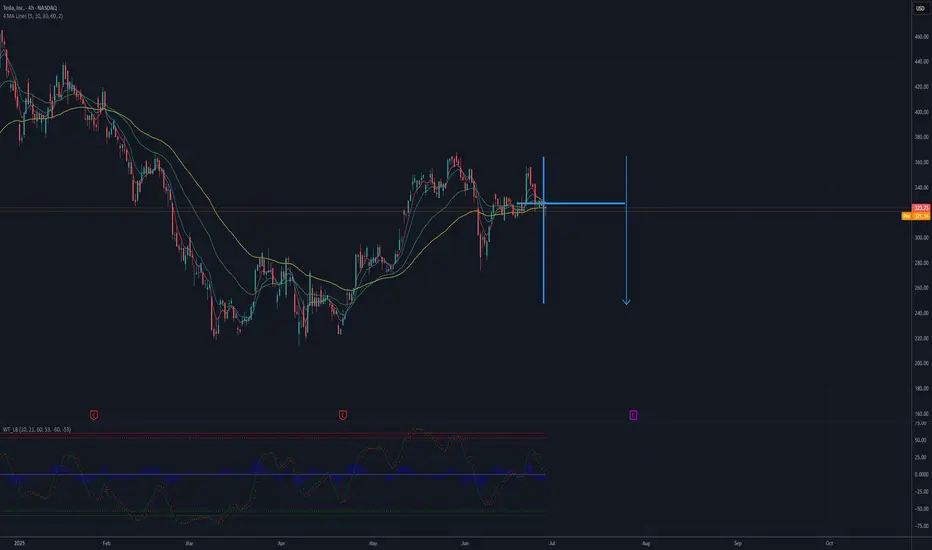
TESLA falling down to 250 USD?Tesla is consolidating in a tight range, showing bearish pressure near the lower boundary of the formation. Moving averages (MA 5/10/30/60) are flattening, indicating a loss of bullish momentum, while the Wavetrend oscillator has issued a sell signal (bearish crossover below the zero line). A downside breakout from this range projects a potential move toward the $250 level, as illustrated by the measured move. This bearish scenario gains validity if price breaks below the $315 support level.
Possible TP: 250 USD
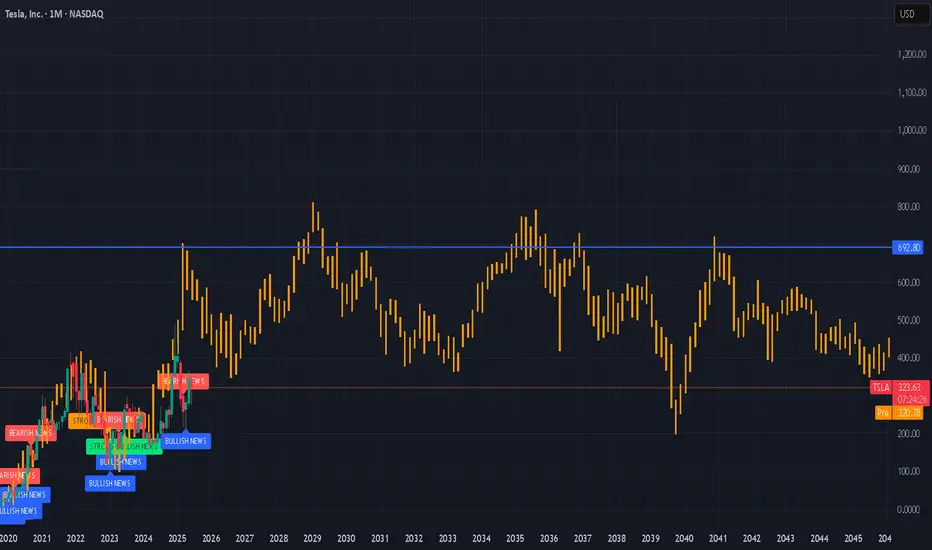
Tesla-Heading For A New ATH?NASDAQ:TSLA is looking good!
Robo-Taxi, Optimus Robots...and so more to come!
Tesla to $692 in the next years? Or months?
#stocks #tesla #stockmarket
Long-Term Growth Potential in the Face of Short-Term ChallengesCurrent Price: $323.63
Direction: LONG
Targets:
- T1 = $331.50
- T2 = $345.00
Stop Levels:
- S1 = $319.50
- S2 = $310.00
**Wisdom of Professional Traders:**
This analysis synthesizes insights from thousands of professional traders and market experts, leveraging collective intelligence to pinpoint high-probability trade setups. The wisdom of crowds principle suggests that aggregated perspectives from experienced professionals build a more balanced outlook on Tesla, reducing emotional biases and highlighting consensus opportunities in the market.
**Key Insights:**
Tesla is currently navigating through a challenging phase characterized by competitive pressures in both China and Europe. Recent macroeconomic headwinds, including rising interest rates and shrinking global spending on electric vehicles, have fueled concerns about short-term sales performance. However, analysts remain optimistic about Tesla's innovation leadership, particularly in AI-driven robotics, battery technology, and autonomous mobility development. The recent technical charts reflect a narrowing wedge formation, and a breakout above $354.78 could confirm renewed bullish momentum, offering significant upside potential.
**Recent Performance:**
Over the past few weeks, Tesla has experienced tight price consolidation, underlying near-term indecision among market participants. While its stock price remains below short-term moving averages, signaling bearish pressure, longer-term sentiment is bolstered by overall optimism in the technology sector. Additionally, fluctuations in deliveries and revenue from various regions continue to impact day-to-day trading sentiment, with the stock showcasing higher volatility during earnings updates.
**Expert Analysis:**
Market analysts exhibit cautious optimism surrounding Tesla. Short-term concerns linger about declining sales growth in legacy markets such as Europe and the loss of its dominant position in China due to rising competition from local manufacturers like BYD. However, whether Tesla can monetize its cutting-edge developments in AI, robotics, and autonomous driving remains a focal point of its long-term strategy. Analysts agree that while these initiatives may redefine the EV market over the next 5-10 years, revenue realization is expected to be slow and could dampen speculative enthusiasm in the immediate term.
**News Impact:**
Tesla recently announced the launch of its robo-taxi initiative, beginning trials in Austin, Texas, a move that challenges traditional mobility norms. While this innovation enhances Tesla's narrative as a disruptor in the industry, regulatory obstacles and scalability issues pose immediate hurdles that could delay market adoption. On the downside, Tesla saw declining deliveries in Europe and China, casting shadows over its near-term growth prospects in these critical regions. Investors should keep a close eye on upcoming earnings reports for clearer guidance on production schedules and delivery forecasts.
**Trading Recommendation:**
Based on recent technical consolidation and consensus expert views, traders are recommended to take a long position on Tesla with price targets of $331.50 and $345.00. The stock exhibits signs of medium-term upside potential if momentum aligns with broader bullish trends in the S&P 500 and technology sectors. Implement disciplined risk management with stop levels set at $319.50 and $310.00 to protect against unfavorable moves. Investing in Tesla provides exposure to a high-risk innovation-driven narrative; traders should evaluate their appetite for risk carefully before entering this position.

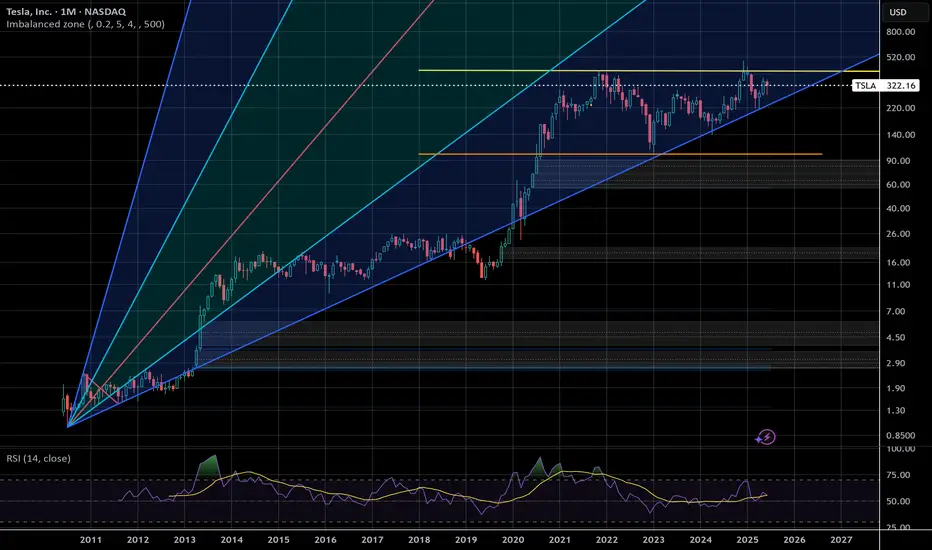
The Importance of Price HistoryAs you can see, even the first year of a stocks price history can influence trends forever
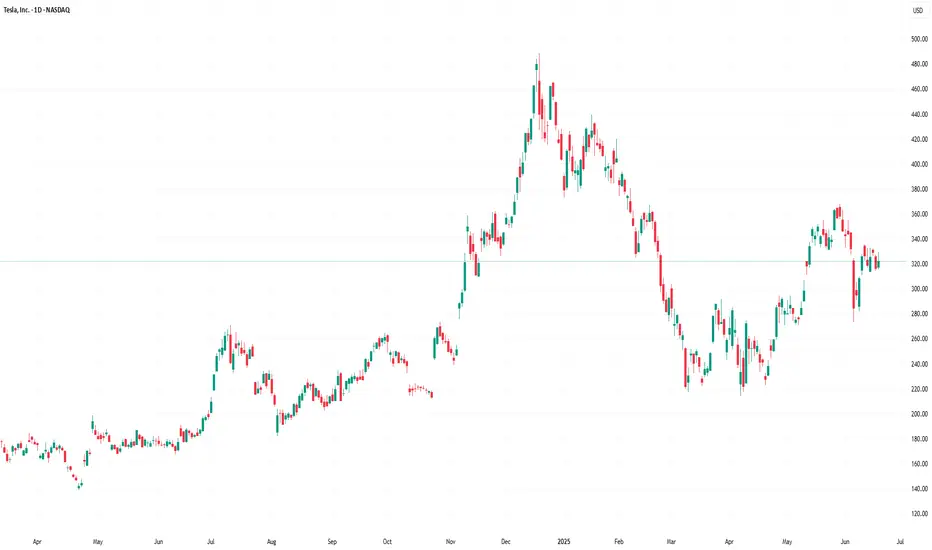
TSLA is now at a key level on a historical trend, riding a longtime trendline while being sandwiched in a strong support/resistance area since 2021. Watching for big moves that signal the S & P 500's direction in the coming month, the next price move will be volatile
If TSLA falls below $100 it's in big danger of falling down that grey imbalance zone on the monthly. The volatility of this stock is it's greatest asset and weakness. Personally, I wouldn't want to be trading this stock without a tight stop loss
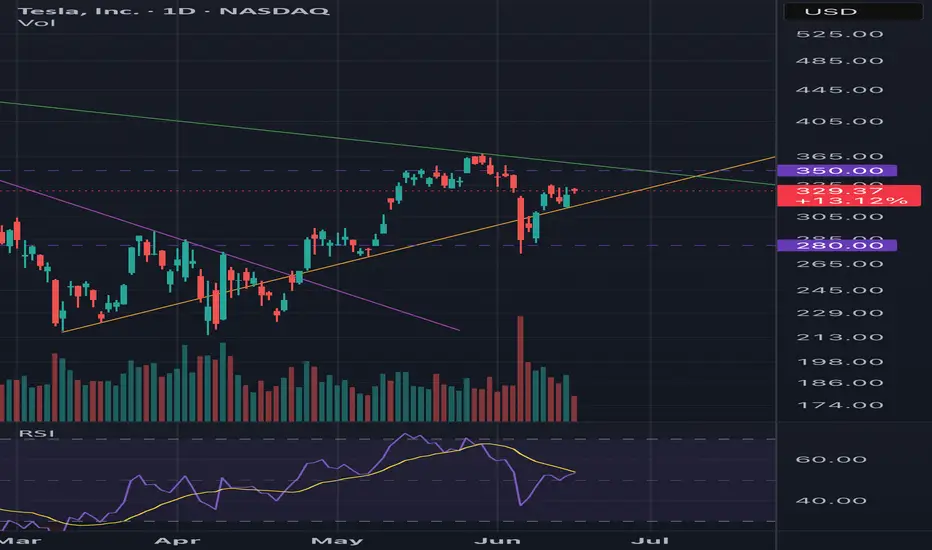
TSLA Bullish to $350I’m still bullish on TSLA. As long as it stays above the orange trend line I expect us to grind higher. RSI is not in overbought territory. $350 is the target.
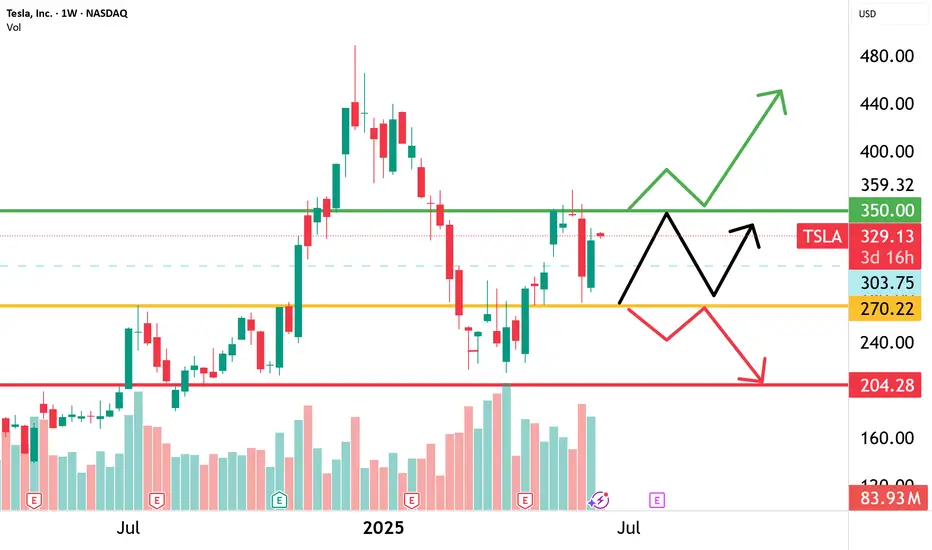
TESLATesla is in the correction right now for bigger structure. It can go up to break the recent top with small correction or it can breakdown further before a push up.
Disclosure: We are part of Trade Nation's Influencer program and receive a monthly fee for using their TradingView charts in our analysis.