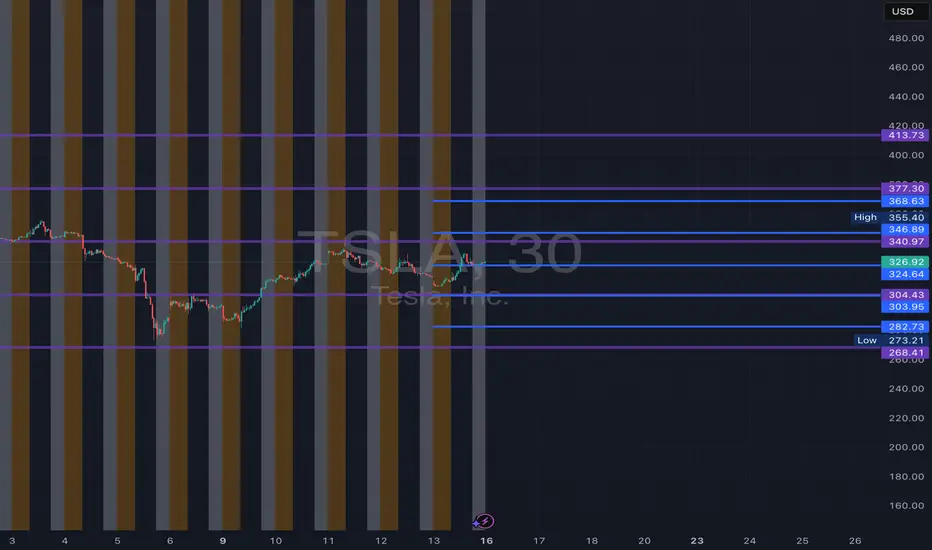
TSLA June 2025 Monthly Support & Resistance Lines Valid till EOMOverview:
The purple lines serve as support and resistance levels for TSLA stock throughout the month of June. When the price approaches these lines from either the bottom or the top, I will consider taking long or short positions in TSLA stock, depending on the direction of the price movement.
Trading Timeframes
I usually use 30min candlesticks to swing trade options by holding 2-3 days max. Some can also use 3hr or 4hrs to do 2 weeks max swing trades for massive up or down movements.
I post these 1st week of every month and they are valid till the end of the month.
Extra:
I added Blue Lines which are weekly line for June 16th to 20th.
TSLA34 trade ideas
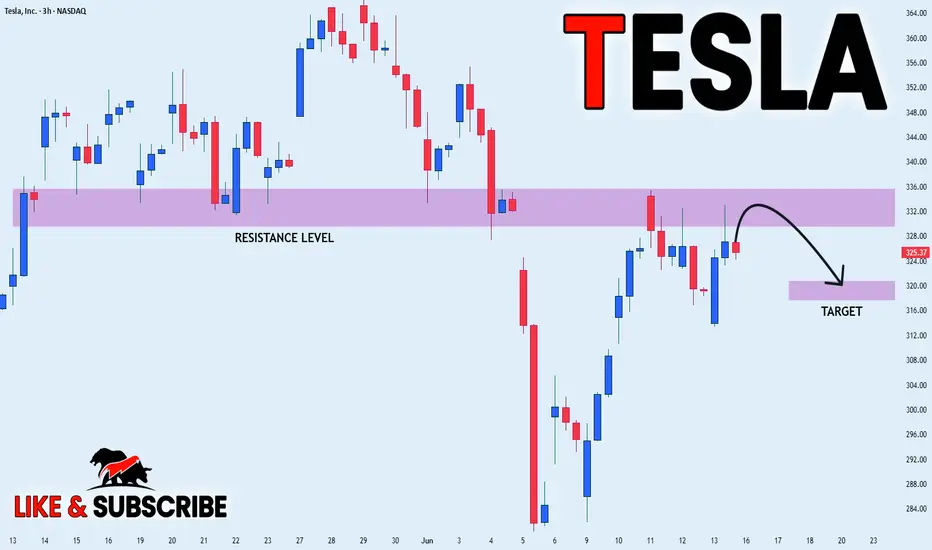
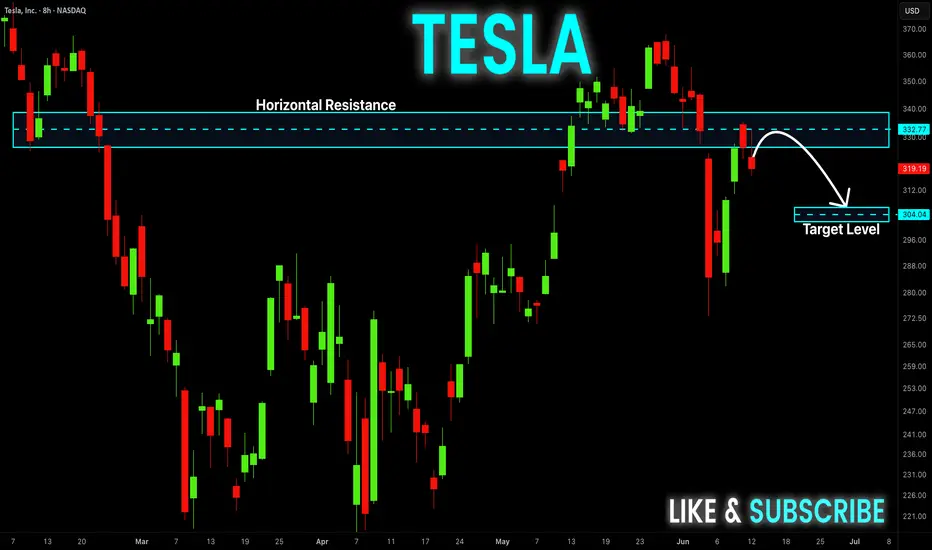
TESLA WILL GO DOWN|SHORT|
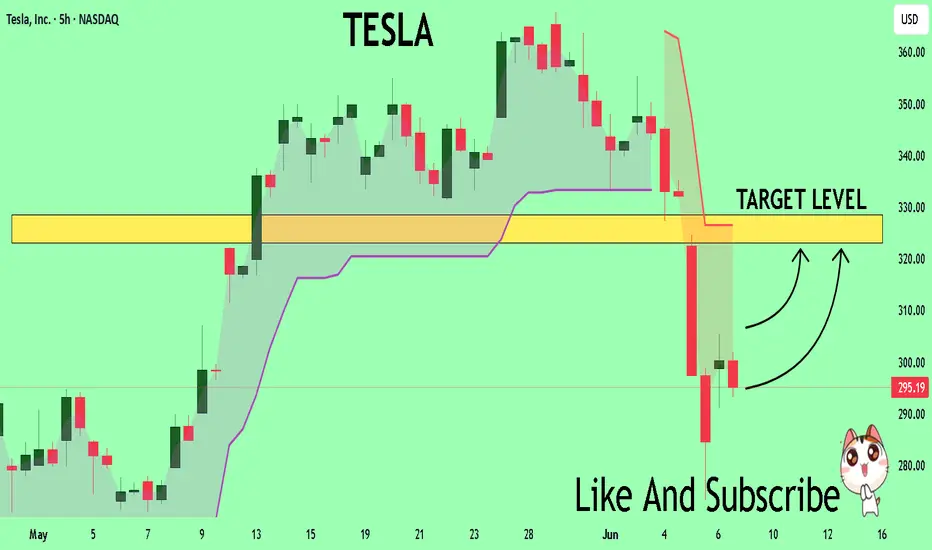
✅TESLA is going up now
But a strong resistance level is ahead at 336$
Thus I am expecting a pullback
And a move down towards the target of 320$
SHORT🔥
✅Like and subscribe to never miss a new idea!✅
Disclosure: I am part of Trade Nation's Influencer program and receive a monthly fee for using their TradingView charts in my analysis.
looking hella bullishThe price will likely shoot up during premarket, then capitualate, then have the real price movement when the market opens.
Price is getting squeezed tighter, likely will have a dramatic move.

TSLA UPSIDE? BULLISH?Thoughts on Elliott Wave pattern applied to TSLA DAILY chart. Please do share thoughts, my belief is were are in a primary third wave, expect 5 impulse waves of minuet up. Hearing good things from tesla again recently.
Near bottom. On The way To $2k as The Singularity Approaches see chart.
Near bottom. On The way To $2k as The Singularity Approaches .
Gold silver the es and the Russell Friday 13 there's no time to have a long discussion here the information is in the video important things are happening in these markets and they are explained in the video. there are some changes suggesting that the silver may not actually go lower at this point even though the gold is holding for the time being .

How I Got My Win Rate to 94.12% ($4.59 per $1 risk expectancy)There's a lot of people who talk smack about high win rates, probably to justify their low win rates.
The justification usually sounds something like this 'You do know the best traders have win rates under 50% and win rates mean nothing right?'. Nothing could be further from the truth in the context of the archetypal character who writes such a thing in trading view minds. A high win rate shows something very very important.. proof of edge.
Now if someone wants to believe I'm taking penny wins and dollar losses, be my guest but use your head...in fact, one better... use your eyes. There is a nice little stat there called 'profit factor', what it tells you is how many dollars profit per trade my expectancy is. Wake up, understand that not everyone is a trading guru scammer. Not everyones stats are fake, and if you want to see for yourself... its easy to do. Simply watch my livestream, there is no better proof of edge than that.

TESLA Will Fall! Sell!
Hello,Traders!
TESLA went up from the
Horizontal support but has
Hit a horizontal resistance
Of 335$ and we are already
Seeing a bearish pullback
So we will be expecting
A further local move down today
Sell!
Comment and subscribe to help us grow!
Check out other forecasts below too!
Disclosure: I am part of Trade Nation's Influencer program and receive a monthly fee for using their TradingView charts in my analysis.
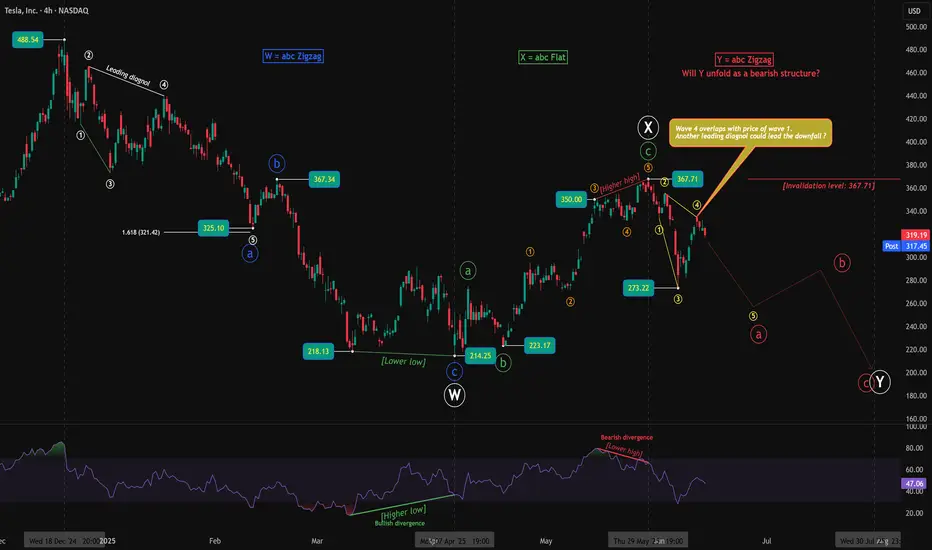
Tesla’s Flat Deception: Bearish Wave Y in the Making?Tesla’s price structure has taken traders on quite a journey, and after peeling back the layers, it's clear that both bullish and bearish possibilities demanded attention — but only one holds more weight for now.
The first sign of life came at the March low, where price made a lower low (218.13 to 214.25), but RSI formed a higher low. This classic bullish divergence paved the way for a strong rally, confirming that Wave W had likely ended with a sharp zigzag, and Wave X was beginning to unfold. The bounce from 214.25 extended into a flat structure, which completed near 367.71 — a textbook ABC flat with the internal wave b forming a higher low at 223.17.
Initially, this structure looked like the beginning of a bullish impulse. The drop to 273.22 perfectly tagged the 0.618 Fibonacci retracement, and it was tempting to label it as Wave 2 of a new impulse. However, that bullish view began to crack when the bounce from 273.22 appeared to be a three-wave move, not a clean five-wave impulse. More importantly, Wave 4 of this move overlapped the price of Wave 1 — a key violation that rules out a typical impulse and instead suggests the move was a leading diagonal.
This view is supported by the RSI, which revealed bearish divergence as price climbed from 350.00 to 367.71 — price made a higher high, but RSI made a lower high, indicating fading momentum. That divergence, combined with the overlapping structure, tilts the probability toward a bearish scenario now unfolding as Wave Y.
If this view plays out, the decline from 367.71 may be the start of Wave a of Y in a final zigzag correction. The projected path would take Tesla lower in a 5-3-5 structure, with potential support near or below the March lows. The bearish view remains valid as long as price stays below 367.71 — the clear invalidation point. A move above that level would force a reevaluation and potentially revive the bullish case.
At this point, the market has spoken — and it's whispering bearish. The structure favors caution unless bulls reclaim momentum with strength.
Disclaimer: This analysis is for educational purposes only and does not constitute investment advice. Please do your own research (DYOR) before making any trading decisions.
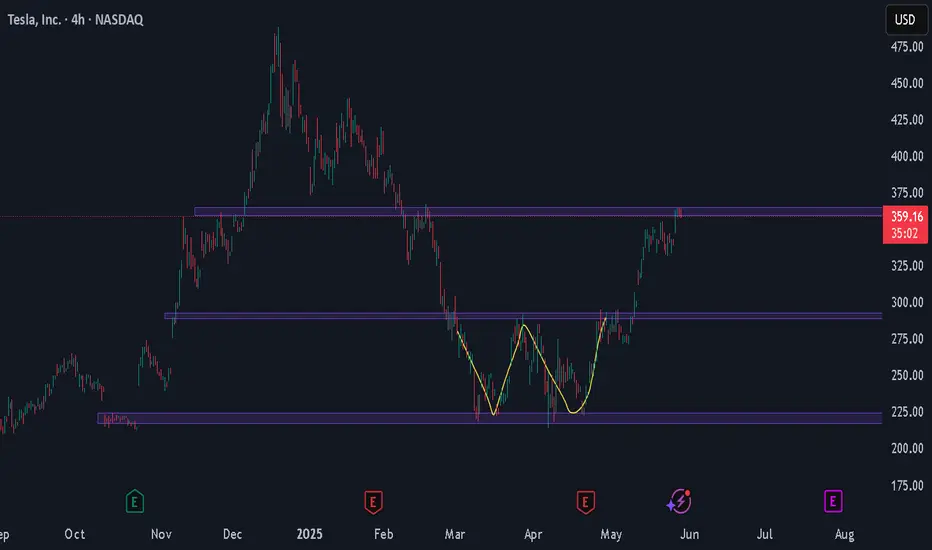
Tesla (TSLA) Share AnalysisHello, Tesla investors!
Tesla stock has gained good momentum recently, breaking the downtrend and rising to $362. This rise has been fueled by investor interest in Elon Musk's full-time return to the company's helm and the upcoming Robotaxi launch.
Technically speaking , the stock has formed a "double bottom" (W) pattern, and its target, $362, has been reached. However, we are now facing strong resistance at this level. If this resistance level is not surpassed with sufficient trading volume, we may see a short-term pullback.
The possibility of a short-term correction increases, especially with the RSI indicator approaching the overbought zone.
The $335 and $290 regions stand out as support levels. These levels are important to watch for possible pullbacks.
In summary , Tesla stock is in an important resistance zone. Breaking through this level with high volume could signal the start of a new uptrend. Otherwise, we may face a short-term correction. Consider these levels and technical indicators when making investment decisions.
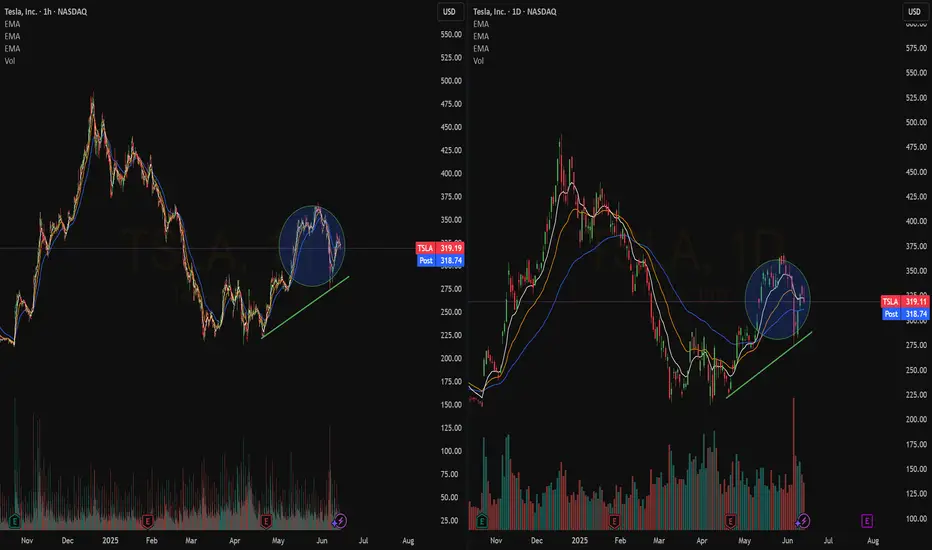
Quick View: $TSLADaily -> Bullish crossover with pullback (and volume)
Hourly-> Consolidated bullish trend
Watching for a #TopSwing Setup on the Daily Chart
Short TSLA, for nowdef juice to the downside right now, media attn is insane. But theirs major harmonics at play. and ill be buying at those lows and posting long, until then. dont fight it. t3 almost hit of momentum measure. actually insane moves
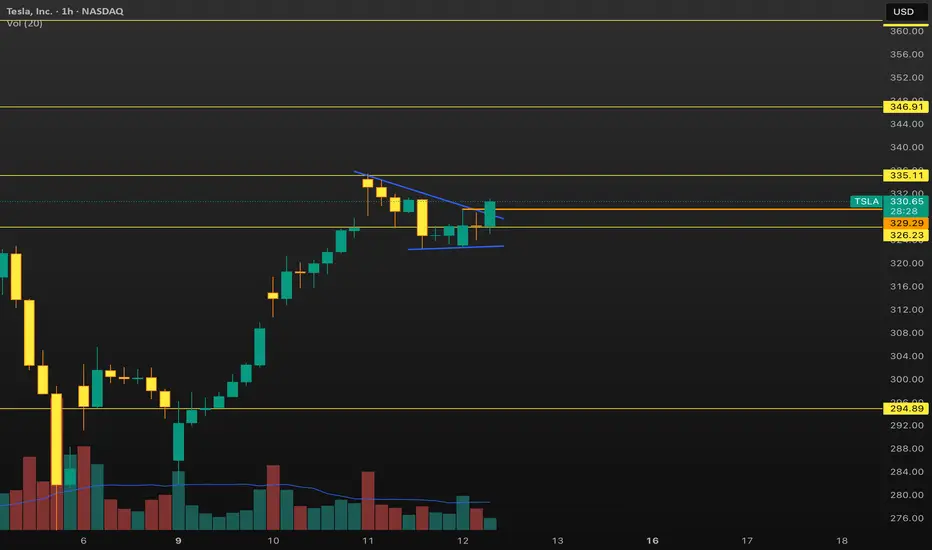
TSLA This is good. 329 over and 335 is next resistance. Really good trade if for tomorrow for next week. Given the stock can hold here
TSLA Short Entry | Recession UnderwayI have added to NASDAQ:TSLA short.
I have also linked my previous Tesla short chart from 2022.
Nothing has changed with Tesla. The company is severely over-valued.
I will continue to provide updates.
Tesla TSLA 🧠 Breakdown of this setup:
The pattern is an inverse head‑and‑shoulders, signaling a reversal from bearish to bullish momentum.
Technical commentators highlight crucial support near $300, suggesting that’s the fueling station before lift-off
After breaking the neckline, measured upside targets land in the $400–420 zone, fitting that “rocketship” trajectory vibe
🎯 Launch Pad & Destination
Pre‑launch dip: ~$300 sets the inverse H&S bottom.
Ignition point: Breakout above neckline brings liftoff.
Orbit target: ~$420—your mission succesfully completed.

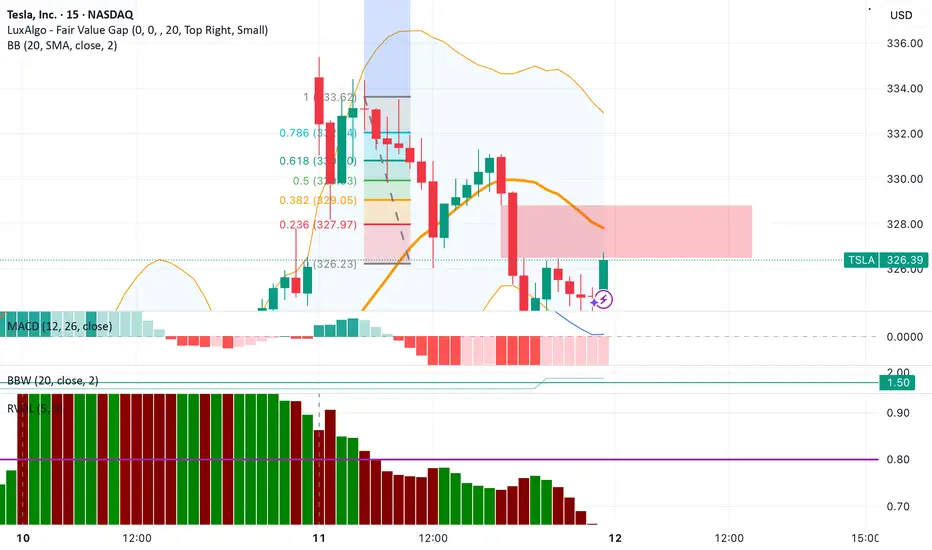
Wednesday Session Debrief (100% Win Rate This Week Thus Far).Early move 1 put @ 935am entry was stacked against a large Bullish FVG so I didn't take it. Call structure came in, but ended up being false positive. As a result i opened a short hedge (01), got chopped up and opened another long and 3 more shorts during 1 hour of choppy price movements as bulls and bears fought over direction to establish control. The final short i opened was when price pushed below $330, exited in very decent profit today considering the unpredictable price action.
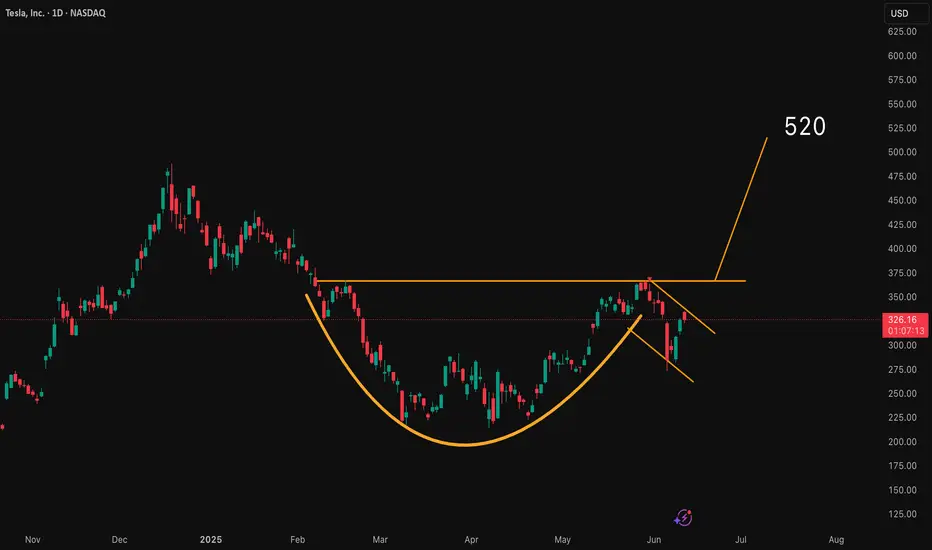
Cup and handleA big move is coming if the formation breaks to the upside. I see 500-520$ as the target area.
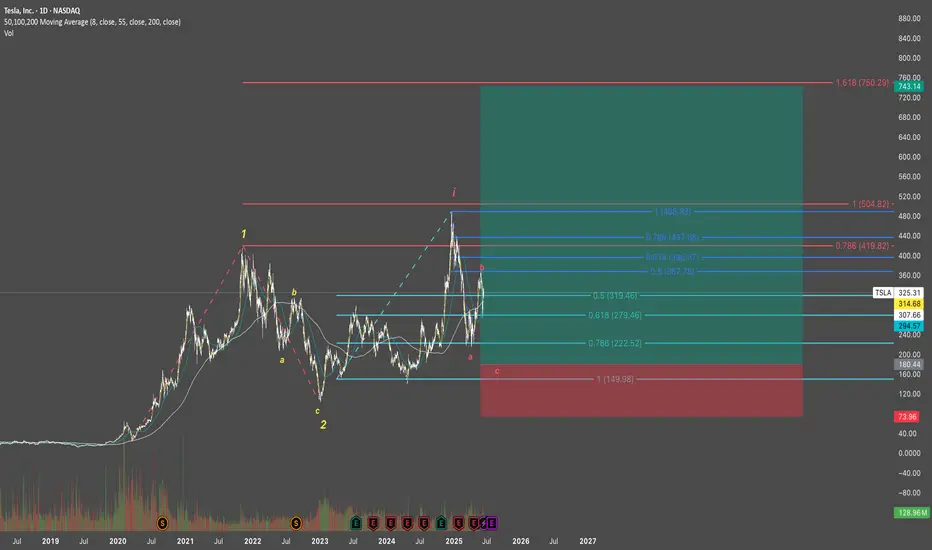
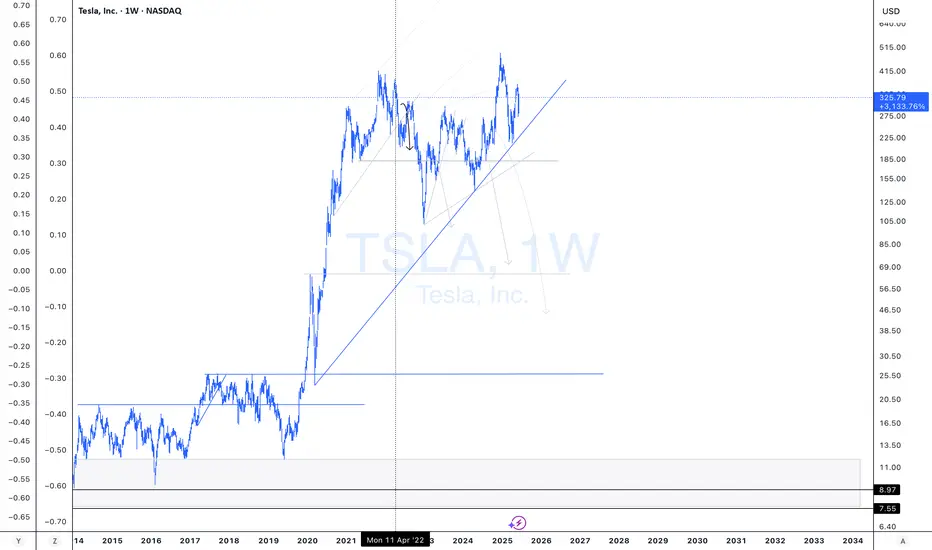
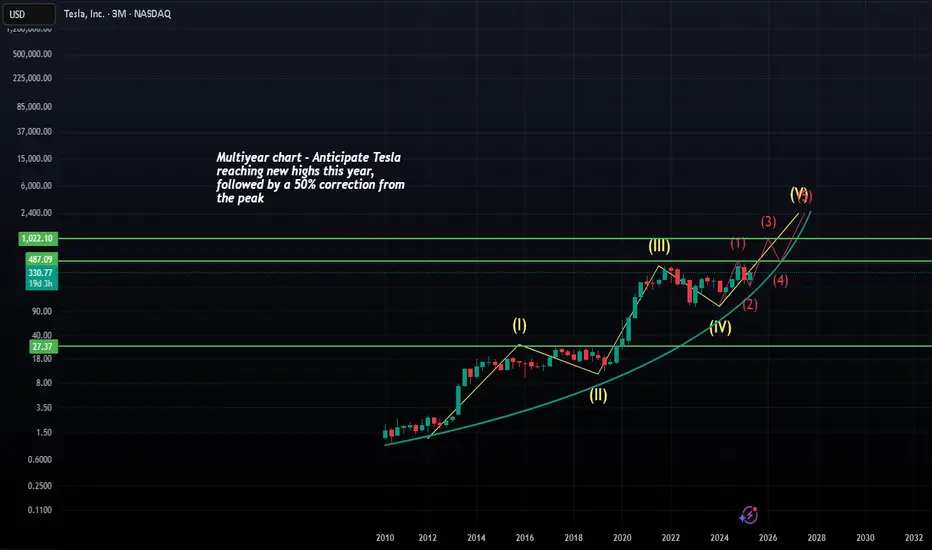
TESLA - Multiyear ChartI'm optimistic about Tesla's long-term prospects, viewing it as a multi-year investment. I anticipate Tesla reaching new highs this year, followed by a 50% correction from the peak to retest the breakout level. With patience, holding for years could yield strong returns.
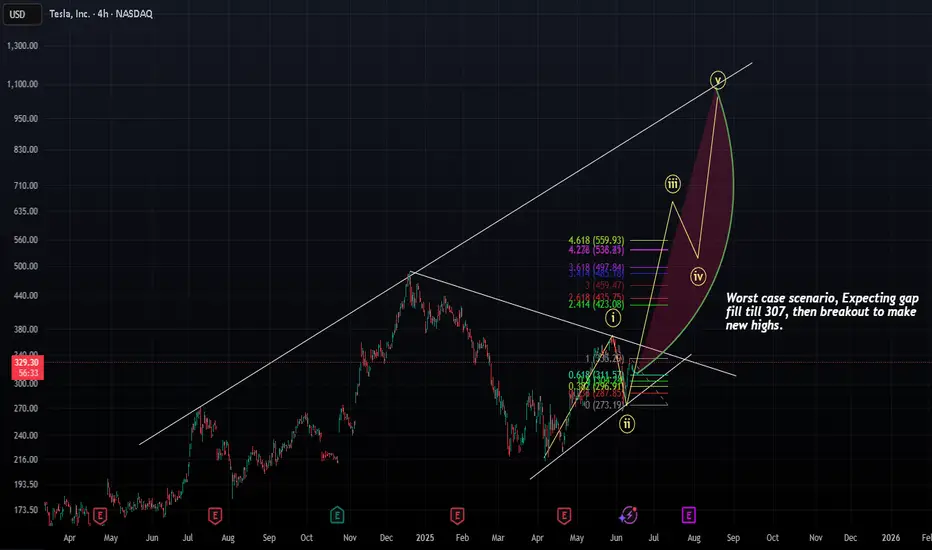
TESLA - Some consolidation, before parabolic moveAnticipating Tesla to consolidate, with a worst-case scenario of filling the gap down to $307, followed by a sharp parabolic rise to new all-time highs.
Get ready for a parabolic move :)
TESLA Technical Analysis! BUY!
My dear subscribers,
My technical analysis for TESLA is below:
The price is coiling around a solid key level - 295.19
Bias - Bullish
Technical Indicators: Pivot Points Low anticipates a potential price reversal.
Super trend shows a clear buy, giving a perfect indicators' convergence.
Goal - 323.17
About Used Indicators:
By the very nature of the supertrend indicator, it offers firm support and resistance levels for traders to enter and exit trades. Additionally, it also provides signals for setting stop losses
Disclosure: I am part of Trade Nation's Influencer program and receive a monthly fee for using their TradingView charts in my analysis.
———————————
WISH YOU ALL LUCK
Tesla (TSLA) Shares Rebound After Sharp DropTesla (TSLA) Shares Rebound After Sharp Drop
When analysing the Tesla (TSLA) stock price chart six days ago, on the morning of 5 June, we:
→ highlighted Elon Musk’s critical comments regarding the spending bill promoted by the US President;
→ noted that a potential rift between Musk and Trump could have long-term implications, including for TSLA shares;
→ outlined an ascending channel (marked in blue);
→ suggested that the price might correct from the upper to the lower boundary of the channel.
This scenario played out rather aggressively: later that same day, during the main trading session, Tesla’s share price dropped sharply to the lower boundary of the channel amid a scandal involving Musk and Trump.
However, the lower boundary of the channel predictably acted as support. Yesterday, TSLA shares were among the top five performers in the S&P 500 index (US SPX 500 mini on FXOpen), gaining around 5.6%.
As a result, TSLA stock price climbed back above the psychologically important $300 mark, recovering from the previous week’s sell-off.
Why Are Tesla (TSLA) Shares Rising?
Bullish drivers include:
→ The upcoming launch of Tesla’s robotaxi service, provisionally scheduled for 22 June. Elon Musk has stated he intends to use the service himself.
→ Easing of tensions with the US President. Donald Trump declared that he has no intention of "getting rid of Tesla or Starlink" should he return to the White House.
→ Continued support from Cathie Wood, the prominent asset manager, who once again reaffirmed her confidence in Tesla’s future success.
Technical Analysis of TSLA Chart
Today, TSLA’s share price is hovering near the median line of the previously identified ascending channel – a zone where supply and demand typically seek equilibrium.
Also worth noting is the $320 level: in May, it acted as support, which suggests it may now function as resistance.
Given these factors, it is reasonable to expect that the sharp recovery from the 5 June low may begin to lose momentum, with the price likely to stabilise and form a consolidation range following the recent spike in volatility.
This article represents the opinion of the Companies operating under the FXOpen brand only. It is not to be construed as an offer, solicitation, or recommendation with respect to products and services provided by the Companies operating under the FXOpen brand, nor is it to be considered financial advice.

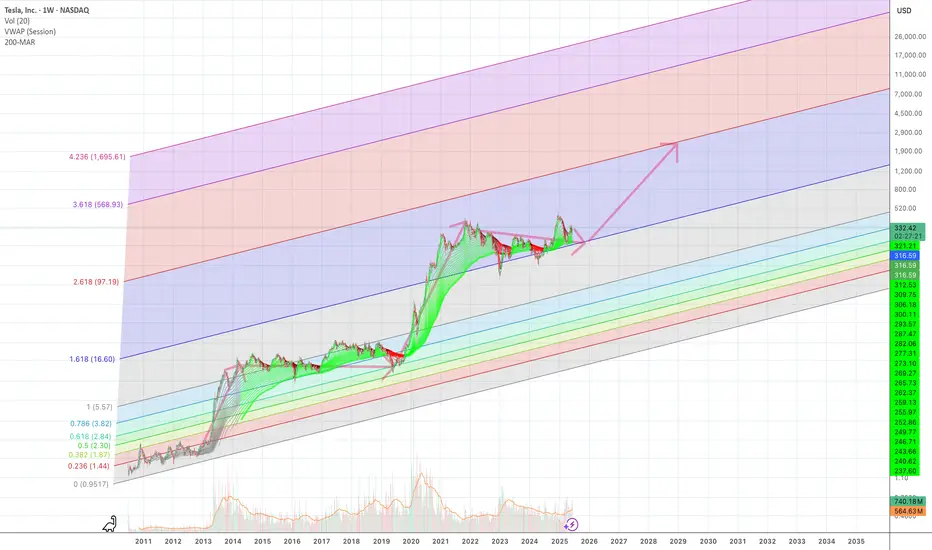
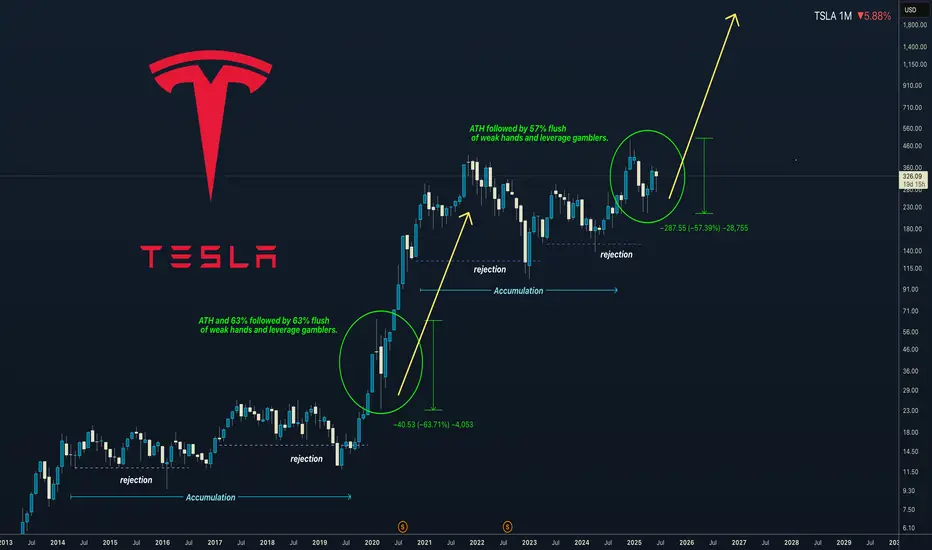
Tesla Crashed 57% — Here’s What History Says Happens AfterThose who knows me you know Im Tesla Bull. I got a longterm vision for Robotics and AI. Which I think Tesla will be big part of it. Whether you like Elon Musk or not Tesla will participate. Can. his behavior and politics acitivities affect Tesla stocks? Absolutely, Im aware that this is risky long term investment. I got numbers which I follow, shared in my previous Tesla ideas.
Here is a just price action and historical perspective - History doesnt repeat but it definitely rhymes and I can see this pattern repeating. Here is a key points.
5 years accumulation
Few big dumps followed by rejections
Break out and new ATH
ATH imidiatelly followed by 60% dump
After Dump price expanded 1000%
Currently we are at point 4.....
Will the history repeat ??
I dont know and Im not shilling anything, its my view which Im betting on based on the data from the expert analysts which I shared in this posts.
PS: Every of mine Tesla idea gets too emotional comments. I get it, you hate Elon, or you have different opinions. Fine I respect that, but please stay civil, it's not necessary to attack person on the internet for having different opinion.
Have a gret day !!
Called and bought $200 bottom
Long term vision
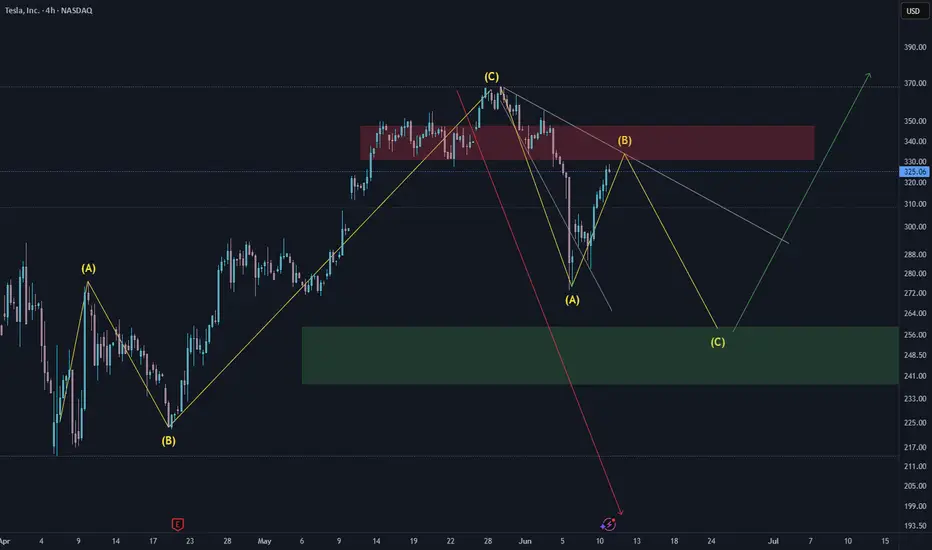
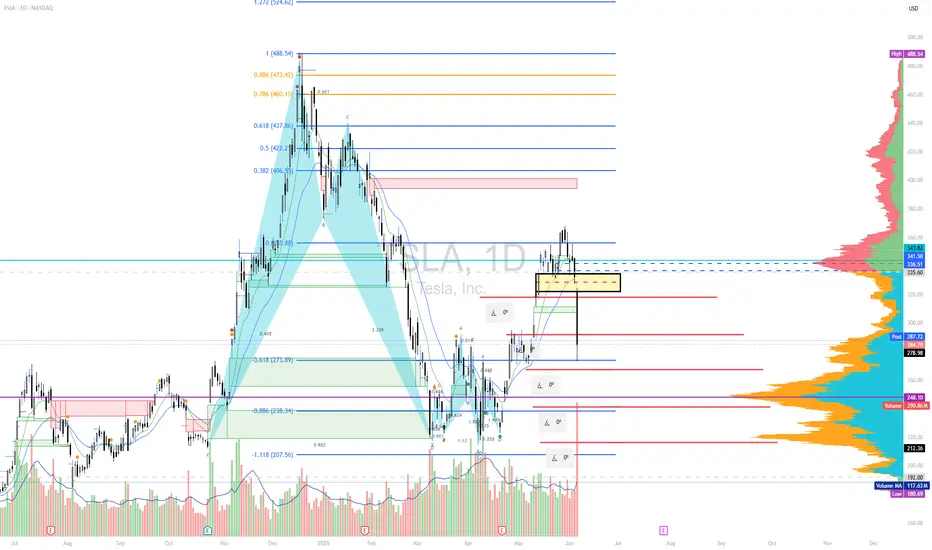
Possible retrace before upside moveThe initial upward move from 214 is corrective in nature. Since the current correction to 273 doesn't seem to be proper ABC correction, I am expecting further C wave correction to the Green box. Breaking the Red Box and the trendline with a retest will invalidate further downward correction. Based on the Major Indexes structure, I am not expecting Tesla to retrace below 213 as depicted by red line .
Note
**Disclaimer** : All details shared here is for educational purpose only. Please do your own research and consider appropriate risk management before making short term or long-term investment decisions.
Approach Market always with probabilities and make sure risk management in place.
Request your support by like, comment and follow