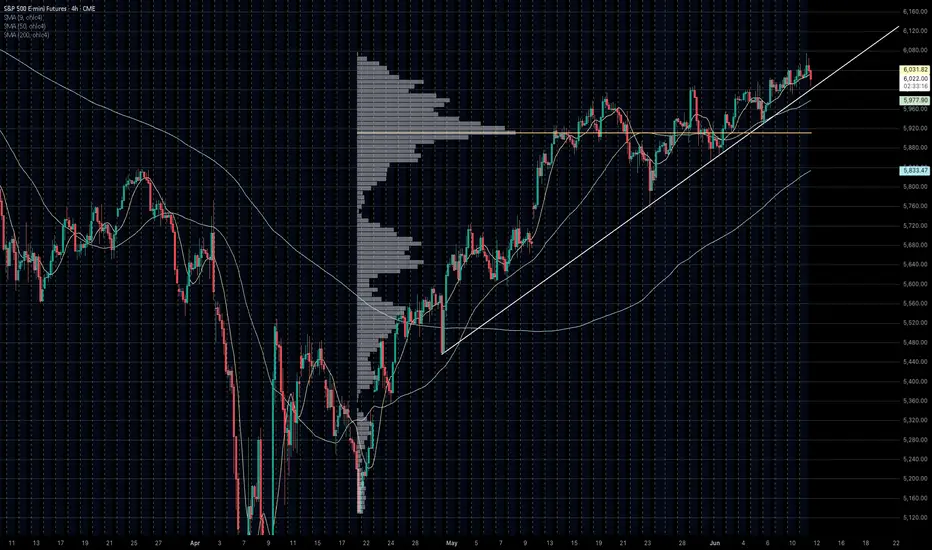
The Line in the Sand for the entire Post-Liberation Day recoverySince the market traded a double bottom two months ago on the 9th of April, it has rallied over 20% on Trump's backtracking of his foreign policy stance regarding international trade.
Throughout this rally, this trendline has proven to be the only respected structural artifact save for this fixed-range volume profile that serves as the sole area of high liquidity.
WSP1! trade ideas
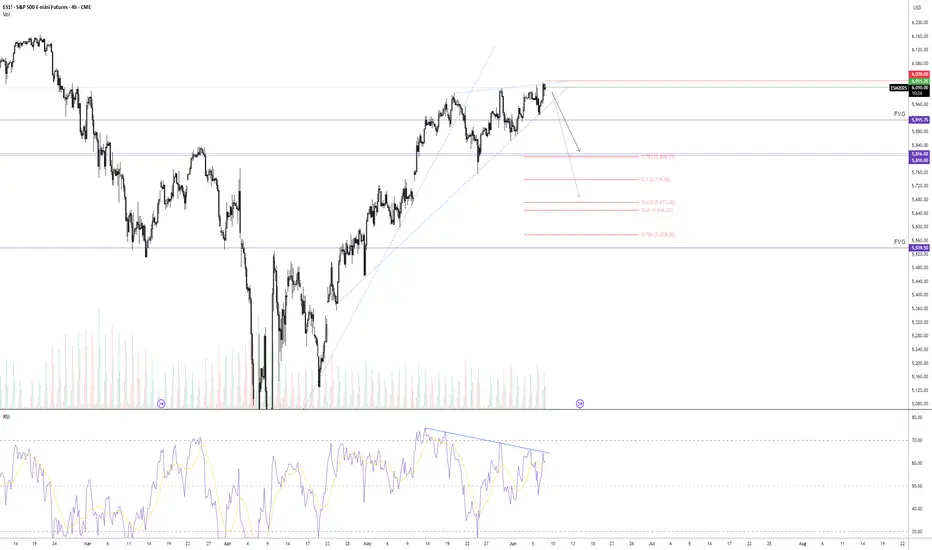
S&P – Bearish outlook, correction coming next week?A lot of chatter recently suggests traders don't trust this rally, I can see why. From both a technical and macro perspective, things are beginning to look shaky.
The S&P 500 is hovering around the psychological 6000 level, moving in and out with little conviction. The index has already broken its first upward trendline, and while it’s attempting to hold a second, momentum appears to be fading.
We’re currently seeing the formation of a rising wedge pattern. More importantly, RSI is diverging from price action, suggesting weakening momentum.
While inflation has come down from its peak, monetary policy remains tight. Rates have been high for a while now, and the effects may be surfacing.
Hiring appears to be slowing. Initial jobless claims have been ticking up for months. Challenger job cuts just spiked above 200K, a level we haven't seen since COVID or 2008.
Interestingly, the recent JOLTS report shows that job openings increased, but quits declined, perhaps suggesting workers are less confident about job-hopping?
Despite this, unemployment held steady at 4.2% today. Historically, unemployment tends to lag Challenger job cuts by a few months, so we could be in for a jump in July or August, similar to the pattern we saw last year, which caused a huge correction.
From a technical standpoint, I’ve entered a small short position here. Momentum is fading, and the wedge breakdown looks interesting. With that said, with macro uncertainty and the possibility of QE-style stimulus returning if economic data worsens, I’m cautious. We’ve seen markets rally on bad news before, especially in crisis environments, like covid times.
The CPI report next week is interesting. If inflation surprises to the upside, the bearish case strengthens. If it cools more than expected, markets might push higher before any real correction.
Interesting times going into summer.
Mean Reversion + Alternative Long Set-Up MES🔁 MES Mean Reversion Setup – Fade the Gamma Pin
• Trend Bias: Neutral-to-Bearish
• Entry Zone: $6,012–$6,016
• Stop-Loss: $6,020
• TP1 / TP2: $5,998 / $5,985
• R:R Ratio: ~1:2
• Confidence Score: 7.5/10
• Reasoning:
Price is stalling inside top of Fib zone and SpotGamma’s gamma ceiling.
Vol is crushed and mean reversion dominates without fresh upside catalyst.
Clean rejection of 6,012 area intraday offers high-conviction fade down to VWAP zones and liquidity pools under 6,000.
⚠️ Alternative Long Setup – Only on Break + Hold of 6,020
• Trend Bias: Bullish breakout continuation
• Entry Zone: $6,022–$6,025
• Stop-Loss: $6,015
• TP1 / TP2: $6,050 / $6,075
• R:R Ratio: ~1.5:1
• Confidence Score: 6.5/10
• Reasoning:
Would signal breach of gamma wall (unusual without major news).
Requires follow-through volume and tape support from HIRO or strong opening drive.
🧠 Key Notes Going Into the Week:
SPX pinned at 6,000 = no trend yet, just controlled chop.
JPM 5,905 call (June 30 expiry) still anchoring downside gamma. If MES > 6,012 holds on volume, prepare for potential chase.
Next macro catalyst: Wednesday’s CPI (6/11). Until then, expect low realized vol and grind behavior.

ES Futures-Weekly OutlookCME_MINI:ES1!
Fundamentals and Economic Calendar
Data Recap:
• Friday: 06/06/2025
o US Non-Farm Payrolls (May) 139k vs. Exp. 130k (Prev. 177k, Rev. 147k)
o US Unemployment Rate (May) 4.2% vs. Exp. 4.2% (Prev. 4.2%)
o US Average Earnings YY (May) 3.9% vs. Exp. 3.7% (Prev. 3.8%, Rev. 3.9%)
• Overnight Monday: 06/09/2025
o Chinese Trade Balance (USD)(May) 103.22B vs. Exp. 101.3B (Prev. 96.18B)
o Chinese Exports YY (USD)(May) 4.8% vs. Exp. 5.0% (Prev. 8.1%)
o Chinese Imports YY (USD)(May) -3.4% vs. Exp. -0.9% (Prev. -0.2%)
o Chinese CPI MM (May) -0.2% vs. Exp. -0.2% (Prev. 0.1%)
o Chinese PPI YY (May) -3.3% vs. Exp. -3.2% (Prev. -2.7%)
o Chinese CPI YY (May) -0.1% vs. Exp. -0.2% (Prev. -0.1%)
Looking ahead this week on the calendar, notable economic data releases are as follows:
• Wednesday: 06/11/2025
o US CPI YoY (May)
o US CPI MoM (May)
o US 10 year Note Auction
• Thursday: 06/12/2025
o US PPI MoM (May)
o US PPI YoY (May)
o US 30 year Bond Auction
• Friday: 06/13/2025
o Michigan Consumer Sentiment (Jun)P
o Michigan 1-year and 5-year Inflation Expectations (Jun)P
On the trade and tariff front, we have China-US trade talks continuing in the UK today. The Chinese Vice Premier is visiting the UK from June 8th-13th.
There has been progress made which is visible in terms of China relaxing export controls on rare earth minerals and President Trump stating that they are very far advanced on the China deal ahead of high level talks in London today.
The FED is in a blackout period until the FOMC meeting. Trade, tariffs, and geopolitical risks still need to be monitored.
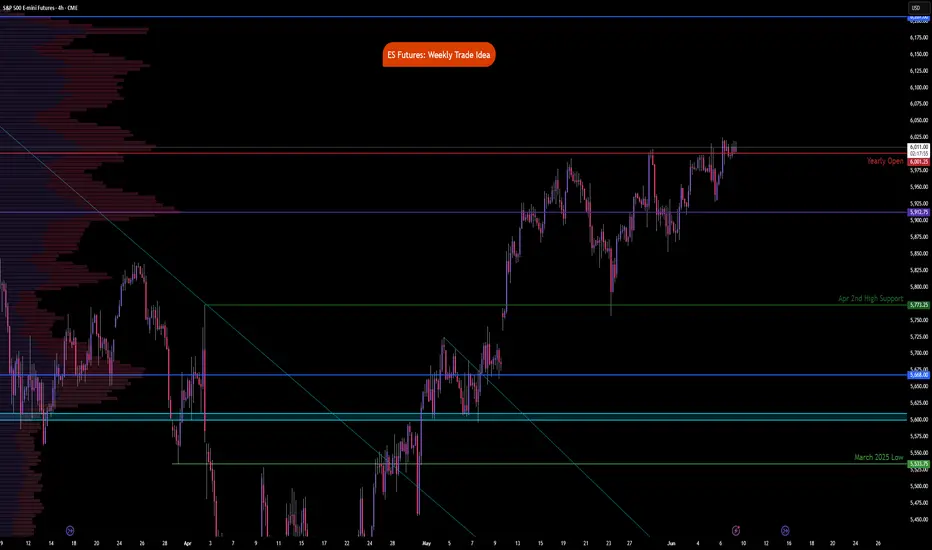
Technical:
What has the market done?
With NQ leading, ES has also reclaimed yearly open. It held above yearly open in the overnight session.
What is it trying to do?
Climb higher, overlapping bars and yearly VPOC shifting higher denote acceptance at higher prices.
How good of a job is it doing?
Overlapping bars, headline risks and leveraged positions also point towards potential for prices moving lower before resuming higher or remaining range bound. TACO acronym traders may be in for max pain.
What is more likely to happen from here?
Given the data above, we would iterate given our previous explanation that recent data including CPI, PPI, Trade imports, exports is skewed due to trade tensions and this being reflected in business and consumer behavior. FED is likely to remain on hold while it waits and averages out the impact on growth, inflation and labor market.
Scenario 1: Push higher
Prices continue to push higher, if CPI comes in lower than expected, this may prompt a short-term continuation higher.
Scenario 2: Range bound
Markets remain in wait and see mode this week having climbed above yearly open. Markets build value higher and we expect VPOC to shift higher too.
Scenario 3: Sell-off
A mix of factors could e.g., trade talks stalling, weaker than expected US 10 year and 30 year auctions could foreshadow cracks appearing in the bonds market. This may fuel a wider sell-off if yields climb back higher.
Glossary:
ES - emini-S&P 500 Futures
NQ - emini-NASDAQ 100 Futures
VPOC - Volume Point of Control: The most traded price by volume in a given range. Represents acceptance or consensus
Tiqgpt signals for today! Starting with the 1D timeframe, the S&P 500 E-mini Futures have shown a progressive upward movement, indicating a strong bullish market structure. The presence of consecutive bullish candles suggests a dominant buying interest, likely from institutional players. This upward trajectory is supported by the formation of a significant Order Block (OB) around the 5,975 level, which has not been revisited, indicating a lack of mitigation and a strong upward drive.
Drilling down to the 4H timeframe, we observe a consolidation pattern forming just below the 6,000 level, which acts as a psychological round number and potential liquidity pool. The market has made several attempts to breach this level, suggesting an accumulation of buy orders and potential preparation for a liquidity sweep above this zone.
On the 1H chart, the price action has developed a tighter range, oscillating around the 6,004 level. This consolidation near a high indicates a potential inducement zone, where smart money might be trapping retail traders into premature bearish positions before a possible upward expansion.
The 15M timeframe shows a recent Break of Structure (BOS) above the previous high at 6,004, confirming a bullish bias in the lower timeframes. This BOS is crucial as it suggests a shift in market structure favoring continued bullish momentum.
Finally, the 5M chart provides a granular view of the buying pressure. A sharp upward move followed by a small retracement forms a Fair Value Gap (FVG) around 6,004, which has not been filled, indicating that the price might revisit this area to mitigate the imbalance before continuing upwards.
INSTITUTIONAL THESIS:
The overarching smart money intent appears to be targeting the liquidity above the 6,000 level, using it as a springboard for further bullish expansion. The setup across multiple timeframes suggests a coordinated effort to induce bearish sentiment near this key psychological level, only to trap those positions and drive the price higher through a liquidity sweep.

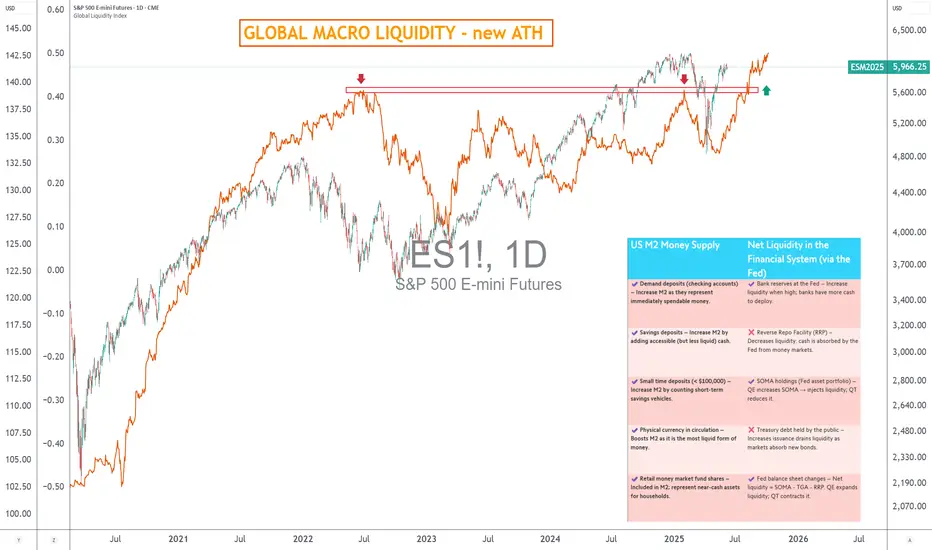
Stock market cycles & liquidity, understand it all in 3 minutesLiquidity is a key factor in market finance. Without it, risky assets in the stock market, equities and cryptocurrencies lose their fuel. Over the cycles, one thing has become clear: the direction of financial markets is strongly correlated with that of global liquidity. But liquidity is not a single indicator: it is organized into three complementary layers. Understanding these layers enables us to better anticipate major trends. Level 1 is global monetary liquidity (M2). Level 2 concerns net liquidity within the financial system, and level 3 encompasses overall macro-liquidity, through activity and credit indicators. Together, these three dimensions form the markets' “bloodstream”.
The chart below compares the S&P 500 trend with the global money supply M2
Level 1: Global monetary liquidity (global M2)
The first stage of the rocket: global M2. This monetary aggregate measures the sum of the money supply (M2) of the major economies - USA, China, Eurozone - converted into US dollars. It includes sight deposits, savings accounts and certain short-term instruments, representing the gross liquidity immediately available in the global economy.
This level of liquidity is directly influenced by monetary (key rates, QE/QT), fiscal and wage policies. The evolution of the US dollar plays a crucial role: a strong dollar mechanically reduces global M2 in USD, while a weak dollar increases it. In this respect, Chinese and American dynamics are often divergent, as they are driven by different credit logics (centralized planning on the Chinese side, rate-based adjustment on the US side).
But beyond the absolute level, it is above all the momentum of M2, its first derivative (annual variation), that serves as a compass. An uptrend coupled with positive momentum strongly favours risky assets. Conversely, stagnation or a negative divergence between trend and momentum (as at the end of 2021) anticipates a contraction in valuations. Over this cycle, there is even a correlation coefficient of 0.80 between global M2 and Bitcoin, projected 12 weeks into the future: liquidity leads, markets follow.
Level 2: Net liquidity of the financial system
The second level is more subtle, but just as decisive: net liquidity within the financial system. This is the effective credit capacity, i.e. the funds actually available to irrigate the real economy after withdrawals, excess reserves and regulatory mechanisms. Unlike M2, this measure does not reflect gross liquidity, but rather the liquidity “actionable” by financial institutions.
In the United States, this net liquidity depends, among other things, on FED mechanisms such as the reverse repo program (RRP), which temporarily sucks in or releases liquidity, and on the level of banks' excess reserves. Its evolution is strongly linked to the central bank's restrictive or accommodating monetary policy, QE cycles and QT cycles.
The correlation of this net liquidity with the S&P 500 and Bitcoin, although slightly lower than that of global M2, remains significant. It acts as a filter for gross liquidity: even if M2 is high, if credit capacity is blocked by excessively high rates or constrained reserves, the impact on markets can be neutralized.
Level 3: Global macro liquidity
Finally, the third level: global macro liquidity. It includes barometers of economic conditions that directly influence risk perception and investor appetite: PMI indices (manufacturing and services), credit conditions, employment levels, default rates, etc. It is less monetary, more conjunctural. It is less monetary, more cyclical, but its impact is real, as it shapes the context in which financial liquidity is expressed.
It is this level that contextualizes the first two: a rising M2 in a deteriorating economic environment (PMI below 50, falling employment) may have a limited effect. Conversely, signs of economic recovery may reinforce the transmission of liquidity to the markets. In this sense, the timing of the FED's rate cuts becomes a key macro catalyst. As long as US policy remains restrictive, M2 will plateau and net liquidity will remain constrained, even if the ECB or PBoC relax their conditions.
Conclusion: Global liquidity cannot be summed up in a single indicator. It's an ecosystem structured on three levels: global gross liquidity (M2), effective credit capacity (ECC) and net liquidity.
DISCLAIMER:
This content is intended for individuals who are familiar with financial markets and instruments and is for information purposes only. The presented idea (including market commentary, market data and observations) is not a work product of any research department of Swissquote or its affiliates. This material is intended to highlight market action and does not constitute investment, legal or tax advice. If you are a retail investor or lack experience in trading complex financial products, it is advisable to seek professional advice from licensed advisor before making any financial decisions.
This content is not intended to manipulate the market or encourage any specific financial behavior.
Swissquote makes no representation or warranty as to the quality, completeness, accuracy, comprehensiveness or non-infringement of such content. The views expressed are those of the consultant and are provided for educational purposes only. Any information provided relating to a product or market should not be construed as recommending an investment strategy or transaction. Past performance is not a guarantee of future results.
Swissquote and its employees and representatives shall in no event be held liable for any damages or losses arising directly or indirectly from decisions made on the basis of this content.
The use of any third-party brands or trademarks is for information only and does not imply endorsement by Swissquote, or that the trademark owner has authorised Swissquote to promote its products or services.
Swissquote is the marketing brand for the activities of Swissquote Bank Ltd (Switzerland) regulated by FINMA, Swissquote Capital Markets Limited regulated by CySEC (Cyprus), Swissquote Bank Europe SA (Luxembourg) regulated by the CSSF, Swissquote Ltd (UK) regulated by the FCA, Swissquote Financial Services (Malta) Ltd regulated by the Malta Financial Services Authority, Swissquote MEA Ltd. (UAE) regulated by the Dubai Financial Services Authority, Swissquote Pte Ltd (Singapore) regulated by the Monetary Authority of Singapore, Swissquote Asia Limited (Hong Kong) licensed by the Hong Kong Securities and Futures Commission (SFC) and Swissquote South Africa (Pty) Ltd supervised by the FSCA.
Products and services of Swissquote are only intended for those permitted to receive them under local law.
All investments carry a degree of risk. The risk of loss in trading or holding financial instruments can be substantial. The value of financial instruments, including but not limited to stocks, bonds, cryptocurrencies, and other assets, can fluctuate both upwards and downwards. There is a significant risk of financial loss when buying, selling, holding, staking, or investing in these instruments. SQBE makes no recommendations regarding any specific investment, transaction, or the use of any particular investment strategy.
CFDs are complex instruments and come with a high risk of losing money rapidly due to leverage. The vast majority of retail client accounts suffer capital losses when trading in CFDs. You should consider whether you understand how CFDs work and whether you can afford to take the high risk of losing your money.
Digital Assets are unregulated in most countries and consumer protection rules may not apply. As highly volatile speculative investments, Digital Assets are not suitable for investors without a high-risk tolerance. Make sure you understand each Digital Asset before you trade.
Cryptocurrencies are not considered legal tender in some jurisdictions and are subject to regulatory uncertainties.
The use of Internet-based systems can involve high risks, including, but not limited to, fraud, cyber-attacks, network and communication failures, as well as identity theft and phishing attacks related to crypto-assets.
ES - LONG @ London OpenBuyers from 6000 options level, floor. We've got weak liq. above to squeeze. After London open FIND on smaller timeframes the auction/finished business (risk) and test of pivot/poc (entry)


06/18/25 Trade Journal, and ES_F Stock Market analysis
EOD accountability report: +521.25
Sleep: 5 hours (bad sleep)
Overall health: My Ultrahuman Ring is saying I might be getting sick. 9 need to recover sleep and take care of body today and tmr. I think my lack of exercise this week is catching up to me.
**What was my initial plan? **
Looking at things premarket, things looked a bit weak as it was about sell off in the morning with bearish structure and DHC. Went in for a short at 1 min MOB but it didn't react and just broke thru, so flipped to bullish side and took it to the next resistance.
overall plan for the day was to look for chop zones to scalp b4 fomc, but that actually didnt happen until after fomc.
** VX Algo System Signals from (9:30am to 2pm)** 4/5
— 9:50 AM Market Structure flipped bullish on VX Algo X3! :check:
— 10:52 AM VXAlgo ES X1 Sell Signal :check:
— 12:10 PM VXAlgo ES X1 Buy signal (Double signal) :x:
— 12:11 PM Market Structure flipped bearish on VX Algo X3! :check:
— 1:40 PM VXAlgo ES X1 Buy signal (Double signal) :check:
Next day plan--> Above 6015 = Bullish, Under 6005= Bearish

Inside day for ThursdayWith the shortened trading session in the S&P 500, the expectation is that Thursday will trade within Wednesday's range.


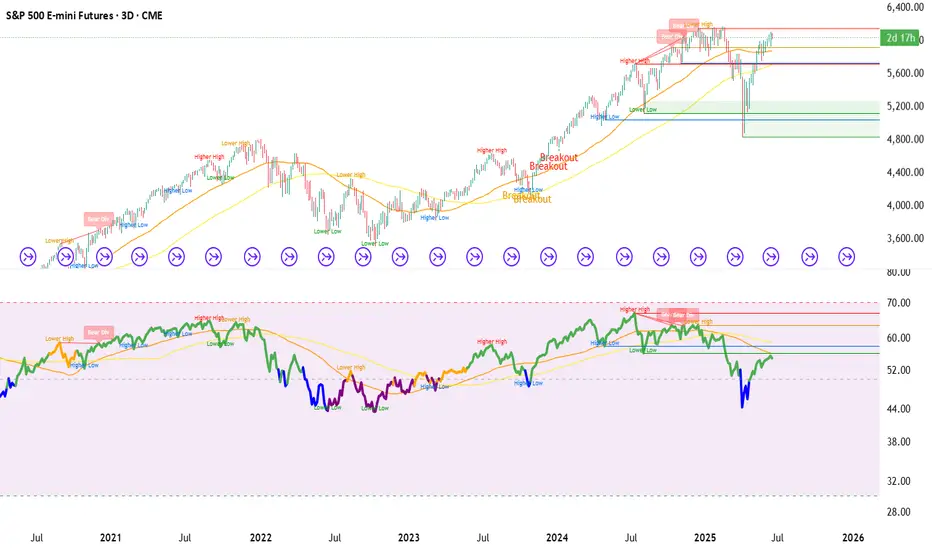
ES1! Futures
Looking at the 3D ES futures. Does it look bullish? Will it make ATH? Just look at that RSI!
Sellers have returnedSellers have returned to the daily chart in the S&P 500 on Tuesday. The expectation for this type of structure is further movement to the downside but without fundamentals driving the market a smaller range lower is expected for Wednesday.

06/17/25 Trade Journal, and ES_F Stock Market analysisEOD accountability report: +1,337.50
Sleep: 9 hours
Overall health: Good, was averaging 40k steps the week before, now around 20k avg,
need to get it up to 25k steps min per week.
**What was my initial plan? **
Went into the market pretty neutral today with the mindset that it should be the calm before storm (fomc tomorrow), There was a string defense of 1 min MOB in the morning and that gave me the belief that early part of the day was going to be bullish so i took a few stabs at support and made my money.
** VX Algo System Signals from (9:30am to 2pm)** 4/4
— 9:34 AM Market Structure flipped bullish on VX Algo X3! :check:
— 10:30 AM VXAlgo ES X1 Sell Signal (double signal) :check:
— 11:36 AM VXAlgo ES X3 Sell Signal (double signal) :check:
— 1:00 PM Market Structure flipped bearish on VX Algo X3! :check:
Next day plan--> Above 6015 = Bullish, Under 6005= Bearish
Video Recaps -->https://tradingview.sweetlogin.com/u/WallSt007/#published-charts

06/16/25 Trade Journal, and ES_F Stock Market analysisEOD accountability report: +450
Sleep: 7 hours
Overall health: Good
What was my initial plan? I knew today was contract rollovers and decided not to trade it, but after noticing that the x1 signals were working pretty good today, i decided to take some plays at the soft support and resistances.
**Daily Trade recap based on VX Algo System from (9:30am to 2pm)**
Lot of X7 buy signals (usual signal that market is bullish)
— 10:40 AM VXAlgo ES X1 Sell Signal (triple signal)
— 11:56 AM VXAlgo ES X3 Sell Signal
— 12:30 PM Market Structure flipped bearish on VX Algo X3!
— 1:20 PM VXAlgo ES X1 Buy signal
Next day plan--> Above 6010 = Bullish, Under 5965= Bearish
Video Recaps -->https://tradingview.sweetlogin.com/u/WallSt007/#published-charts

S&P Sellers got LIQUIDATED we are Bullish again.Good day Trader :)
Here’s another market breakdown for you, focusing on the S&P futures and where I believe this week's candlestick is likely to expand.
Late last week (Wednesday), I mentioned the potential for a retracement, not a reversal , and at the start of this week, we saw exactly that. Sellers were quickly liquidated, and the market has resumed its bullish momentum.
Looking ahead, my expectation is for price to expand toward the 6,075 level.
In this analysis, I’ll walk you through a quick review of last week’s price action and provide an in-depth breakdown of why I believe this target is within reach.
Let’s dive in... OneCandlestickAtATime
Referenced Idea

MES Long - HVN, RejectionMES long trade idea.
Price went down after heat up of middle east conflict between Iran and Israel.
Rallied slowly afterwards for the whole day and created a HVN near the bottom.
I can think of a revisit of that area and a bounce to the upside.
Since the conflict is heating up further my risk will be reduced, and depending on the market open and a possible gap the idea might be invalid.

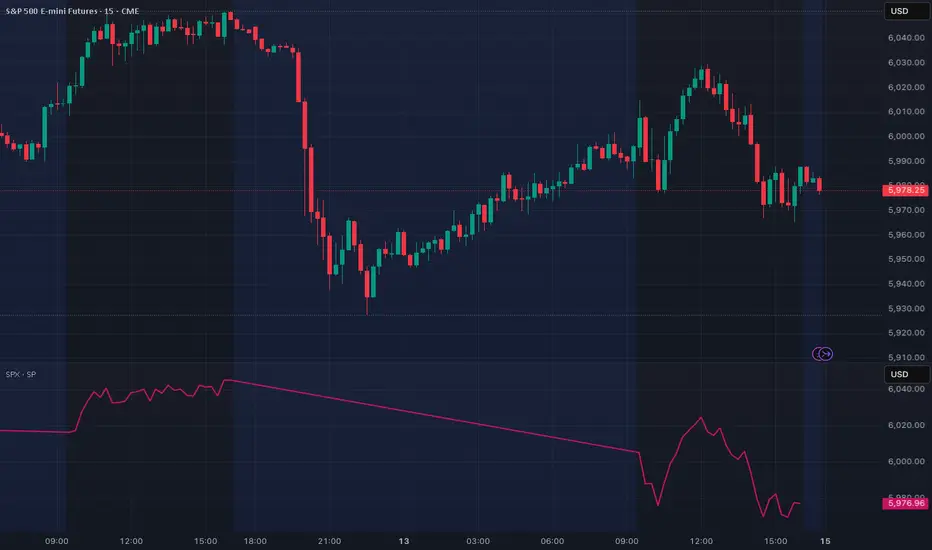
SPX Futures - Sunday Night Must Watch (bookmark this chart)This chart displays the price action of the S&P 500 E-mini Futures (ES), a stock market index futures contract that is traded on the Chicago Mercantile Exchange's Globex electronic trading platform. The S&P 500 index is a capitalization-weighted index that tracks 500 of the largest U.S. companies, making it a key benchmark for the overall health of the U.S. economy and stock market. This particular chart visualizes the ongoing battle between buyers and sellers, with the candlesticks representing the open, high, low, and close prices for each period. By analyzing the patterns and trends on this chart, traders and investors can speculate on the future direction of the S&P 500 index. This analysis is often supplemented with various technical indicators that can provide further insights into market momentum, volatility, and potential turning points. Lower pane is the actual SPX which will be live only during market hours.
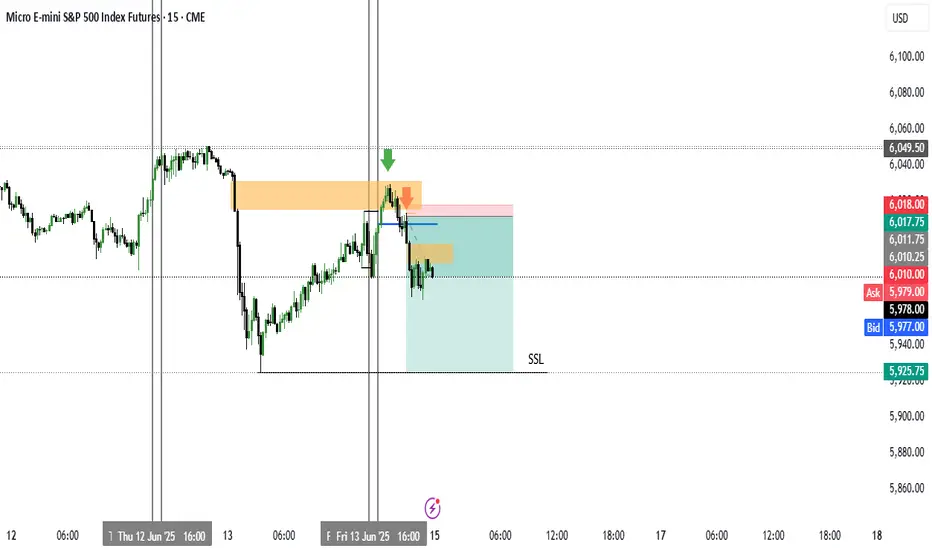
SHORT SP500fundamental : negative dollar
Techniq: respecting 15M BEARISH GAP
OB = BB
SSL still not taken
Over 450 ticks gone: S&P 500 Plunges ahead of today's key dataThe S&P 500, in the session reset following the U.S. market close, has begun a sharp downward move, dropping nearly 2% and more than 450 ticks. The decline has been so steep that it wiped out the entire bullish effort from last Friday, June 6th, when it surged strongly from the 5970 level. Today, the most important data point on the agenda is consumer sentiment, which is scheduled to be released at 10:00 AM EST.
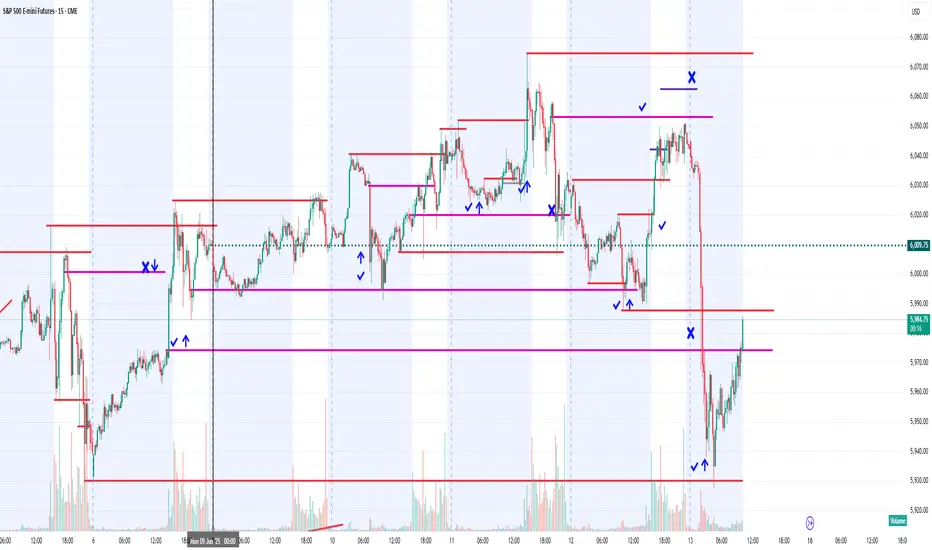
MES1! - Pivots are still Intact We remain bullish on ES till the pivots are intact. Any knee-jerk reaction is an opportunity to accumulate.

06/12/25 Trade Journal, and ES_F Stock Market analysisEOD accountability report: +437.50
Sleep: 6.5 hours
Overall health: Good
What was my initial plan?
market pumped heavily due to ppi data so I decided today was another oe of those days where you wait on the sideline for a better move.
1. until major levels are hit.
2. or a signal occur.
**Daily Trade recap based on VX Algo System from (9:30am to 2pm)**
10:57 AM VXAlgo ES X1 Sell Signal
2:00 PM VXAlgo NQ X3 Sell Signal
Next day plan--> Above 6010 = Bullish, Under 5950= Bearish
Video Recaps -->https://tradingview.sweetlogin.com/u/WallSt007/#published-charts

06/11/25 Trade Journal, and ES_F Stock Market analysis
EOD accountability report: +1200
Sleep: 7 hours
Overall health: Good
What was my initial plan?
Did not wanted to trade the market today unless we had multiple signals and confirmations because CPI data had already moved the market so much.
Daily Trade recap based on VX Algo System from (9:30am to 2pm)
— 10:00 AM Market Structure flipped bearish on VX Algo X3!
— 10:00 AM VXAlgo NQ X1 Buy Signal,
— 10:30 AM Market Structure flipped bullish on VX Algo X3!
— 11:08 AM VXAlgo ES X1 Sell Signal (double signal)
— 11:48 AM VXAlgo ES X3 Sell Signal
— 12:00 PM Market Structure flipped bearish on VX Algo X3!
— 12:30 PM VXAlgo ES X1 Buy signal (double signal)
— 1:35 PM Market Structure flipped bullish on VX Algo X3!
Next day plan--> Above 6000 = Bullish, Under 5990 = Bearish
Video Recaps -->https://tradingview.sweetlogin.com/u/WallSt007/#published-charts
