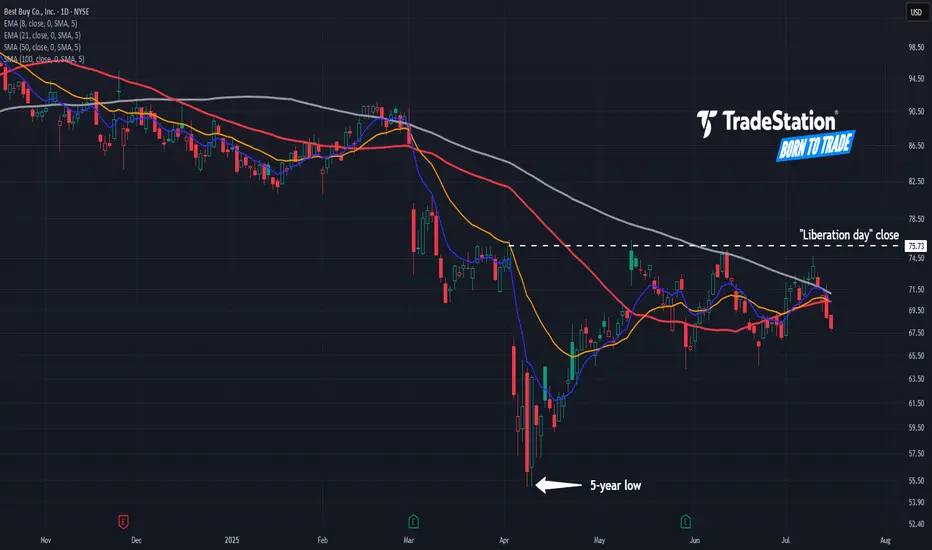
Best Buy’s Lower HighsBest Buy fell sharply on “Liberation Day.” Now, after a modest rebound, some traders may see further downside risk.
The first pattern on today’s chart is July 10’s peak of $74.75. That was below the June high, which in turn was under May’s high. Such a succession of lower highs could indicate a bearish trend.
The potential topping behavior is also happening below the close on April 2, immediately before President Trump announced aggressive tariffs.
Third, prices are stalling near the 50- and 100-day simple moving averages. That may reflect a bearish long-term trend.
Finally, the retailer has returned below its 8- and 21-day exponential moving averages. That may suggest short-term trends have gotten more bearish as well.
TradeStation has, for decades, advanced the trading industry, providing access to stocks, options and futures. If you're born to trade, we could be for you. See our Overview for more.
Past performance, whether actual or indicated by historical tests of strategies, is no guarantee of future performance or success. There is a possibility that you may sustain a loss equal to or greater than your entire investment regardless of which asset class you trade (equities, options or futures); therefore, you should not invest or risk money that you cannot afford to lose. Online trading is not suitable for all investors. View the document titled Characteristics and Risks of Standardized Options at www.TradeStation.com . Before trading any asset class, customers must read the relevant risk disclosure statements on www.TradeStation.com . System access and trade placement and execution may be delayed or fail due to market volatility and volume, quote delays, system and software errors, Internet traffic, outages and other factors.
Securities and futures trading is offered to self-directed customers by TradeStation Securities, Inc., a broker-dealer registered with the Securities and Exchange Commission and a futures commission merchant licensed with the Commodity Futures Trading Commission). TradeStation Securities is a member of the Financial Industry Regulatory Authority, the National Futures Association, and a number of exchanges.
TradeStation Securities, Inc. and TradeStation Technologies, Inc. are each wholly owned subsidiaries of TradeStation Group, Inc., both operating, and providing products and services, under the TradeStation brand and trademark. When applying for, or purchasing, accounts, subscriptions, products and services, it is important that you know which company you will be dealing with. Visit www.TradeStation.com for further important information explaining what this means.
BBY trade ideas
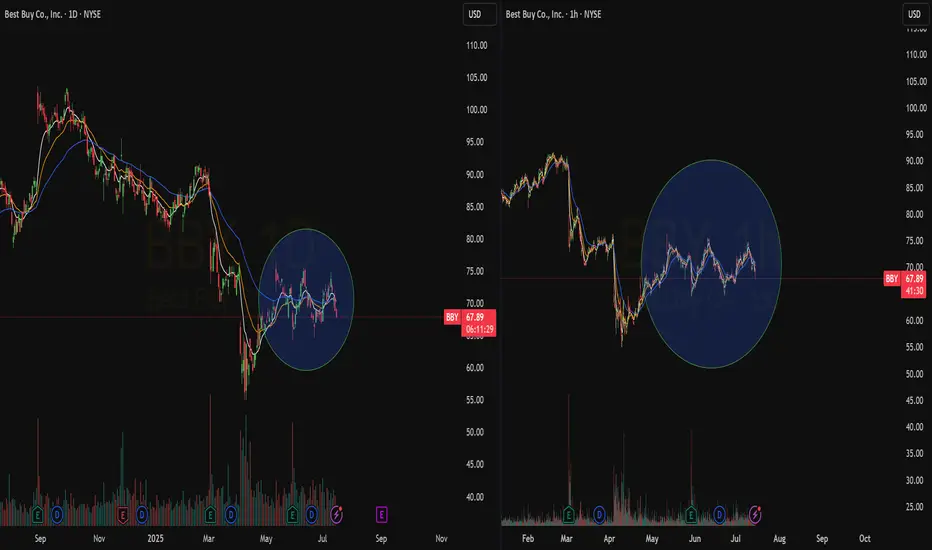
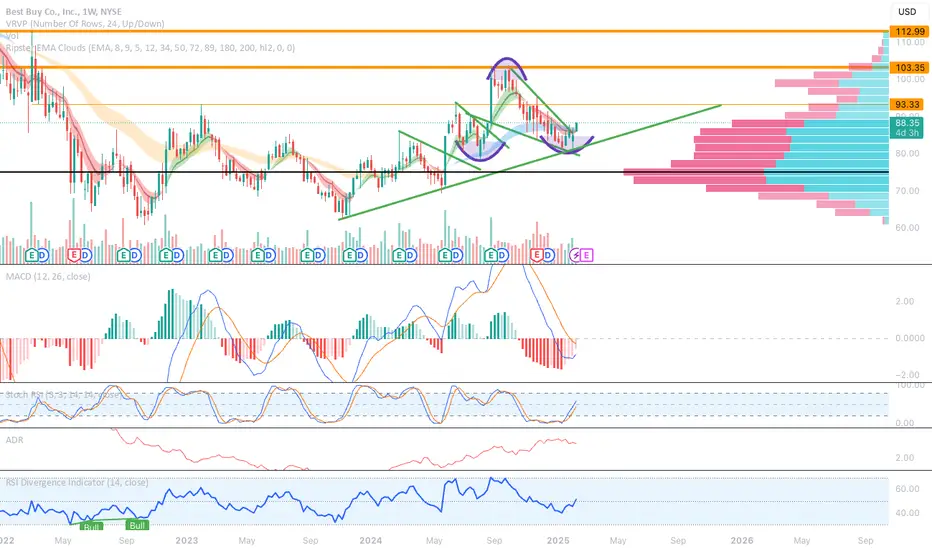
Quick View: $BBY- Both the TF are showing a strong consolidation area after a deep pullback. Volume is still there.
Ready to catch the action.
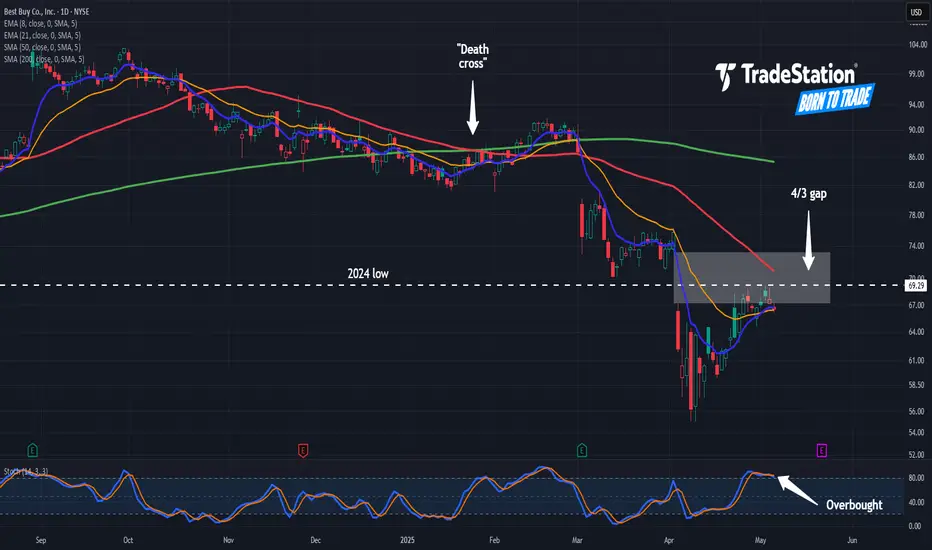
Best Buy Bounces Toward GapBest Buy has rebounded from last month’s sharp drop, but some traders may expect another push to the downside.
The first pattern on today’s chart is the price zone between $67.16 and $73.28. That matches the bearish price gap on April 3, one day after hefty tariffs were announced.
The electronics retailer’s recent peak has also occurred at its trough last May, which was the low for all of 2024. Has old support become new resistance?
Next, the stochastic oscillator is turning down from an overbought condition.
Third, BBY is near its 21-day exponential moving average. Slipping below it could suggest the short-term direction is getting less bullish.
Finally, the 50-day simple moving average (SMA) had a “death cross” below the 200-day SMA in January and has remained there since. Such an alignment may be consistent with a longer-term downtrend.
TradeStation has, for decades, advanced the trading industry, providing access to stocks, options and futures. If you're born to trade, we could be for you. See our Overview for more.
Past performance, whether actual or indicated by historical tests of strategies, is no guarantee of future performance or success. There is a possibility that you may sustain a loss equal to or greater than your entire investment regardless of which asset class you trade (equities, options or futures); therefore, you should not invest or risk money that you cannot afford to lose. Online trading is not suitable for all investors. View the document titled Characteristics and Risks of Standardized Options at www.TradeStation.com . Before trading any asset class, customers must read the relevant risk disclosure statements on www.TradeStation.com . System access and trade placement and execution may be delayed or fail due to market volatility and volume, quote delays, system and software errors, Internet traffic, outages and other factors.
Securities and futures trading is offered to self-directed customers by TradeStation Securities, Inc., a broker-dealer registered with the Securities and Exchange Commission and a futures commission merchant licensed with the Commodity Futures Trading Commission). TradeStation Securities is a member of the Financial Industry Regulatory Authority, the National Futures Association, and a number of exchanges.
TradeStation Securities, Inc. and TradeStation Technologies, Inc. are each wholly owned subsidiaries of TradeStation Group, Inc., both operating, and providing products and services, under the TradeStation brand and trademark. When applying for, or purchasing, accounts, subscriptions, products and services, it is important that you know which company you will be dealing with. Visit www.TradeStation.com for further important information explaining what this means.
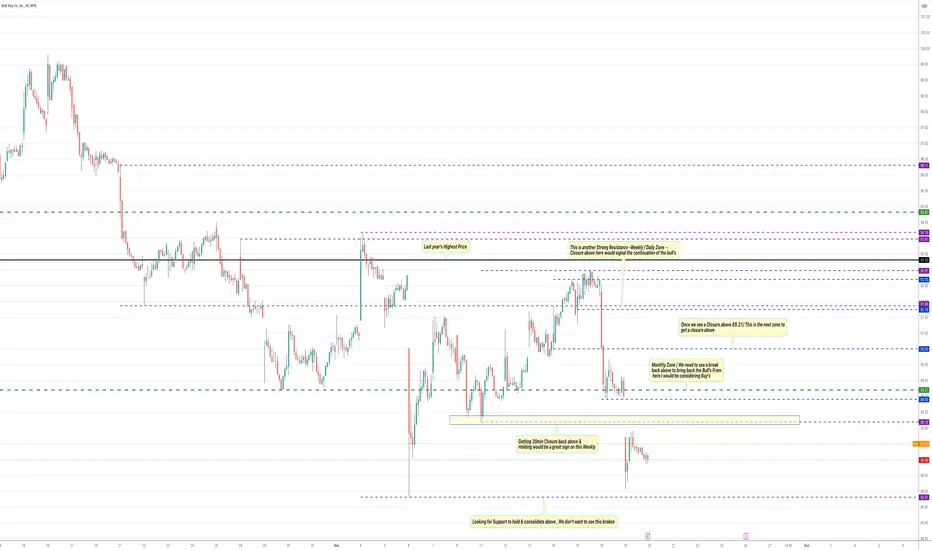
BBY Possible Play's Again my cus trades stocks so I figured I would post what I charted up for him. When looking at possible play's you will need to go down to a 2min time frame to get your entries. With the gaps in these stocks it can be difficult to find entries with so much missing data. maybe I don't pay enough to see it . I cannot post lower time frames and zones but set up 30min wick highs / lows -zones 3 candles back and you will see the support and resistance
BBY Best Buy= Best ShortShort from pattern.
Short on 85,50
SL 88,26
TP 74 (50%) , 70 (50%)
P/L = 1/4
Not financial recomendation.
Do on your own risk.

When to buy BBYBest Buy (BBY) has just broken out of the base it established back in November 2022. The reaction to the most recent earnings is strong and yesterday June 4th 2024, BBY hit the same high from February 2023.
Idea 1: It can blow through this line top line and continue its climb. If this is the case, I will likely get in when there is a short (a few days to a week or so) pullback into the moving averages.
Idea 2: If it resets a little more, I will look buy once it establishes a base at one of my other support/resistance lines I have marked on here as 1 and 2. I want to see the 200SMA rising in this scenario and the price has to remain above it.
When to abort this idea: If BBY breaks down and doesn't hold above the 200SMA.

best buy potential longyou know ive been seeing chatter about this ticker more than usual. I know best buy is a consolidation nightmare but i see a trade. Break and entry would be 101. The anchored vwap shows a switch of trend and it can be used to ensure momentum is ensuing and the trade is going well. Also eventually there will have to be a way for consumers to purchase a.i gadgets, so like who already has presence in that space?
BBY shortI am bearish for BBY as I see potential bearish pattern here and multiple top. I expect to fall down for BBY

Best Buy Breakout?Best Buy has moved sideways since December, but some traders may expect a breakout soon.
The first pattern on today’s chart is the pair of falling trendlines. One ran along the highs of July and December, which BBY crossed in late February. A second along the March highs was broken this week. That may suggest downward pressure is fading in the retailer.
Second, the 50-day simple moving average (SMA) had a “golden cross” above the 200-day SMA early last month. That may reflect bullishness over the longer term.
Third, the 8-day exponential moving average (EMA) has remained above the 21-day EMA since mid-February. MACD is also turning positive. Those signals may reflect bullishness over the shorter term.
Fourth, Bollinger Bandwidth in the bottom study shows tight price action. Does that create potential for expansion if a breakout occurs?
Finally, the retailer ended Thursday above $79.52. It had been the highest close after February 29’s strong earnings report. Remaining above that level and the falling trendlines could potentially confirm a breakout.
TradeStation has, for decades, advanced the trading industry, providing access to stocks, options and futures. See our Overview for more.
Past performance, whether actual or indicated by historical tests of strategies, is no guarantee of future performance or success. There is a possibility that you may sustain a loss equal to or greater than your entire investment regardless of which asset class you trade (equities, options or futures); therefore, you should not invest or risk money that you cannot afford to lose. Online trading is not suitable for all investors. View the document titled Characteristics and Risks of Standardized Options at www.TradeStation.com . Before trading any asset class, customers must read the relevant risk disclosure statements on www.TradeStation.com . System access and trade placement and execution may be delayed or fail due to market volatility and volume, quote delays, system and software errors, Internet traffic, outages and other factors.
Securities and futures trading is offered to self-directed customers by TradeStation Securities, Inc., a broker-dealer registered with the Securities and Exchange Commission and a futures commission merchant licensed with the Commodity Futures Trading Commission). TradeStation Securities is a member of the Financial Industry Regulatory Authority, the National Futures Association, and a number of exchanges.
TradeStation Securities, Inc. and TradeStation Technologies, Inc. are each wholly owned subsidiaries of TradeStation Group, Inc., both operating, and providing products and services, under the TradeStation brand and trademark. When applying for, or purchasing, accounts, subscriptions, products and services, it is important that you know which company you will be dealing with. Visit www.TradeStation.com for further important information explaining what this means.

BBY | Time to Ride Higher | LONGBest Buy Co., Inc. engages in the provision of consumer technology products and services. It operates through two business segments: Domestic and International. The Domestic segment includes operations in all states, districts, and territories of the U.S., operating under various brand names, including Best Buy, Best Buy Mobile, Geek Squad, Magnolia Audio Video, Napster, and Pacific Sales. The International segment is made up of all operations outside the U.S. and its territories, including Canada, Europe, China, Mexico, and Turkey. It also markets its products under the brand names: Best Buy, bestbuy.com, Best Buy Direct, Best Buy Express, Best Buy Mobile, Geek Squad, GreatCall, Magnolia and Pacific Kitchen and Home. The company was founded by Richard M. Schulze in 1966 and is headquartered in Richfield, MN.

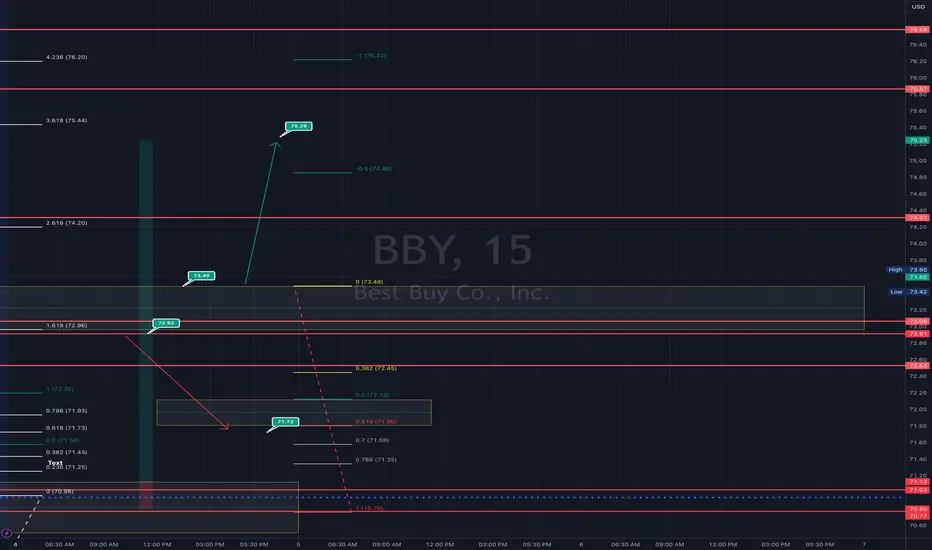
$BBY Gameplan Dec 4 ! NYSE:BBY Long above 73.49 , Short Below 72.92! - Continuation play Day 2 on Upbeat Retail Sales! Let's See! @everyone
Here's a breakdown of the expectations and my analysis for Best Buy Co Inc ( NYSE:BBY ) for the upcoming trading day on Monday, the 4th:
Opening Price: Expected to open at $72.57.
Expected Price Range: Anticipated to fluctuate between $71.47 and $75.37, based on a 14-day Average True Range, indicating a potential trading interval of +/- $1.95 (+/- 2.65%) up or down from the last closing price.
Potential Intraday Movement: If the full calculated possible swing range is realized, there might be an estimated 5.31% move between the lowest and highest trading prices during the day.
Support and Resistance Levels: Closer to resistance at $73.45 (0.04%) than support at $68.11 (7.23%), which might not present an attractive intra-day risk/reward ratio. Waiting for the stock to approach the support level might be prudent.
Insider Trading Activity: Insiders are observed to be selling more shares (1.15 million) than buying (701.88 thousand) in the last 100 trades. This trend of insider selling is generally considered a negative signal.
Is NYSE:BBY a Buy? While there are some positive signals, the analysis doesn't suggest NYSE:BBY as a buy candidate. At the current level, it's suggested to consider it as a hold candidate, waiting for further developments before making significant moves.
Remember, these analyses are based on historical data and indicators and might not guarantee future stock movements. Always consider your risk tolerance and do further research or consult a financial advisor before making investment decisions.
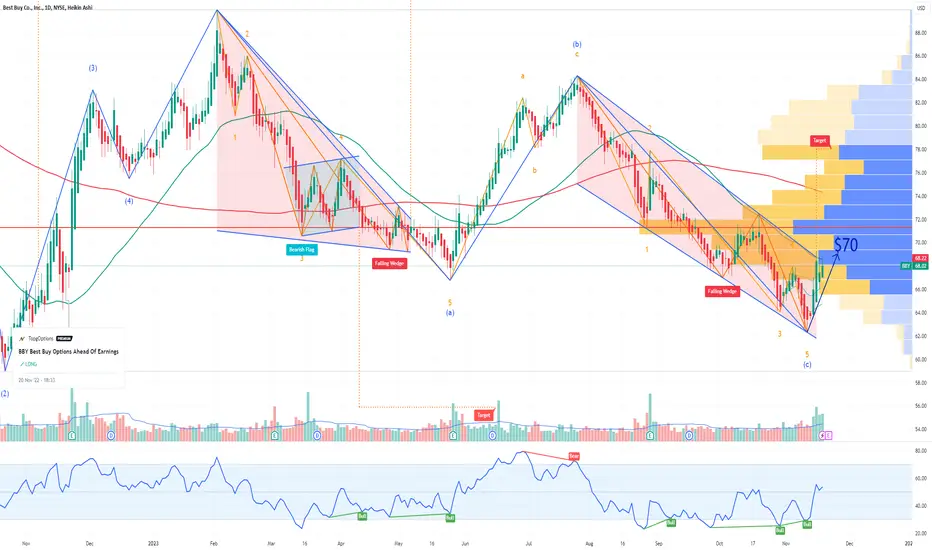
BBY Best Buy Options Ahead of EarningsIf you haven`t bought BBY here:
Then analyzing the options chain and the chart patterns of RUM Rumble prior to the earnings report this week,
I would consider purchasing the 70usd strike price Calls with
an expiration date of 2024-1-19,
for a premium of approximately $2.72.
If these options prove to be profitable prior to the earnings release, I would sell at least half of them.
Looking forward to read your opinion about it.
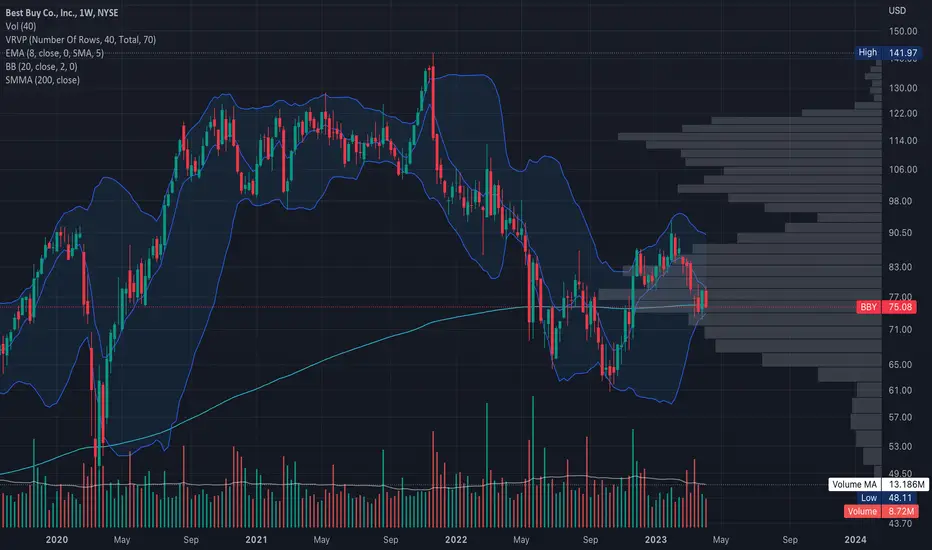
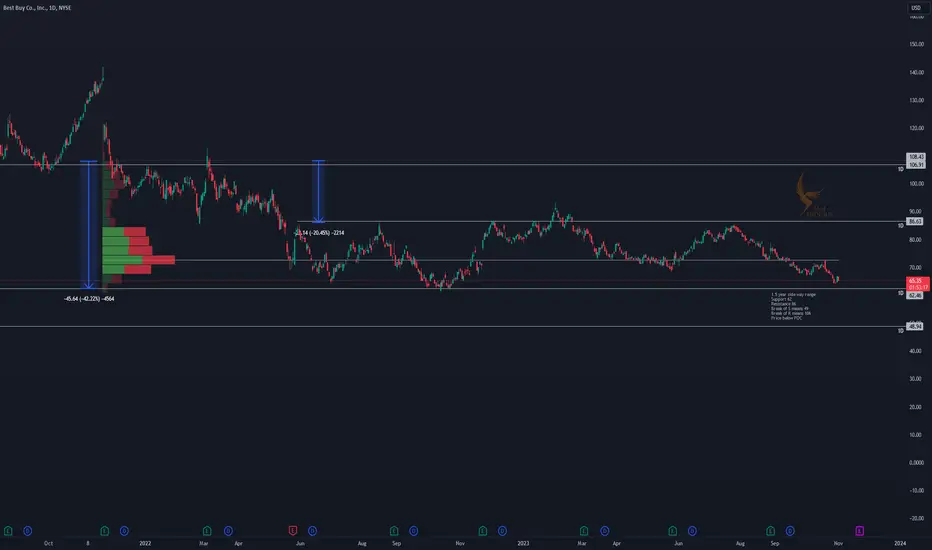
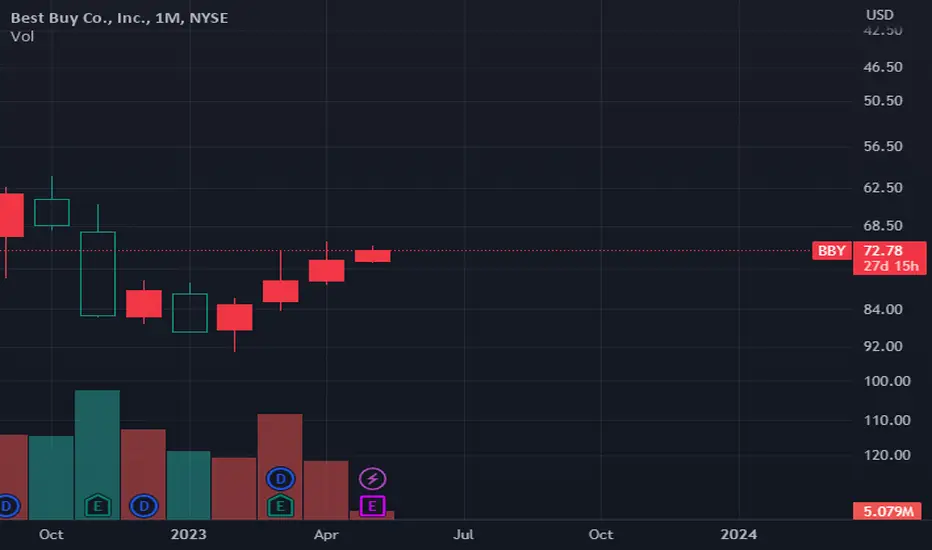
BBY daily analysis1.5 year side way range
Support 62
Resistance 86
Break of S means 49
Break of R means 106
Price below POC
BestBuy play the bounceHi traders
Let's have a lookg at BBY
BestBuy looks interesting
The price reached the buy area and we are seeing a reaction.
The stock is still in a downtrend but entering a long position at the key support and playing a bounce towards the downsloping resistance is reasonable idea.
What do you think?
Do you agree?

BBY Best Buy Co Options Ahead of EarningsIf you haven`t bought BBY here:
Then analyzing the options chain and the chart patterns of BBY Best Buy Co prior to the earnings report this week,
I would consider purchasing the 77.50usd strike price Calls with
an expiration date of 2024-6-21,
for a premium of approximately $3.80.
If these options prove to be profitable prior to the earnings release, I would sell at least half of them.
Looking forward to read your opinion about it.

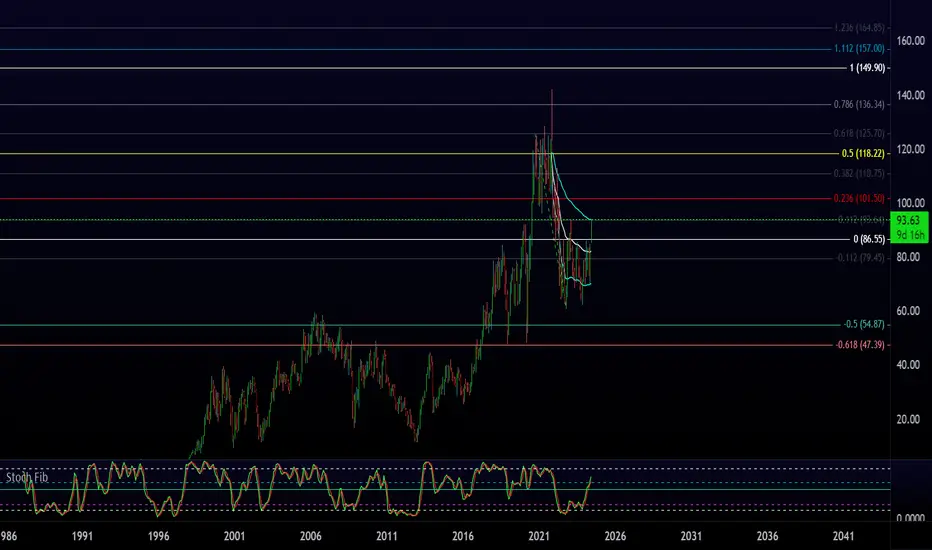
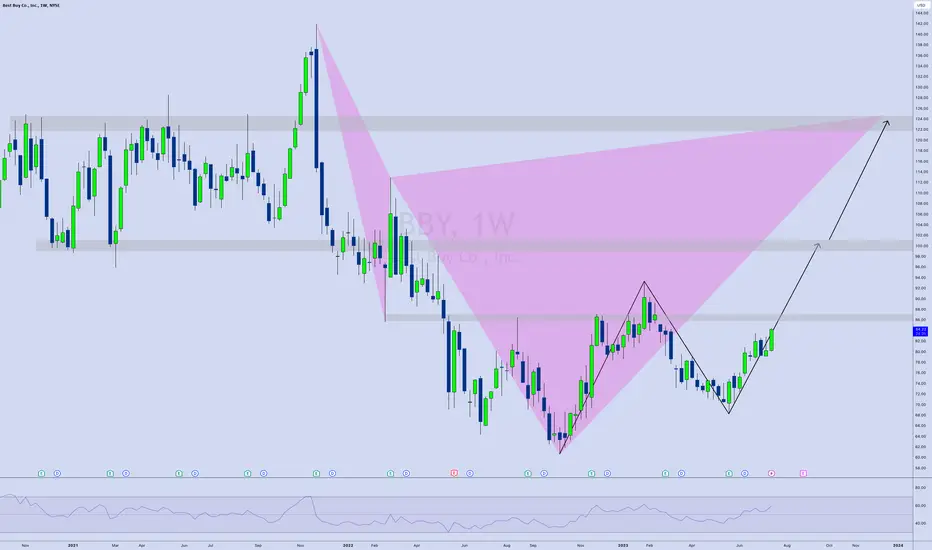
$BBY | Potential Harmonic FormationBest Buy NYSE:BBY potential harmonic pattern completion
Harmonic completes around $120
Other notable levels around $85 and $100
Bearish Alert : BBYNew Bearish alert popped out at $84 where it seems the price found a new resistance after the last long run.
Pullback or new bearish wave ?
Let's wait for the combo.
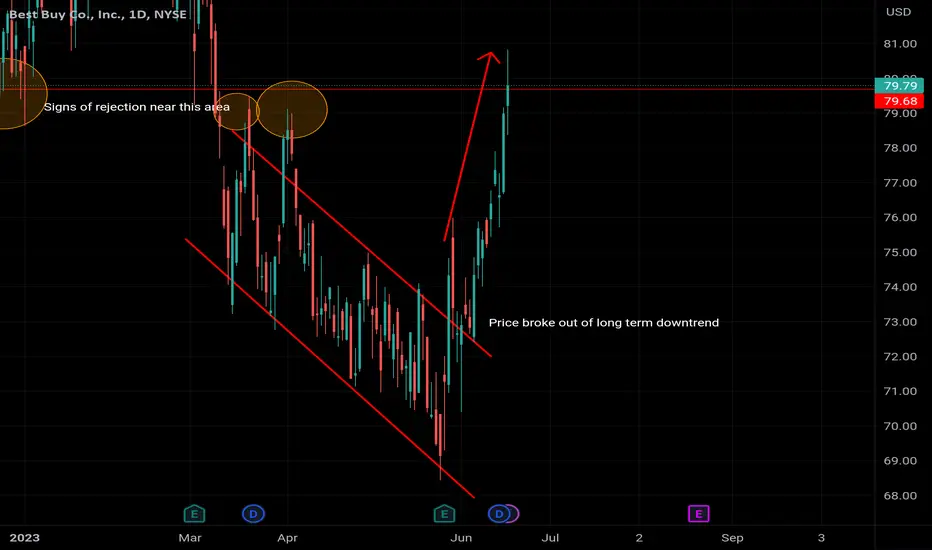
BBY drawback soonRecent Trend:
BBY stock has recently broken out of a short-term downtrend and has been showing a bullish trend. This suggests that the stock price has been rising, driven by positive market sentiment, strong financial performance, and favorable industry conditions.
Previous Rejection:
The stock price is approaching a price level where it has been rejected in the past. This means that the stock struggled to move beyond this level, leading to potential reversals or consolidation. Considering this historical pattern, there is a bearish outlook on the stock.
It's important to note that past price action doesn't guarantee future performance, and other factors should be considered. Additional analysis, such as technical indicators, fundamental analysis, and market conditions, can provide a more comprehensive view.
Please remember that this analysis is for informational purposes only and not financial advice. Before making any investment decisions, conduct thorough research, consider your own financial situation, and consult with a financial professional
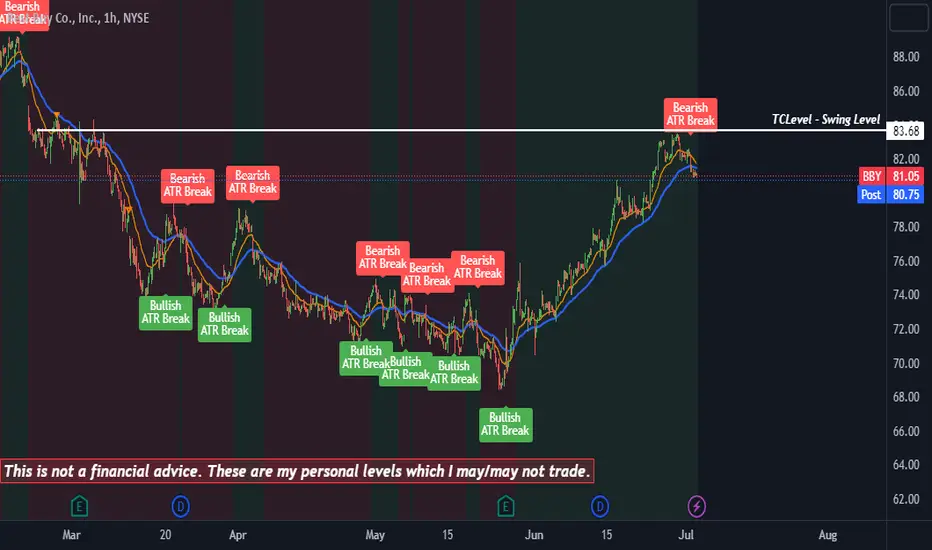
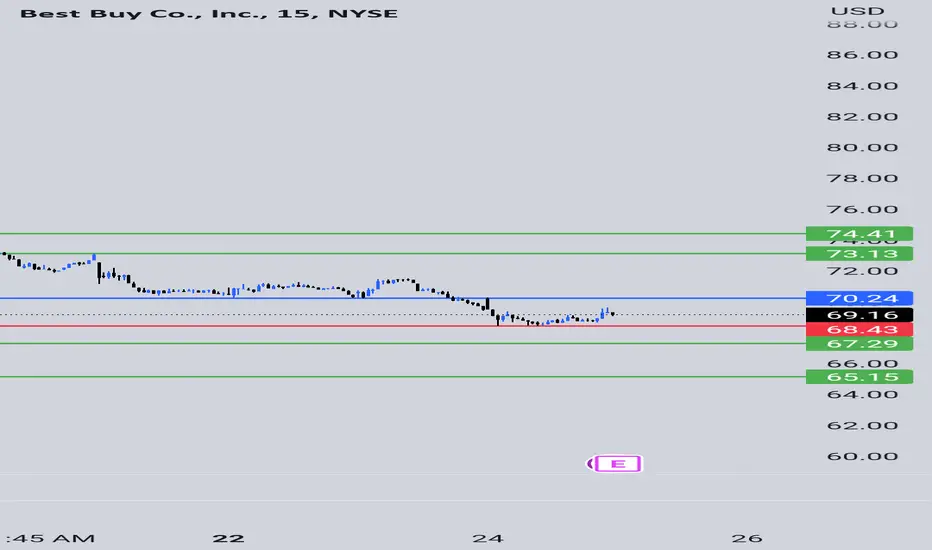
Bby earnings ideaBlue line is buy break
Red line is sl if taking buy
Red line is sell break
Blue line sl if taking sell
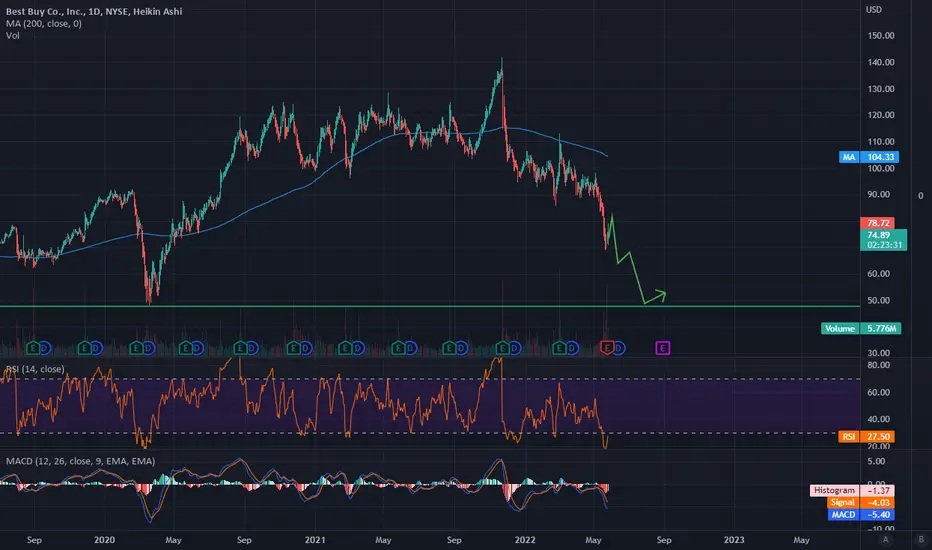
Bestbuy It looks like we should have short term rally. RSI is way oversold. MACD is still bearish and the long term trend is bearish. This is not a company you want to hold in an economic downturn.
Key Points
- Long Term Support is $48 area.
- Citi Downgraded BestBuy $65
We see a short squeeze after Citi's downgrade as expected. Regardless the market is in a downtrend.