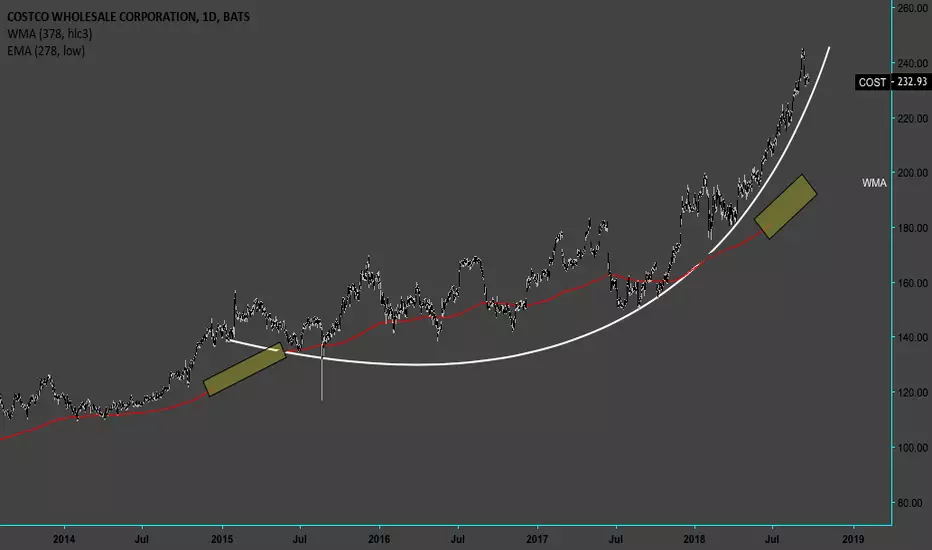
$COST - Lol. Dopest thing you'll read A while back, I remember wanting to get into algorithmic trading. I love math & all, but once one thing led to another & eventually I found myself trying to understand mechanics & quantum physics & computer learning - there was no way lmao. I tried, & it ultimately did help come up with my own strategy that I've gotten accustomed to. But since then, the most helpful & my favorite recollection of all things math & stocks is the bubble report. Chances are if you've seen bitcoin - you could tell it was a bubble, but probably didn't know when it'd pop, how long it'd take to recover (if ever), & where the top of it would be. Whether it's stocks, forex, bitcoin, commodities, etc., a bubble is a bubble. The best way (might be the only.?) to describe a 'bubble' is when exponential growth exceeds linear growth; historical growth (x) surpasses the equilibrium rate of growth (y) over time, & instead of a linear graph - you need a logarithmic graph just to make fit. A new bubble report is released each month & I remember seeing Costco on it w/ a 98% "bubble" score. Kept it on watch, but seeing as implied volatility is in it's top 25 percentile - better late than never lmao. I made this layout back during my experimenting on producing actual results to use moving averages as a "bubble" finder - bitcoin was my original start & I saved it since then. Although you can only see one (red) moving average, there's two. The 2nd is a weighted moving average for a half a year longer, while the red is a shorter, exponential moving average based off lows. I made the 2nd the same color as the background w/ thicker width that way whenever the (red) crosses over it - both moving averages disappear in an indication of faster exponential growth without an equilibrium. Although you can't see the 2nd moving average - click on any one of the yellow rectangles & you'll get an idea. I was supposed to make a comment about how this chart reminds me of Venezuela's inflation rate but, yeah. Better late than never. If you wana check out that bubble report,
Link - www.ethz.ch
COST trade ideas
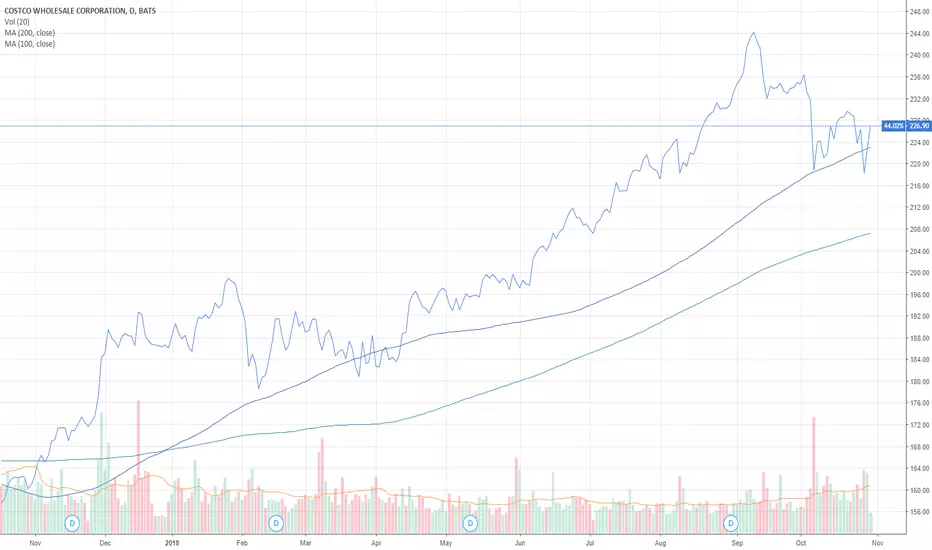
COST holding above 100dmaCOST has been impressive in performance for 2018. it is showing relative strength in a weak tape. This another long-term dividend grower.
Disclosure: long COST
[COST] It's starting phase 3Despite the price is over the 30MM, I think it's starting a phase 3. RSI is going down and the strong fall 3 weeks ago is felt.

COST is a BuyCostco is undervalued and oversold at the moment. Hanging on the bottom bollinger band. look for a 235 price target

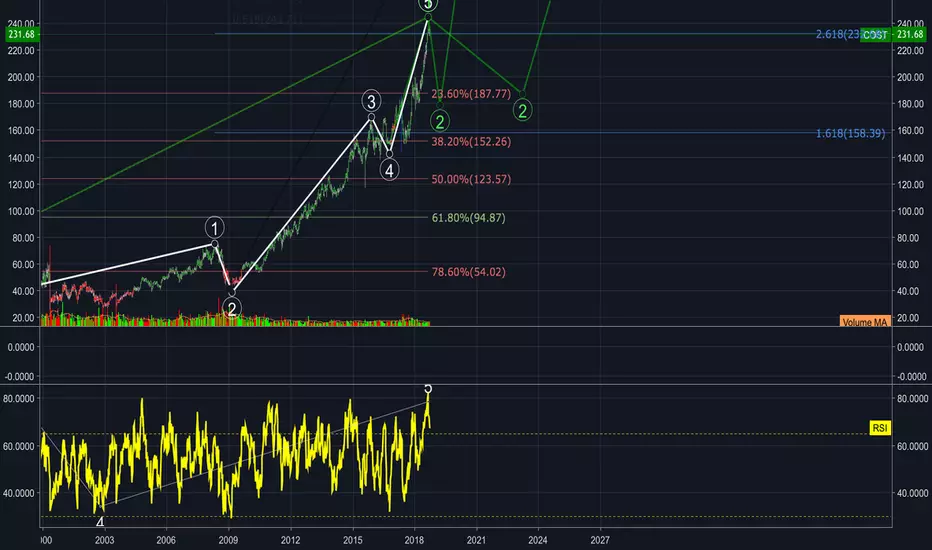
$COSTDone or just getting started?
A few outcome potentials.
Fractal has been full of consecutive extensions, are we ending Primary extended Wave 5, and retracing, or starting a terminal extended wave? or should I just go back to bed
Costco long when stochastic confirmsLooking at stochastic, Costco is out of overbought area. When stoch will turn up, then it is moment to buy

COST: High Risk for Long Term BuyConsidering your risk is something that all investors and traders should do before trading or investing in any stock. Often when a stock displays this much risk on the long- and intermediate-term time frames, it also warns of risk for short-term trading as well. The Weekly Chart provides better perspective of the risk of buying the stock at this new all-time high price. There is no support nearby. See how many points are at risk if a correction occurs?
Trade Wisely,
Martha Stokes, CMT
$COST very likely to rise 10/3$COST 5 sma crossed up 10 sma on daily, about to also cross up 20 sma 236.45 on daily.
MACD, Stoch and RSI all pointing upward /crossed.
Overall trend is up. Recent consolidation on both daily and weekly look great.
Let us see.
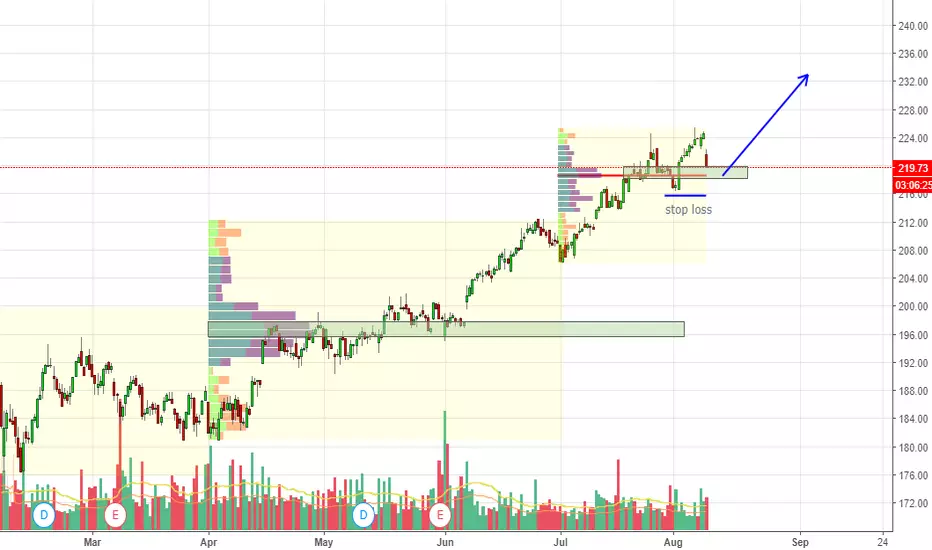
COST Long - Low RSI - Gap FillCOST is poised to bound off trend support and refill it's previous gap-down.
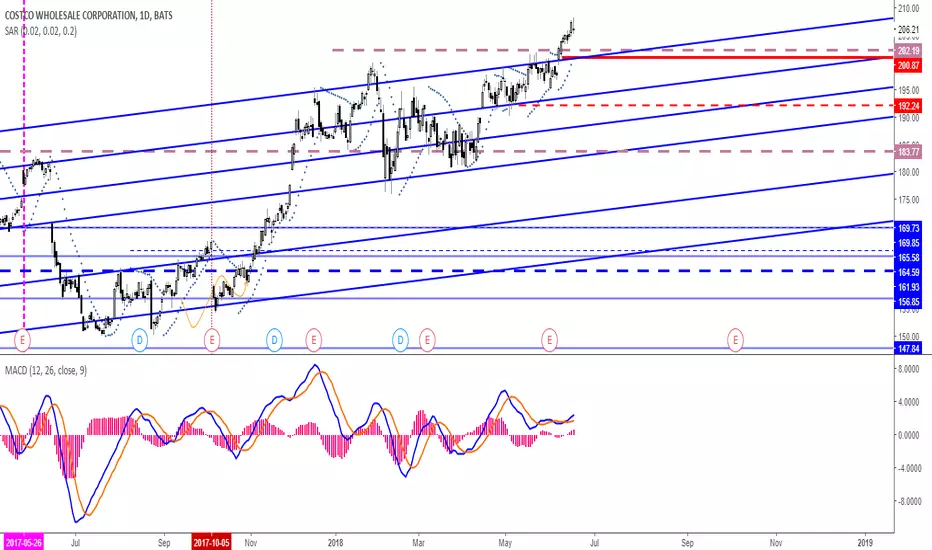
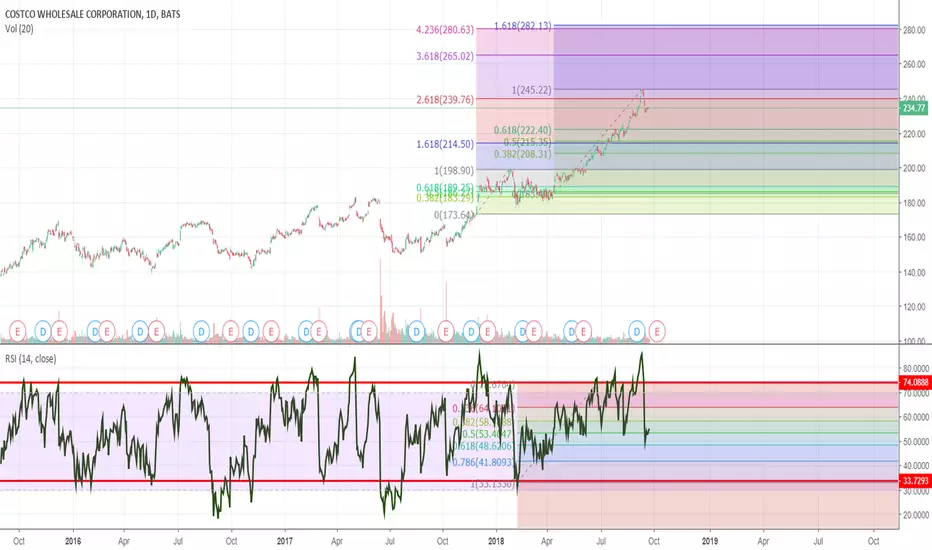
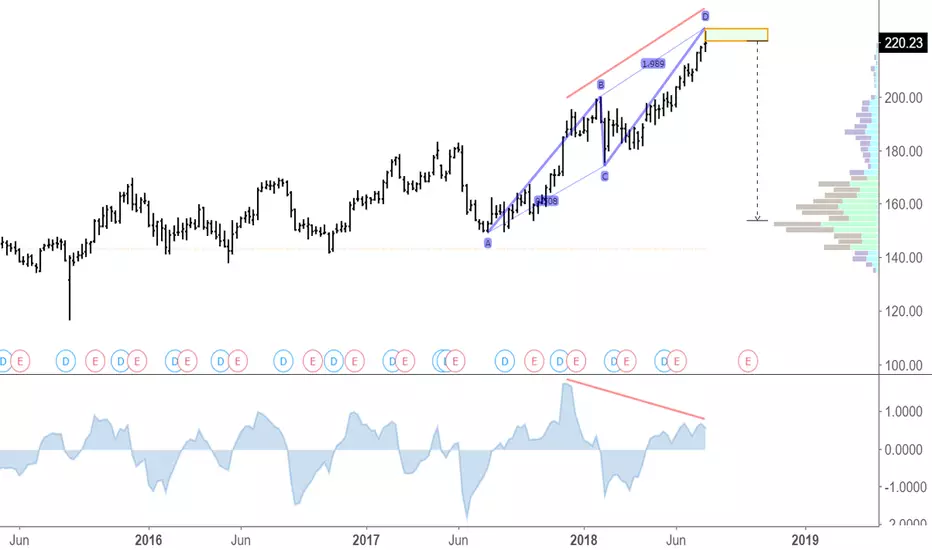
Costco Possible Target at 280There is a Fibonacci cluster at 280. Also resistance at 50 for RSI in the bull market suggest there will be another all time high coming

COST one of the man chart that hit it's expected moveBack to earth COST goes. Be careful holding stocks that hit their expected move. This market isn't that strong right now. Some more down side but hard to say how much.
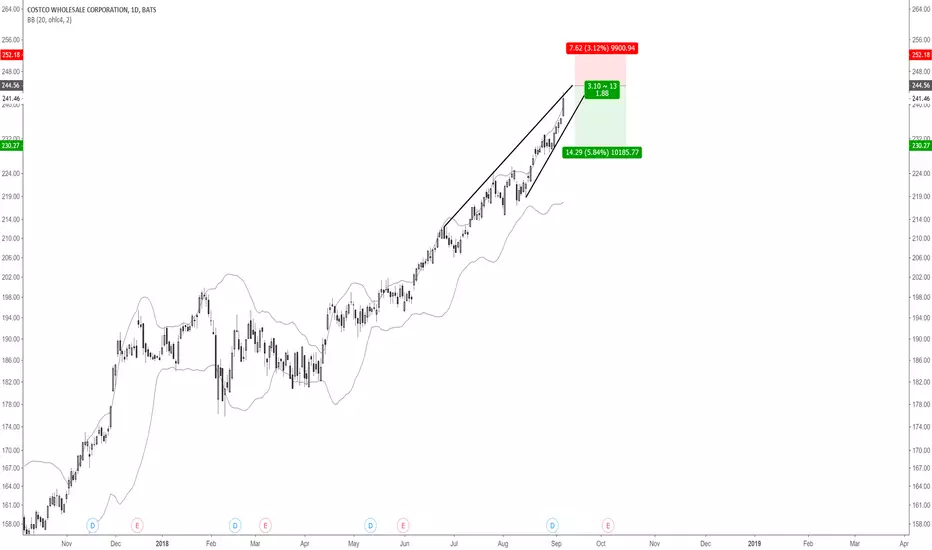
Costco ascending wedge bearishLooks like a blow off top here! I give it from here to $250 as the tap out point for longers.
Costco ascending wedge is bearish
Price is on resistance of ascending wedge
Price candle body far outside daily upper bollinger band
Stalking for a crash. Good traders stalk 90% of the time and trade only 10% of time. Quote me. :) :)
In this screencast I run through several superhot equities on the monthly time frame.
The higher time frames are often the cause of surprises for people' on 15min - 1H time frames.
Then the end of the screencast I look at the VIX on the 2 hour time frame for signs of nervousness.
I suspect - not predict that something big is coming.

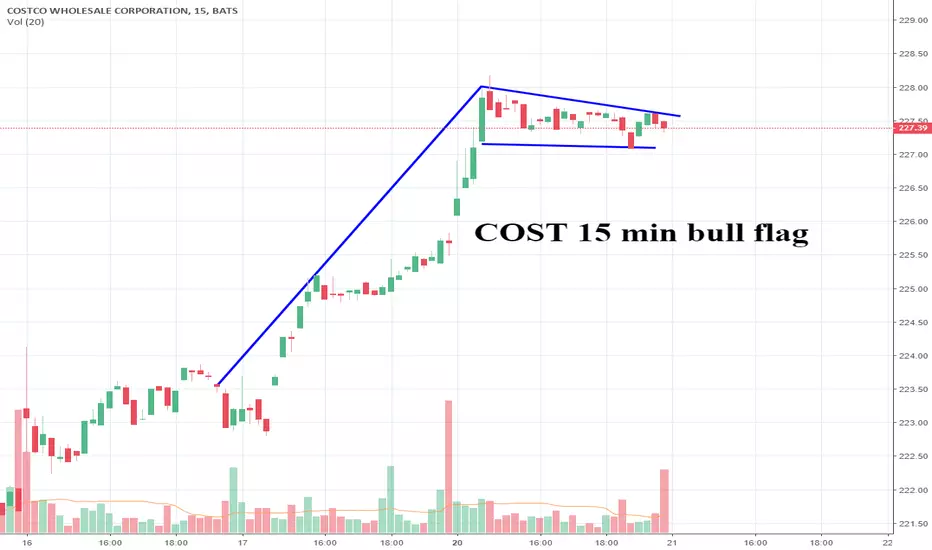
Costco's got a bull flag on the 15 min chartWait for a candle to close above the flag, then i'm long.
COST Bull FlagNoticed a flag appearing on COSTCO and entered position on bounce and break.
target at around 133-134 are but no current limit. Used more of an entry for long term EPS generally growing and PE is also getting higher but at a much lower pace.
Stop is low due to the nature of getting into the position. If it were to go that low from entry then I expect the market has changed for the position and sentiment would turn more bearish.
Keeping on position for time being to find any blatant exit signals.
COST - ShortSomeone shared this chart and caught my attention. I do agree with his formation and see an upcoming drop.
I started a pos with $220 PUT 10/19, 8.78 avg. May add more into my position since this can continue to go up until mid-August - worst case scenario.

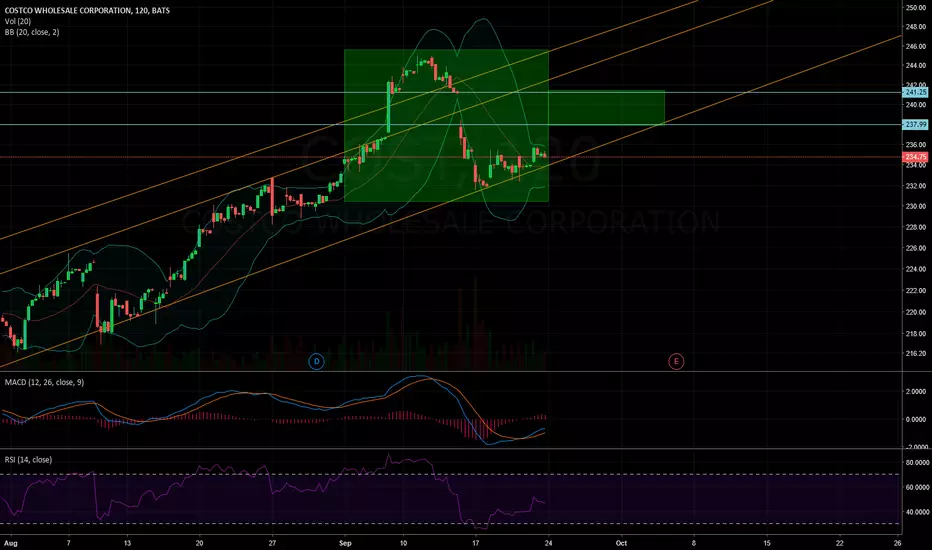
Short COST on throw-overThis 120m chart of COST shows a pattern that I trade frequently - the ending diagonal. It is a setup that, when identified correctly, can result in sharp moves lower as the stock breaks out of its impulsive sequence. I recently placed a similar trade on INTC that is working well.
As COST grinds higher in a converging wedge, it looks to have "thrown-over" trendline resistance. This is common in ending diagonals as price makes one final push before breaking lower through the bottom of the channel. Initiating a short position at 207.50 for a move back toward 180. A sustained rally through 215 will cause me to reevaluate the trade.

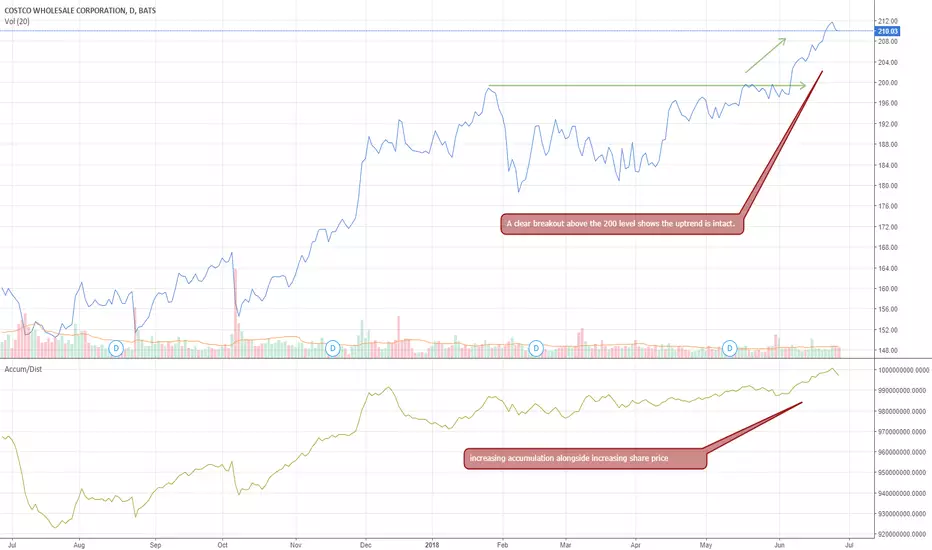
COST trending WILL it hit all time higher and continue trending,
adx is strong, and there are some nice trend-lines beneath the stock.