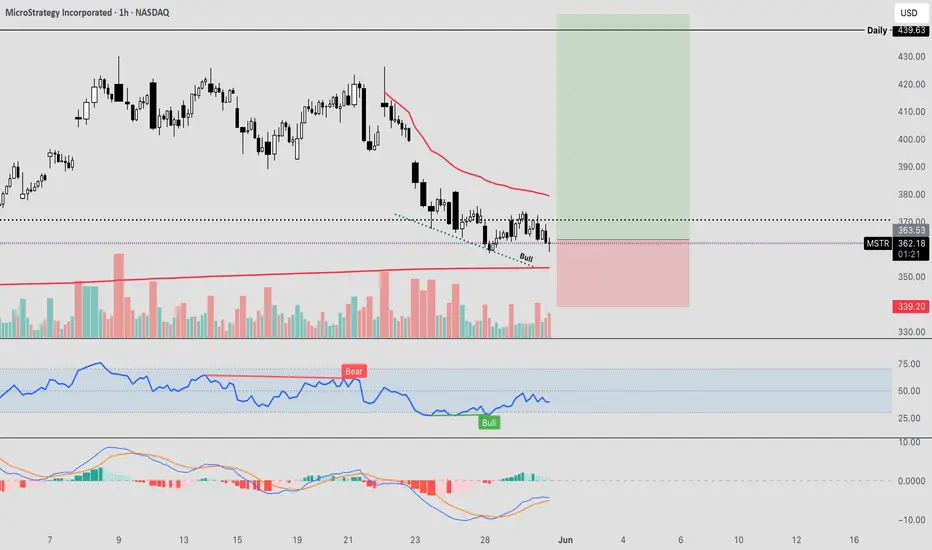
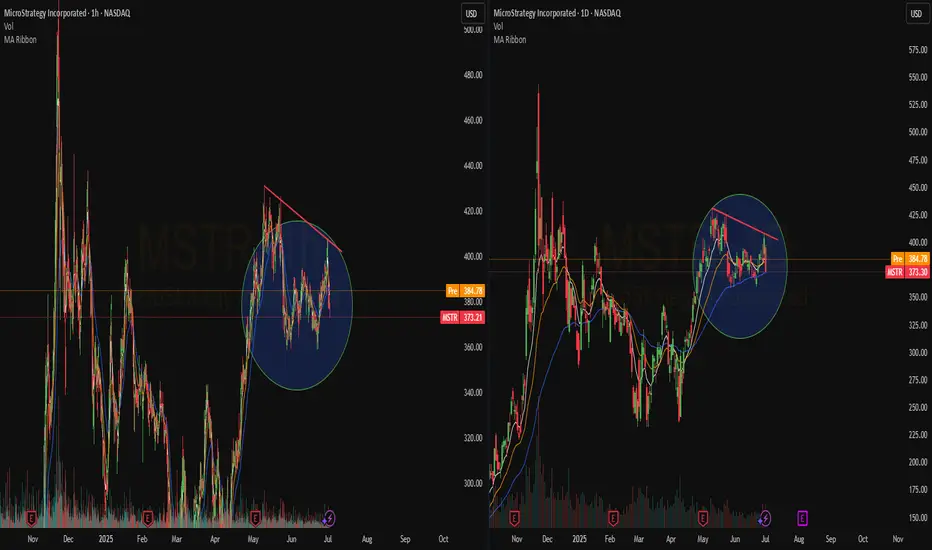
MSTR Bull DivergenceMSTR has seen a fast and sharp correction after rallying nearly 70% into some key levels of resistance , and currently pulling back into the longer term downtrend VWAP, as an attempt to flip the current downtrend.
This zone around $360 is very crucial for me personally, as we are attempting to hold the previous pivot high, and setting a firm low for continuation of the uptrend.
On the hourly timeframe we are finally starting to see some potential absorption here as price continues to make new lows, however the overall strength on the RSI is unable to continue making progress lower.
This is suggesting that the selling pressure may be running low, and MSTR can be due for a bounce.
I have laddered into this current position , and would de-leverage my risk if we start to break the lows as that could be quite a bearish sign, in the meantime, I would like to see some relief after such a harsh downtrend.
MSTR trade ideas
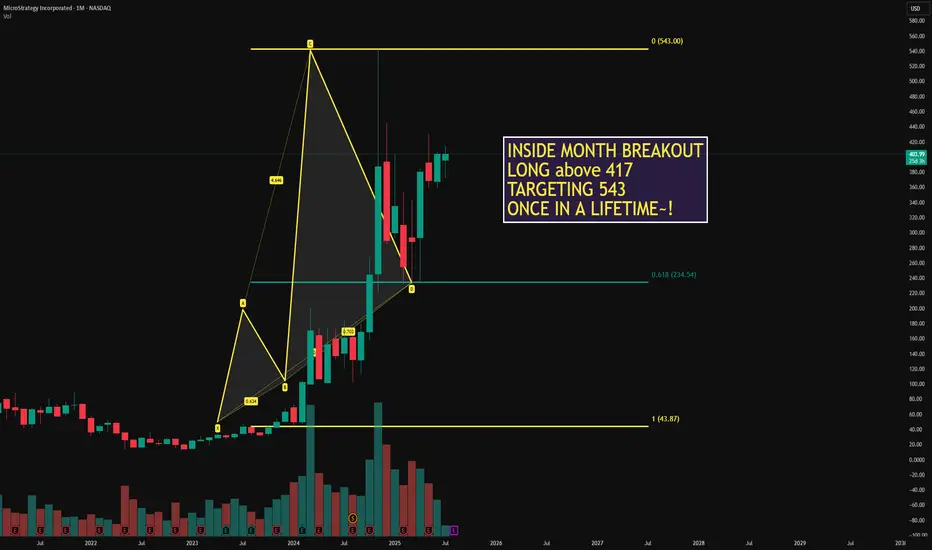
$MSTR ONCE IN A LIFETIME im up 400 GRAND!Targeting the 27.2 Extension with a MINIMUM target of 500
Do not LET OTHERS PUT U DOWN! I follow Fibonacci and I am up over 400k! FOLLOW UR SYSTEM!
I will alert my next buy here all I ask is drop a LIKE
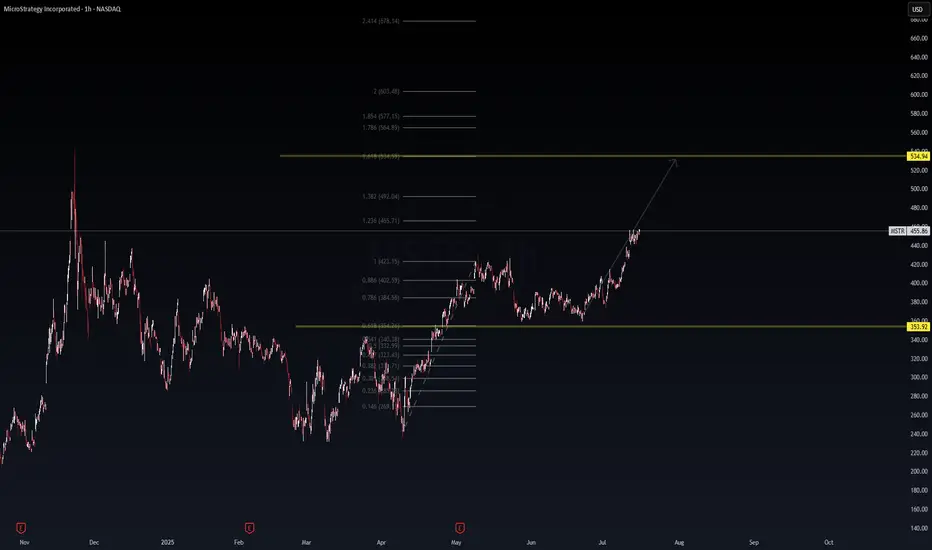
MSTR: Fibonacci Momentum Building Toward $534 🔺 MSTR: Fibonacci Momentum Building Toward $534 🚀
MicroStrategy (MSTR) continues its bullish ascent, following a clean Fibonacci extension pattern. After reclaiming key levels and holding above the 0.786–0.886 retracement zones, it now trades around $455 with strength.
📊 Technical Breakdown:
Breakout held above $423 (1.0 Fib)
1.236 Extension: $465.71 (short-term resistance)
1.618 Extension: $534.94 (main target)
Final leg: 2.0 Extension at $603 for full stretch
🟨 Support zone: $353.92
🟩 Trend: Higher highs and strong momentum
🧭 Bias: Bullish continuation unless price loses $402
💡 Macro Note: MSTR trades like a BTC-leveraged equity. Continued BTC strength could accelerate this move. Watch for potential catalysts like ETF flows, earnings, or Fed commentary.
📈 Thesis: As long as MSTR stays above $423, the bullish case toward $534 remains intact with high conviction.
🔔 Disclaimer: This analysis is for educational purposes only. Not financial advice. Always manage risk.
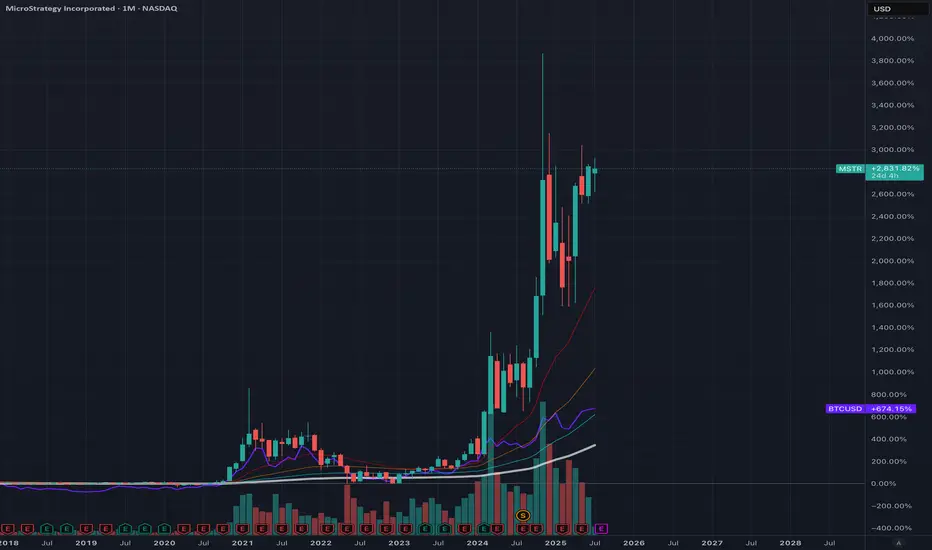
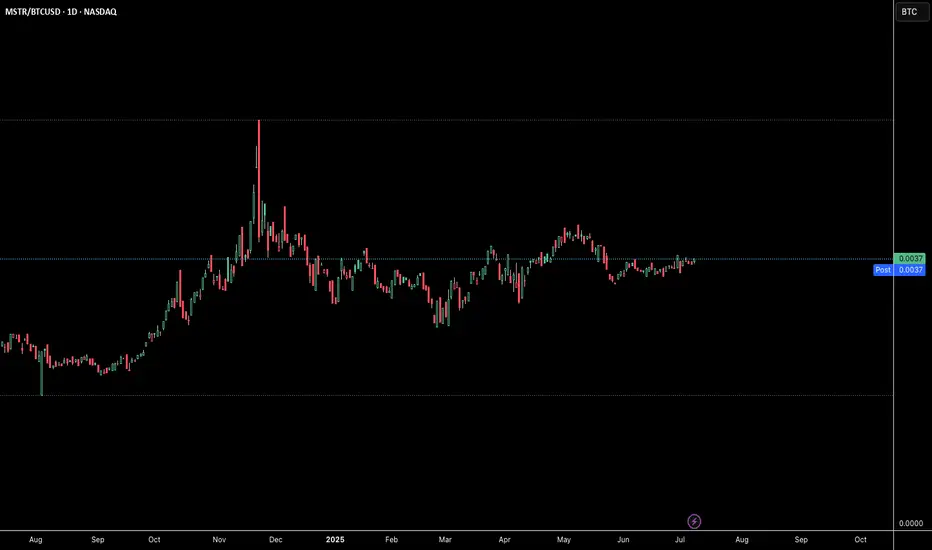
MicroStrategy Bitcoin FOMOIs it time to sell? In percentage terms, MicroStrategy has significantly outperformed its underlying asset, Bitcoin. It's concerning to watch Michael Saylor's FOMO (fear of missing out) into Bitcoin over the past year, as this could ultimately do more harm than good for Bitcoin. MicroStrategy's stock seems massively overvalued compared to its Bitcoin holdings. As the saying goes, "when the tide goes out, we see who is swimming naked."
Over the same period Bitcoin has gained 674%, while MicroStrategy has gained 2831%, making the situation quite clear. When comparing past bull runs, the percentage gains between Bitcoin and MicroStrategy have typically matched more closely, with both assets trending up together. So, what's different this time? Media exposure and FOMO.
Proceed with caution; this is starting to look like a bubble. Is it time to short?
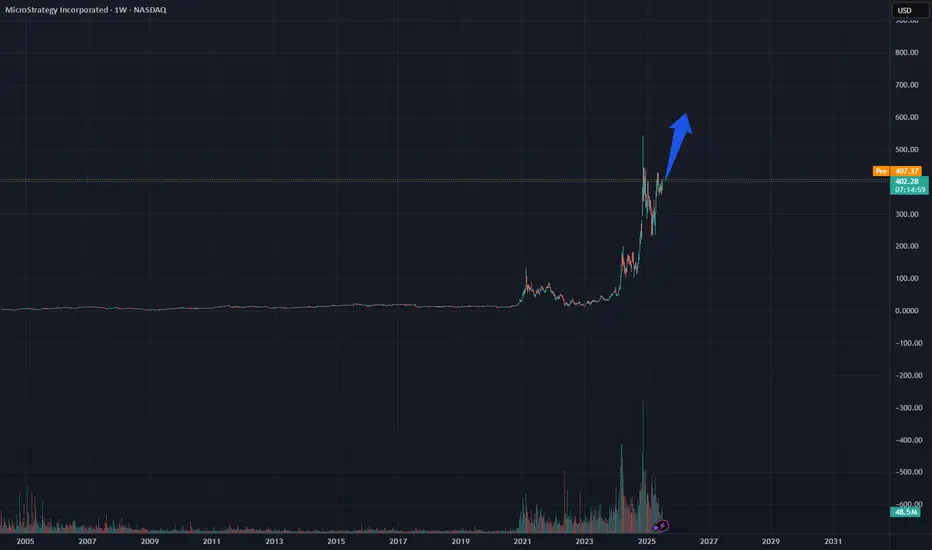
MSTR returning to ATHMSTR returning to ATH. Will MSTR continue or not? MSTR returning to ATH. Will MSTR continue or not?MSTR returning to ATH. Will MSTR continue or not?MSTR returning to ATH. Will MSTR continue or not?MSTR returning to ATH. Will MSTR continue or not?MSTR returning to ATH. Will MSTR continue or not?MSTR returning to ATH. Will MSTR continue or not?

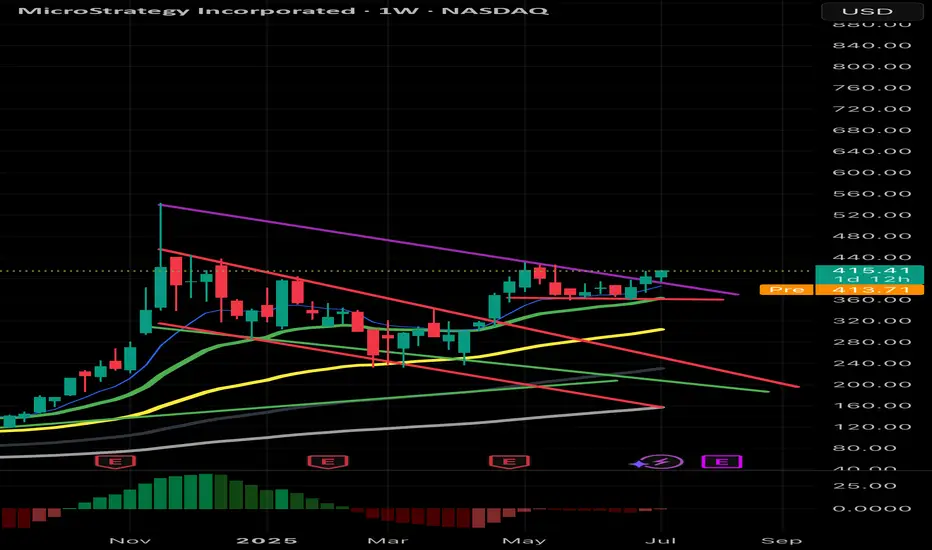
$MSTR: Long term bullish trendNASDAQ:MSTR long term signal triggered...
Up trend in monthly scale until end of 2025.
Heard it here first, lads.
Best of luck!
Cheers,
Ivan Labrie.

MSTR -- Cup & Handle Breakout // Long & Short SetupsHello Traders!
There is a beautiful cup and handle pattern that has formed on MSTR (Microstrategy).
This pattern offers us a wonderful long setup, as well as a potential short at the all time high.
Pattern Failure: If price both breaks and confirms below the C&P neckline the pattern is void.
Price will likely temporarily pull back from the all time high, giving us our short setup. However you'll want to be in and out quick considering price will likely continue to new highs after pulling back.
I will be swing trading the long setup and likely day trading the short setup.
Have fun and best of luck to everyone on their trading journey!

Cup and handleAfter many months, we now have a cup and handle formation. Regardless of Michael Saylor's constant buying, we have a bull flag in play that takes us to $491 USD.

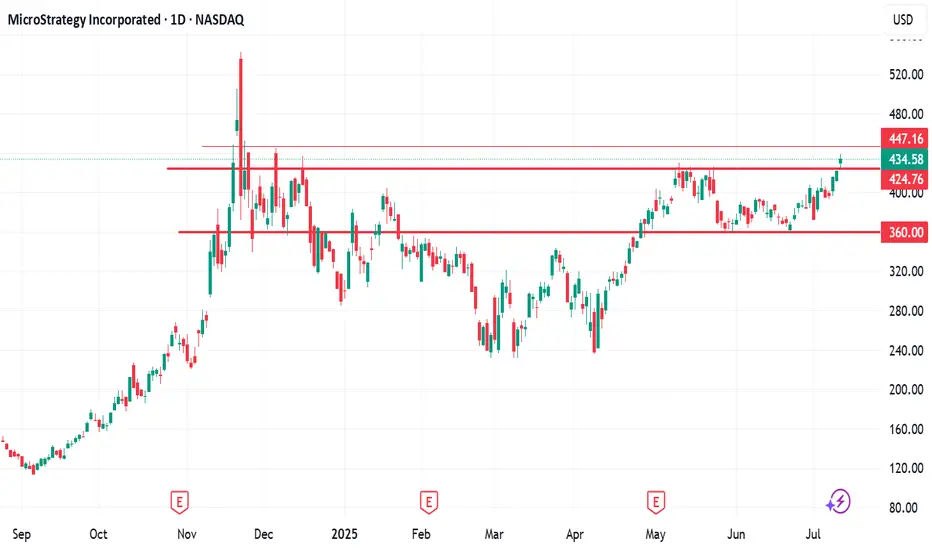
MSTR MICROSTRATEGY As of July 11, 2025, MicroStrategy Incorporated (MSTR) is trading at approximately $434.58 per share on the NASDAQ, showing a strong daily gain of about 3.04% (+$12.84). The stock has experienced significant growth recently, with a 3-month return of around 45% and a 1-year return exceeding 220%.
Key Highlights about MicroStrategy (MSTR):
Industry: Software - Application
Market Cap: Approximately $118.8 billion
Shares Outstanding: About 273 million
Trading Range (Year): Low near $102.40 and high around $543.00
Volume: Active trading with daily volumes around 18 million shares
CEO: Phong Q. Le
Headquarters: Tysons Corner, Virginia, USA
Business: MicroStrategy provides enterprise analytics software and services, including a platform for data visualization, reporting, and analytics. It serves a broad range of industries including finance, retail, technology, and healthcare.
Recent Price Trend
The stock has steadily appreciated from about $255 in February 2025 to over $430 in July 2025.
Recent trading range for July 11 was between $423.70 and $438.70.
After-hours trading shows a slight dip to around $433.25.
Outlook
The next earnings announcement is scheduled for July 31, 2025.
Analysts forecast the stock price could range between $434.58 and $798.13 in 2025, reflecting optimism about the company’s growth prospects and market position.
MicroStrategy’s strong correlation with Bitcoin price movements (due to its large BTC holdings) often influences its stock volatility and performance.
In summary: MicroStrategy is a major player in enterprise analytics software with a highly volatile stock influenced by its Bitcoin exposure and market sentiment. Its stock price has surged strongly in 2025, reflecting both business fundamentals and crypto market dynamics.

MSTR stock has seen a strong rally since JuneSince June, MSTR stock has seen a strong rally—rising from the mid‑$300s to above $430—driven by a few key factors:
Bitcoin’s continued ascent has fueled sentiment. Bitcoin recently hit fresh record highs (above $118K), driven by a weakening dollar and bullish macro trends, which in turn boosted bitcoin-linked equities like MicroStrategy.
In short, MSTR’s rally since June has been largely Bitcoin-driven: a powerful combination of rising crypto prices, ongoing BTC purchases, proactive capital raises, and positive analyst sentiment creating a bullish feedback loop.
Let me know if you'd like a breakdown of Bitcoin’s trend or deeper insight on MSTR’s financing strategy.
$447 will be my next buy TP.
Please, share your thought, like, share and follow me.
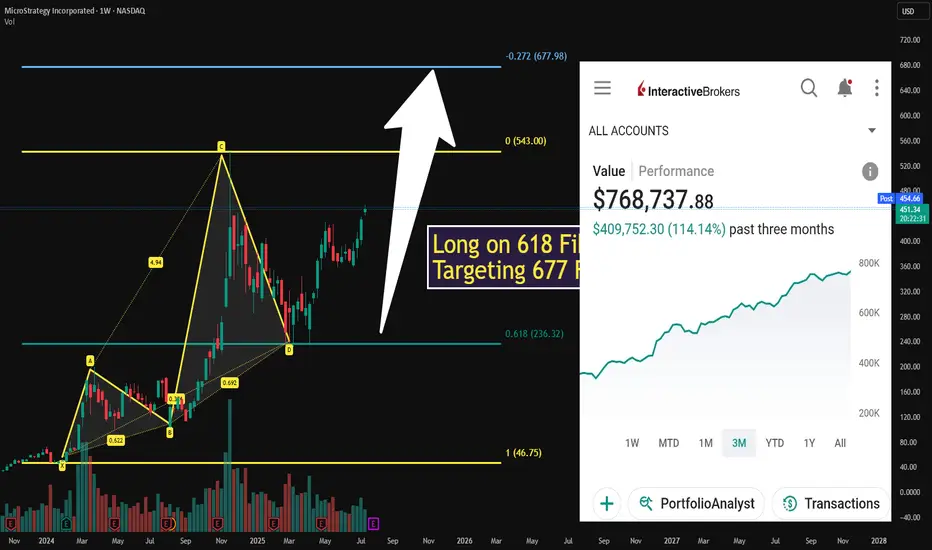
$MSTR ONCE IN A LIFETIME FIBONACCICall me CRAZY but my target is 677 🎯
First entry at 236 ALGOS stepped in the GOLDEN ZONE
Looking to RELOAD on LOW RISK HIGH REWARD SETUPS ONLY
I will give my exact entries LIVE all I ask is Drop a "❤️"

MicroStrategy ($MSTR) – Bitcoin Proxy Setting Up AgainMicroStrategy Incorporated NASDAQ:MSTR remains the definitive institutional proxy for Bitcoin exposure, uniquely combining its enterprise software operations with a high-conviction, leveraged Bitcoin accumulation strategy. Its $1.42B BTC purchase in April 2025 further cements this thesis, making MSTR a prime vehicle for traders seeking amplified BTC exposure via equities.
Since our May 5th analysis, MSTR has rallied ~14.61%. We’re now eyeing a re-entry opportunity on a pullback to the $394–$387 zone, aligning with technical support and previous consolidation.
🎯 Bullish targets remain unchanged: $490.00–$500.00, backed by Bitcoin strength and MicroStrategy’s unwavering strategy.
🔁 Re-entry: $394–$387
🟩 Targets: $490–$500
#MSTR #Bitcoin #CryptoStocks #BTC #StockMarket #TechnicalAnalysis #MicroStrategy #HighBeta #CryptoExposure #TradingSetup

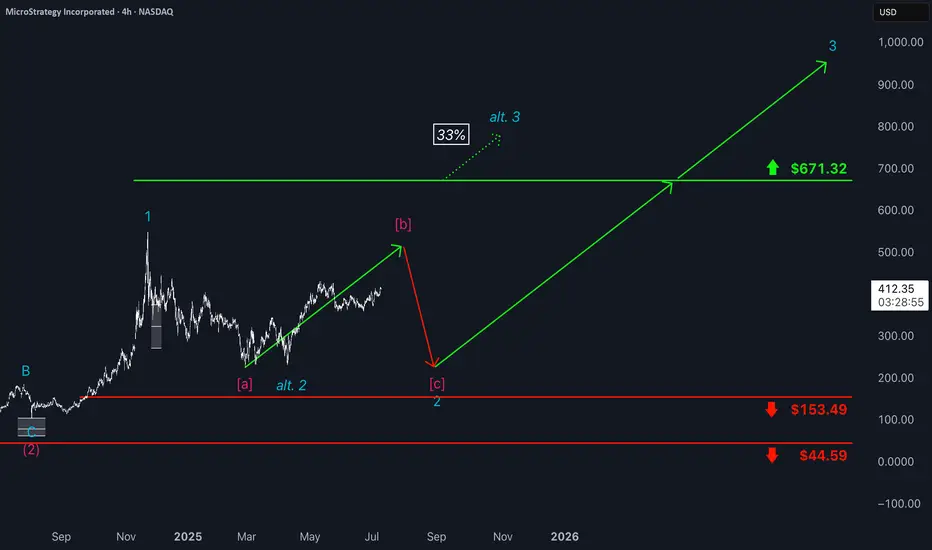
Microstrategy: Renewed Upside MicroStrategy has continued to face downward pressure recently but is now showing more decisive signs of an upward move. We still see greater upside potential in the current magenta wave , though we expect the peak to form below resistance at $671.32. Afterward, the bearish wave should complete turquoise wave 2—while still holding above support at $153.49. Wave 3 should then usher in a longer upward phase, with momentum likely to ease only well above the $671.32 level. At the same time, there remains a 33% probability that the stock has already entered this upward phase. In that scenario, turquoise wave alt. 2 would already be complete, and the price would move directly above $671.32 as part of wave alt. 3.
📈 Over 190 precise analyses, clear entry points, and defined Target Zones - that's what we do.
$mstr can’t get better than this setup Just look how beautiful the chart is. Breakout was imminent after waiting for the right time. This shows how effective the falling wedge pattern always gets out as a winner and everyone loves it because all bitcoin and related stocks mainly depend on falling wedge patterns. Trust the process!!
$MSTR Continues on last weeks path!NASDAQ:MSTR continues to breakout above the channel after a retest as support.
High Volume Node at $440 may proof tough but if price breaks through we could see a strong FOMO induced breakout into price discovery.
Analysis is invalidated below the channel at $358.
Safe Trading
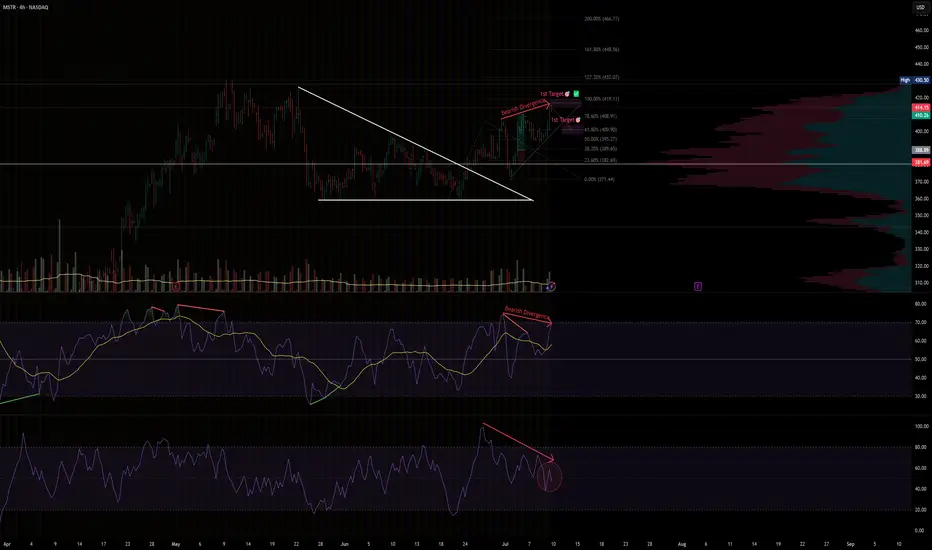
MSTR · 4H —Early Bearish Divergence Detected Near Key Fib TargetSetup Breakdown
Price recently broke out from a falling wedge and hit both technical targets — first at ~$409 (78.6%) and then ~$419 (100%).
However, momentum is weakening despite price hovering near the highs.
We're now seeing early bearish divergence on multiple timeframes and oscillators, signaling potential reversal or pullback.
⚠️ Bearish Signals
RSI Divergence
Price made higher highs while RSI made lower highs — classic bearish divergence.
Double confirmation
Both RSI with MA and pure RSI show declining momentum.
Volume drop
Price is rising but volume is not following — another early warning sign.
🔻 Potential Breakdown Trigger
If price closes below $407–405, that would break short-term structure and confirm the divergence risk.
Watch for RSI to drop below 50 and volume to spike on red candles — that would likely accelerate the correction.
📉 Downside Zones to Watch
$400
=> 61.8% Fib retracement + consolidation base
$395
=> 50% Fib retracement
$389
=> 38.2% Fib retracement + prior breakout support
✅ Summary
Divergence is still early but meaningful — momentum does not support current price highs.
A breakdown from current levels could open a short window down to $386 or even $371 if confirmed.
Watch RSI + volume + candle structure for confirmation before acting.
Disclaimer: This is not financial advice. Always manage your own risk and follow your trading plan.
#MSTR #BearishDivergence #RSI #Fibonacci #MomentumShift #VolumeAnalysis #TradingView #TechStocks #4HChart
$MSTR ONCE IN A LIFETIMEINSIDE MONTH BREAKOUT is here
Long above 417 targeting 500+
LOW RISK setup HIGH REWARD potential I will alert ALL HERE NO CHARGE all I ask is DROP A LIKE
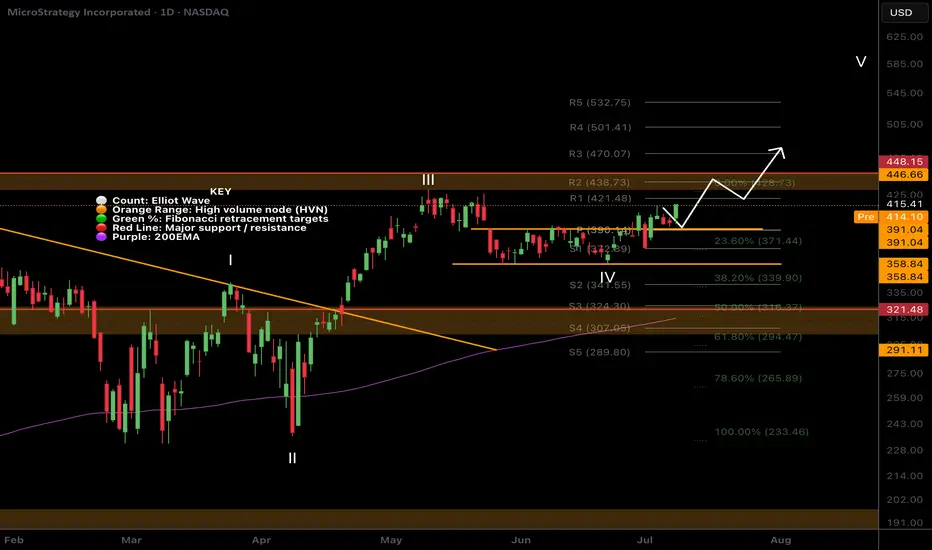
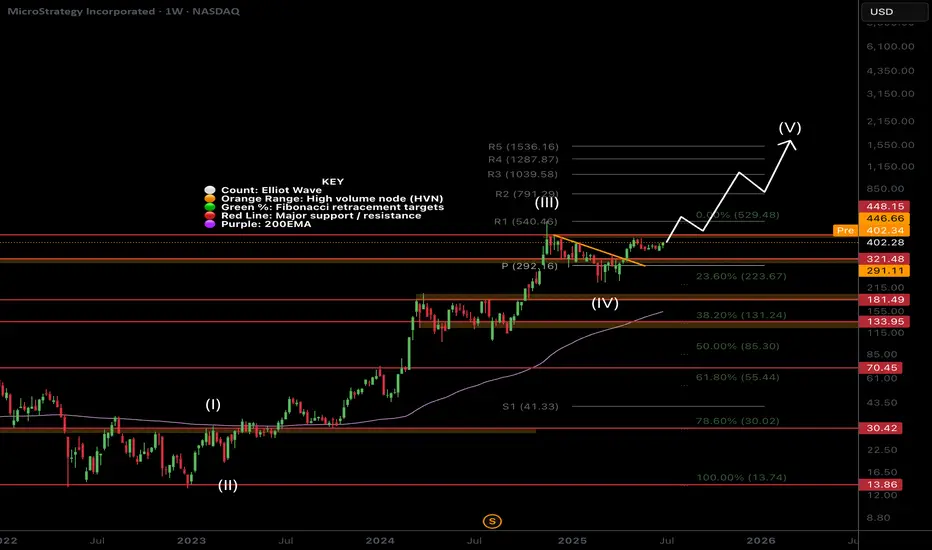
$MSTR Megatrend Continuation?NASDAQ:MSTR is market leader in the CRYPTOCAP:BTC strategic reserves strategy and has set the benchmark.
After a nearly 20x rally profit take is exceptive, price has held up extremely well through the last 6 months only dropping to the .236 Fibonacci retracement and weekly pivot. As Bitcoin continues into price discovery expect the MSTR rally to continue with renewed tailwinds.
It is an extremely hated stock as well as its collection of yield baring derivatives. The keeps the social mood / sentiment low which could prove further tailwind for growth.
I am looking at a terminal target this cycle of around $1500 at the R5 weekly pivot.
Safe trading
Strategy(mstr) Medium Term ProjectionSentiment will cause this impulse in price, will reach at least 600 per share maybe even more.
I will update this analysis periodically.
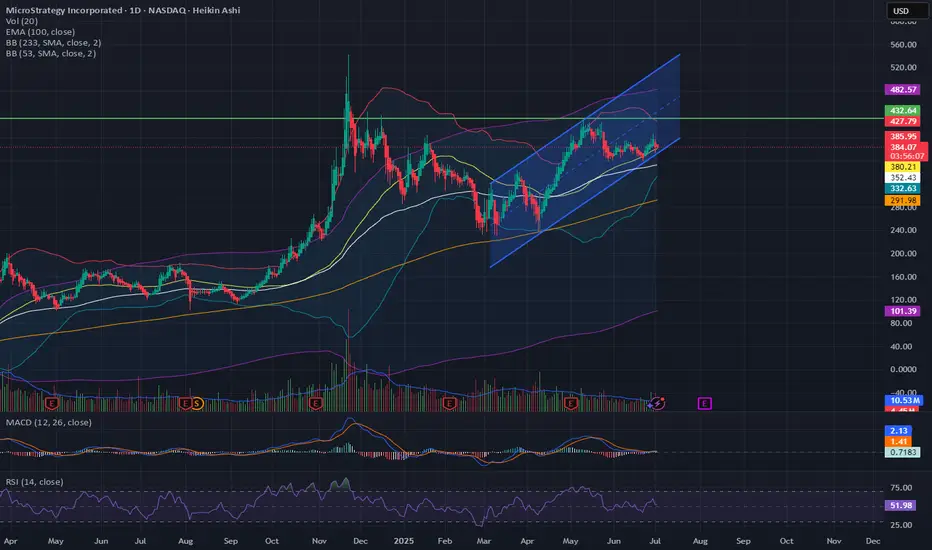
(MSTR) – Cup & Handle Brewing Inside a Rising Wedge?MSTR is currently trading around $384, consolidating just under a significant historical resistance near $432, the neckline of a potential cup and handle formation. Price action has respected a rising wedge channel since mid-April, making higher highs and higher lows with relatively muted volume – a classic consolidation before a breakout... or breakdown.
The Cup and Handle – Brewing or Breaking?
Cup Formation: The cup ranges from the November 2023 high down to the January 2024 lows and back up, completing the round base at ~$432.
Handle Formation: Price has been forming a descending handle within the rising wedge, staying above key moving averages.
Breakout Target (Cup & Handle):
Cup depth: ~$432 - ~$290 = $142
If confirmed breakout occurs above $432, measured move takes us to ~$574
Bullish Validation:
Close above $432 on strong volume confirms breakout.
Look for volume spike + strong Heikin Ashi candles with little/no wicks below body.
Momentum indicators (MACD crossover + RSI breaking 60+) would further confirm.
Bearish Breakdown Scenario:
A confirmed breakdown below $360 (channel support + BB midline) would shift momentum bearish.
$352 (100 EMA) is the next critical level — if this goes, the structure weakens significantly.
Watch for a test of $332, which aligns with both Bollinger Band support and a horizontal demand zone.
A full breakdown of the channel and cup handle structure could see price revisiting the base of the cup near $290–292, where the 233 SMA and major historical support converge.
Indicators:
MACD: Bullish crossover forming, histogram slightly positive. Needs stronger momentum to sustain rally.
RSI: Neutral zone (~52). Not overbought or oversold – room to move in either direction.
Volume: Volume is decreasing, typical before a big move. A spike will hint at direction.
Final Thoughts
MSTR is at a pivotal technical crossroads. The broader setup shows a cup and handle formation in progress, with the handle unfolding inside a well-defined ascending channel — a bullish structure that supports continuation if price holds key levels.
To confirm the cup and handle, bulls need to see a clean breakout and close above $432, preferably on increased volume. That would validate the pattern and open up a measured move target toward $574+.
Meanwhile, the ascending channel remains intact, guiding price higher with higher lows and highs. To maintain this structure, MSTR must hold support above $360–352. A sustained bounce off this zone would reinforce both the channel and the handle as part of the bullish setup.
However, if price breaks below $352 and especially closes below $332, it would invalidate the ascending channel and begin to threaten the cup’s base structure. A breakdown toward $290–292 would likely follow, where the entire pattern would need to be reassessed.
Until a breakout above $432 or a breakdown below $352–332 is confirmed, this remains a neutral “watch zone”. Swing traders should be cautious, but keep alerts set, a move in either direction could be powerful and directional.
Quick View: $MSTR
- The daily chart sees the price testing the ema 50d as support while all the other EMAs are in a bullish scenario. Great Bullish pattern. Looking for an action that creates a new positive price action
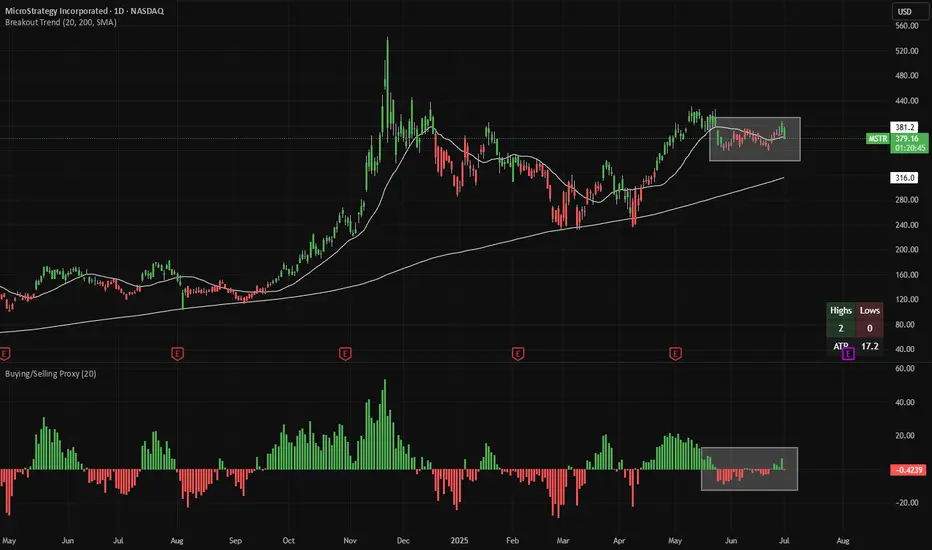
MSTR Long - high squeeze potentialMSTR recently made 20-day highs (green candles) and then sold off towards the 20D EMA trendline. Meanwhile, looking at a proxy of net buying/selling (bottom panel), there has been neither significant buying nor selling activity.
All of this is setting up the potential for a squeeze higher.
Needless to say, please manage your risks carefully and consider setting a stop-loss upon MSTR closing at a 20-day low (red candle).
Both indicators (Breakout Trend and Buying/Selling Proxy) are available for free on TradingView.