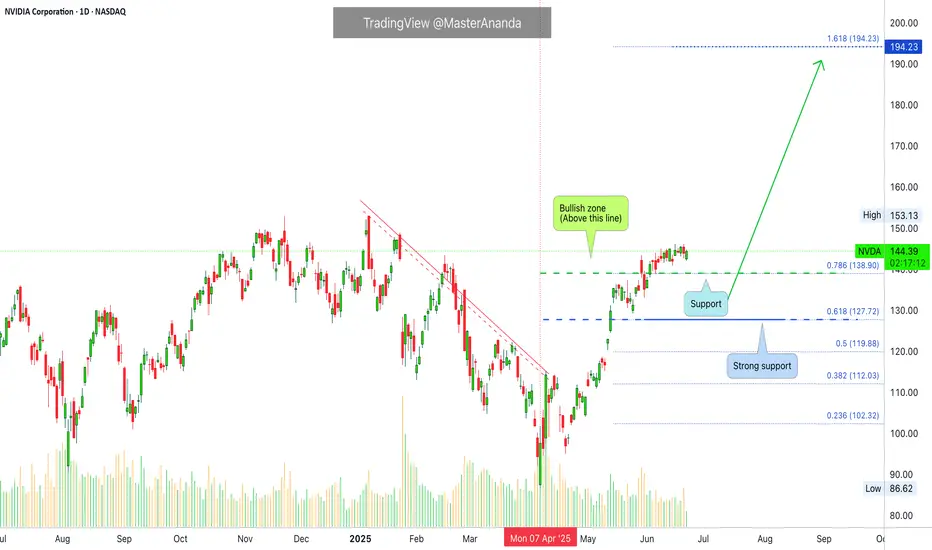
NVIDIA Has more room to raise furtherIs it V-Shape pattern ? If Yes, it's definitely ready to go up and possible to hit 199-200
NVDA trade ideas

NVIDIA AnalysisNASDAQ:NVDA
NVIDIA (NVDA) – Elliott Wave + Fib Confluence Forecast | 2025/26 Outlook
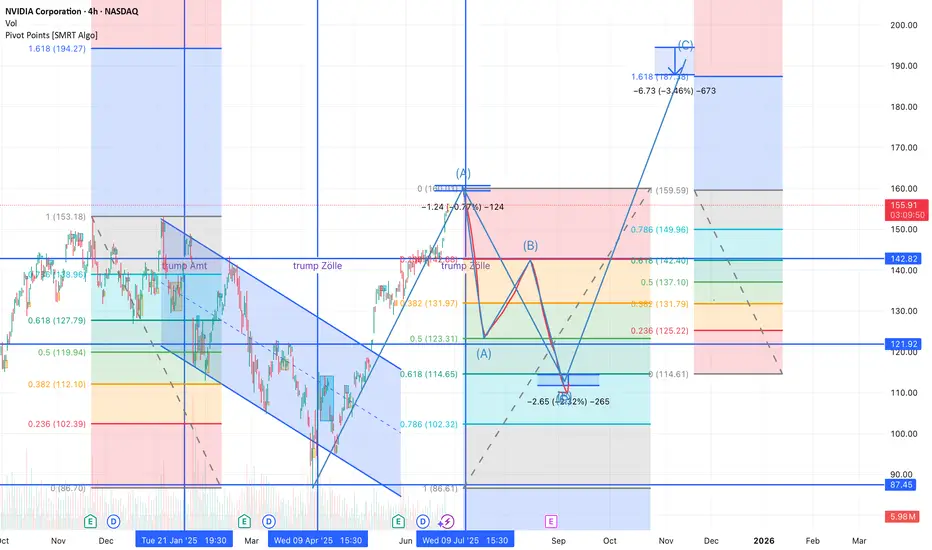
After a textbook falling wedge breakout and bullish retest, NVIDIA is now completing a potential (A)-(B)-(C) correction wave structure. Here's the detailed outlook:
🧠 Technical Structure & Price Zones
The (A) wave may have topped near 159.59, with strong Fib confluence zones (2.618–4.236) and a visible rejection.
A sharp (A) down leg is projected to test the Fib 0.618–0.786 support between 114–102 USD, aligning with a historical demand zone and key structural low.
A corrective (B) bounce could reach up to ~142 USD, which is the 0.618 retracement of the projected fall.
The final (C) wave may target the 1.618 extension around 187–190 USD, suggesting a potential year-end rally if the wave structure unfolds as expected.
These may again align with wave turning points, particularly around July and September 2025.
📊 Fibonacci Clusters
Numerous Fib confluences were detected using the full wave stack (retracements, extensions, projections).
Watch the 121.92 and 142.82 horizontal zones — both are strong Fib overlaps and historical pivot levels.
Blue vertical lines indicate potential turning windows.
📌 Conclusion: A high-probability ABC correction pattern seems to be forming. Once Wave (B) completes, a final impulsive push toward ~190 USD could occur before a larger correction sets in. Monitor macro headlines and price behavior near Fib zones.
💬 Let me know your thoughts below — bullish, bearish, or neutral? Always happy to discuss wave setups!
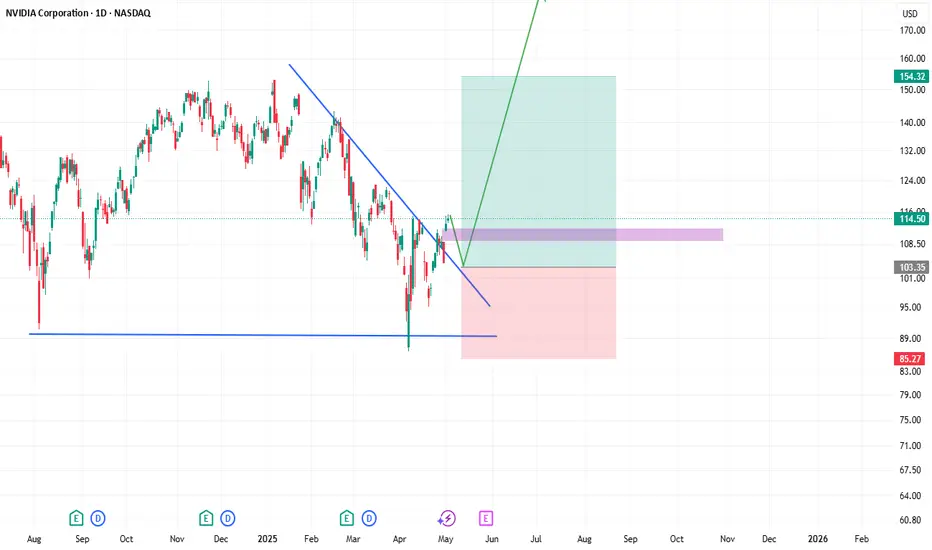
NVDA LongJust checked this stock which seems very good trade for now. With a flow of good news for the past week about the trade war between China and USA, there is a good possibility for a long trade in here. Also technically, a downtrend line has been broken, and liquidity got swept, so i cant see anything in the way of a long trade in here.
See this marked blue line, thats a down trend that got broken. Now i would be looking for this small gap to be filled and the price testing the downtrend.
Confirm on lower tf if the price would hold this trendline and wont go below it, then make an entry.
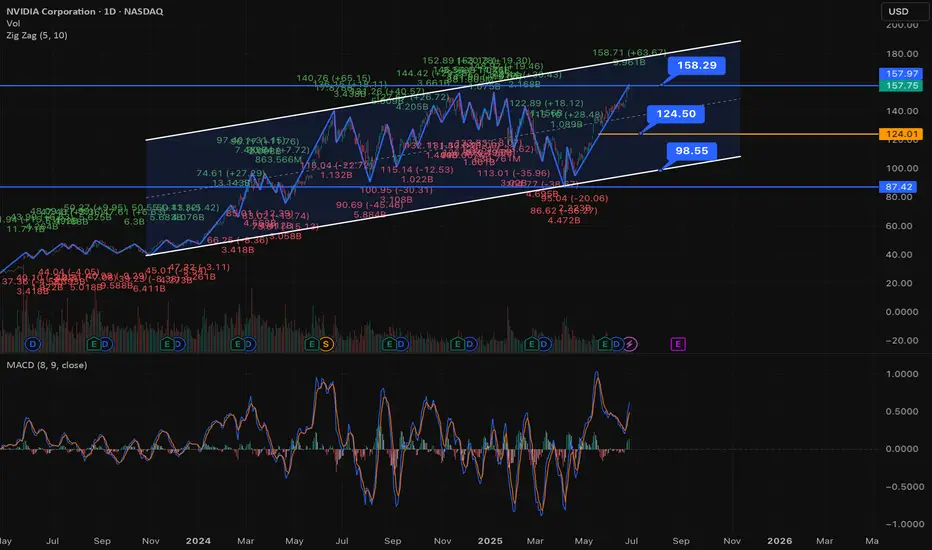
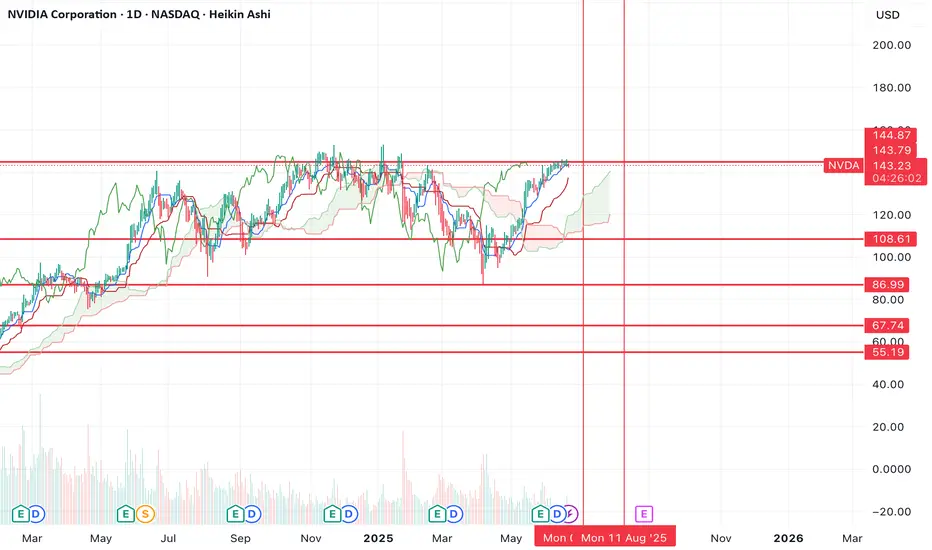
NVIDA still bouncing in the channel but could 158 be....Let's analyze NVIDIA (NVDA) stock with a focus on your specified parallel channel from November 2023 lows to April 2025, and its current position relative to the channel's middle line.
As of Friday, June 27, 2025, at 10:18:37 PM PDT, here's a breakdown of NVDA:
**Current Price & Performance:**
* **Last Price:** $157.75 (as of 4:00 PM ET on June 27, 2025)
* **Today's Change:** Up $2.66 (1.71%)
* **Previous Close:** $155.09
* **Today's Range:** $155.255 - $158.71 (intraday)
* **52-Week Range:** $86.63 - $158.71 (Today's high is the 52-week high, indicating a strong recent upward push and reaching new all-time highs.)
---
### **Parallel Channel Analysis (Nov 2023 Lows to April 2025)**
A parallel channel is formed by two parallel trendlines that encompass the majority of price action.
* **Uptrend Channel:** Both lines slope upwards.
* **Middle Line:** Often drawn equidistant between the two channel lines, serving as a dynamic support/resistance level.
**Constructing the Channel (Conceptual):**
* **Bottom Line:** Drawn from a significant low in November 2023 (NVDA's 52-week low is $86.63, likely from around that timeframe or slightly later in 2024). This line would connect subsequent higher lows.
* **Top Line:** Drawn parallel to the bottom line, touching the significant highs experienced during the uptrend, extending through April 2025.
**NVIDIA's Trajectory in the Channel:**
NVIDIA has been in a **parabolic uptrend** since late 2023, driven by massive demand for its AI chips. This kind of explosive growth is highly conducive to parallel channel formations, where the price continually moves higher within defined boundaries.
* **From Nov 2023 Lows to April 2025:** NVIDIA experienced a massive rally during this period. The price would have largely stayed contained within a relatively wide, upward-sloping parallel channel.
* It would have likely bounced off the bottom trendline (support) and moved towards the top trendline (resistance) multiple times.
* The middle line would have acted as a pivot point, with the price oscillating above and below it.
**Current Position: "Price is now above the middle line."**
* **Interpretation:** The fact that the price ($157.75) is currently *above* the middle line of this parallel channel (which spanned from Nov 2023 to April 2025) is a **bullish sign**.
* When the price is in the upper half of an upward-sloping parallel channel, it indicates **stronger bullish momentum** within the established trend.
* It suggests that buyers are in control and the stock is likely heading towards the **upper trendline of the channel**, or even attempting a breakout above it, especially given its recent push to new all-time highs.
* The middle line, having been crossed to the upside, now acts as a **dynamic support level**.
---
### **Implied Trend and Next Steps (based on the channel):**
* **Continued Upside:** Being above the middle line suggests a continuation of the upward trajectory within the channel.
* **Targeting Upper Band:** The next logical target for NVDA, within the context of this channel, would be its **upper trendline**. Given NVDA's history of consistently pushing boundaries, it might even test or break above this upper trendline, potentially signaling an acceleration of the trend or a "blow-off top" (though this is not guaranteed).
* **Support:** The middle line of the channel now becomes a key support to watch on any pullbacks. A move back below it would suggest a weakening of immediate momentum or a move back to the lower half of the channel.
---
### **Overall Outlook for NVDA:**
NVIDIA is trading at **all-time highs**, which itself is a testament to its strong bullish trend. The parallel channel analysis reinforces this:
* The fact that the price is **above the middle line** of a multi-month parallel channel (Nov 2023 to April 2025) indicates **significant bullish strength and control by buyers**.
* This suggests **continued upside potential** within the channel, with the upper trendline acting as the next likely resistance/target.
* NVIDIA's fundamentals (AI dominance, strong earnings, innovation) continue to fuel this technical strength.
**Important Note:** While parallel channels are powerful tools, extreme parabolic moves can sometimes lead to channel breaks or sharp corrections. Always combine technical analysis with fundamental understanding, risk management, and your own due diligence. Given NVDA's recent surge, it's also important to consider if the stock is becoming overextended in the short term, even within a strong uptrend.
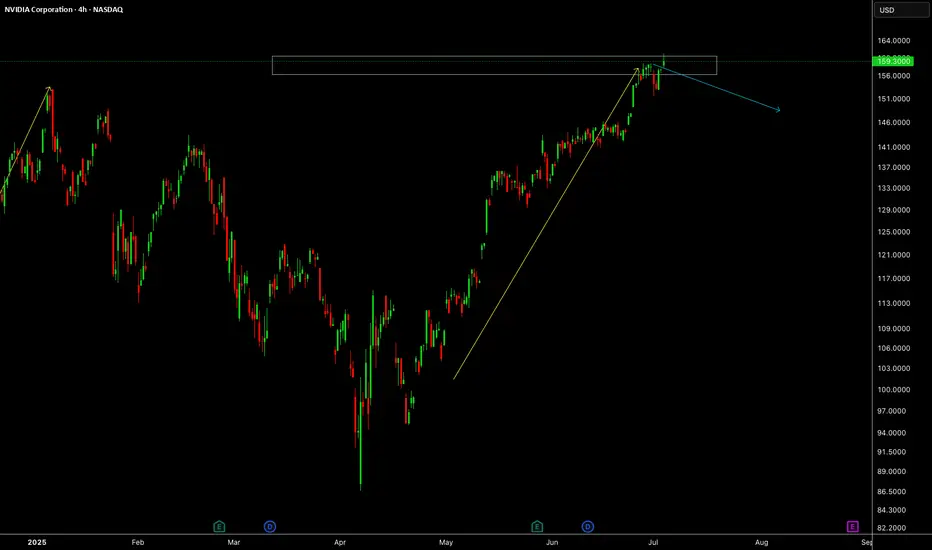
$NVDA has topped, new lows incomingNVDA has now topped, you can see that we've just formed another high time frame lower high and the rejection up here has the potential to create a strong bearish move.
I think it's very likely that the bearish move will take us all the way down to the bottom support before it's completed.
The bounce from the bottom went higher than I initially thought it would (which is why I'm creating a new chart), but price can't escape gravity and the same outcome is inevitable.
Let's see how it plays out over the coming weeks.
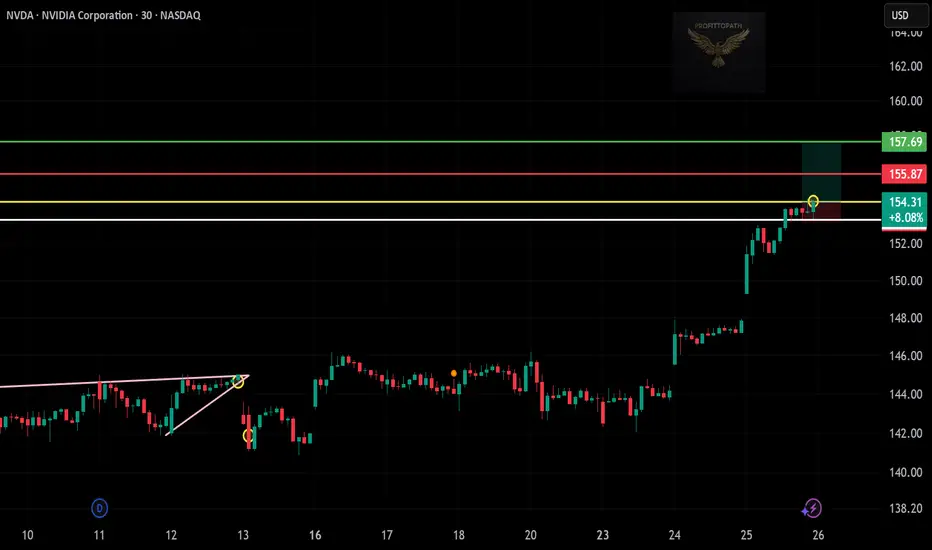
NVDA Breakout Mode! 📈🔥
🚀 Price flying above resistance zone 🟢
🎯 Target: $157.69 | 🔻 Stop: $155.87
⚡ Riding the AI wave with strength! 💡
📊 Chart powered by #ProfittoPath 📈
#NVDA #NVIDIA #AIStocks #BreakoutTrade #TradingView
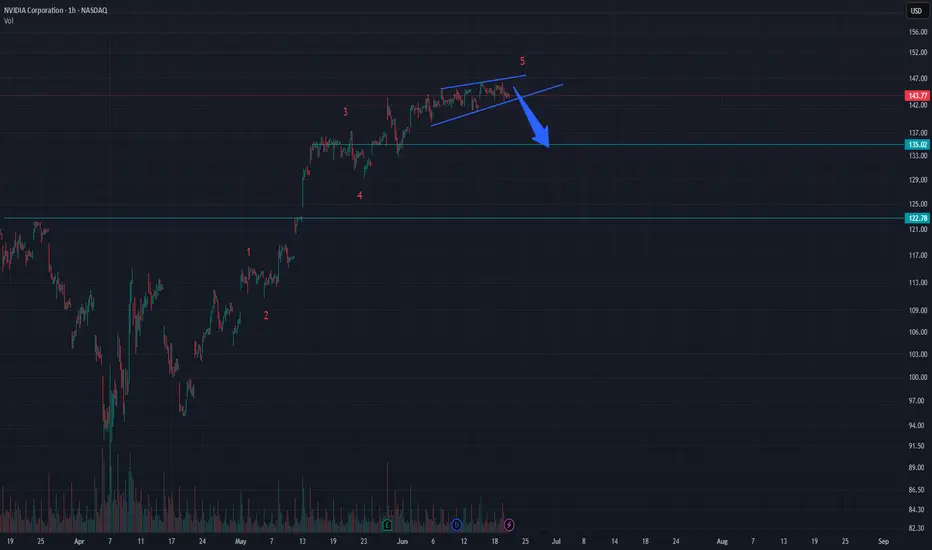
NVIDIA – Ending Diagonal Signals Wave 2 Correction Toward $135The intermediate-degree wave 2 may be completing with an ending diagonal structure near $143. This formation typically signals exhaustion in bullish momentum and often marks the end of a fifth wave.
If this diagonal holds and breaks downward, the minimum expected retracement lies around $135. A deeper move toward the $123–125 region is also possible, depending on the development of the correction.
Price currently stands at $143.77. A confirmed break below the diagonal’s lower boundary may trigger the wave 2 pullback.
📈 This analysis is based purely on Elliott Wave structure. No indicators or external tools were used.
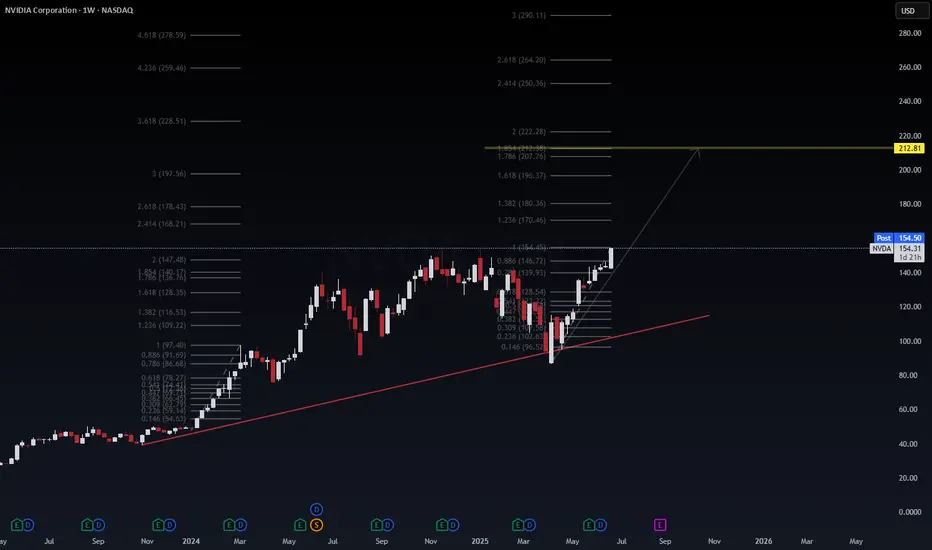
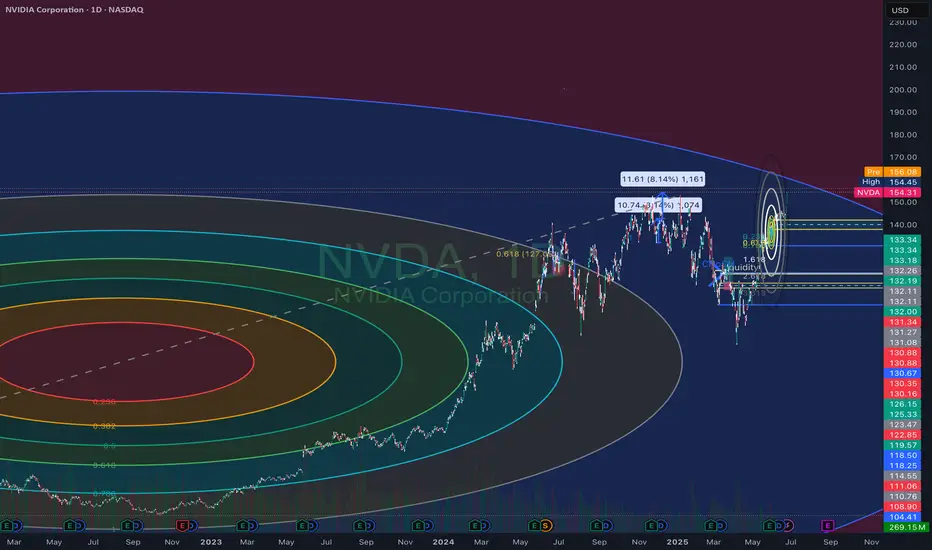
$NVDA | Fib Expansion Points to $212.81 → Is the AI Supercycle JWaverVanir International LLC | Weekly Fibonacci Roadmap
📅 June 25, 2025 | +7.27% Day | Post-Stock Split Momentum
NVIDIA ( NASDAQ:NVDA ) continues to dominate the AI-driven tech rally. After reclaiming the 1.618 Fibonacci level ($128.35), price has broken above the 0.886 retracement ($146.72) and is now pressing higher with bullish volume.
🧠 Fibonacci Insights:
🔺 1.786 Fib Extension: $207.76
🎯 Primary Target: $212.81 (Golden Projection)
🚀 Long-term Fib targets extend into $250–290+ zone (2.618–3.0 extensions)
🔻 Red trendline below signals well-respected diagonal support since early 2023
📊 Price Outlook:
Current Price: $154.31
Short-term Path: Bullish breakout → $168.21 → $178.43
Next Major Resistance: $212.81
Support to Hold: $139.93 / $128.35 (previous Fib clusters)
🧩 Catalysts Ahead:
Q2 Earnings (Late August 2025) – Focus on AI/data center revenue acceleration.
NVIDIA Blackwell GPU shipments – Institutional uptake will confirm pipeline robustness.
AI Sovereign Demand – U.S., UAE, Singapore and Saudi Arabia investing in GPU infrastructure.
AI Arms Race – Competitive moat widening vs. AMD, Intel.
AI App Ecosystem Expansion – Surge in demand for inferencing chips (L4, L40, GB200).
Post-Stock Split Rotation – Retail inflow and fresh institutional allocations.
📌 Summary:
NVIDIA is not just a chipmaker — it’s the core of the modern AI stack. With clear Fibonacci structure and geopolitical tailwinds, the next target is $212.81. Watch dips into $140s for potential reload zones.
🔖 Hashtags:
#NVDA #NVIDIA #AIstocks #WaverVanir #FibExtension #FibonacciTrading #AIboom #BlackwellGPU #GPUpower #PostSplit #TechLeadership #TradingView #SMC #AIarmsrace
Nvidia - 100% new all time highs!Nvidia - NASDAQ:NVDA - is just too bullish now:
(click chart above to see the in depth analysis👆🏻)
Honestly it was not unexpected that Nvidia is now the most valuable company in the world. The chart is just so strong and perfectly following structure; it seems to be just a matter of days until Nvidia will create a new all time high. If this happens, a breakout rally will follow.
Levels to watch: $150
Keep your long term vision!
Philip (BasicTrading)

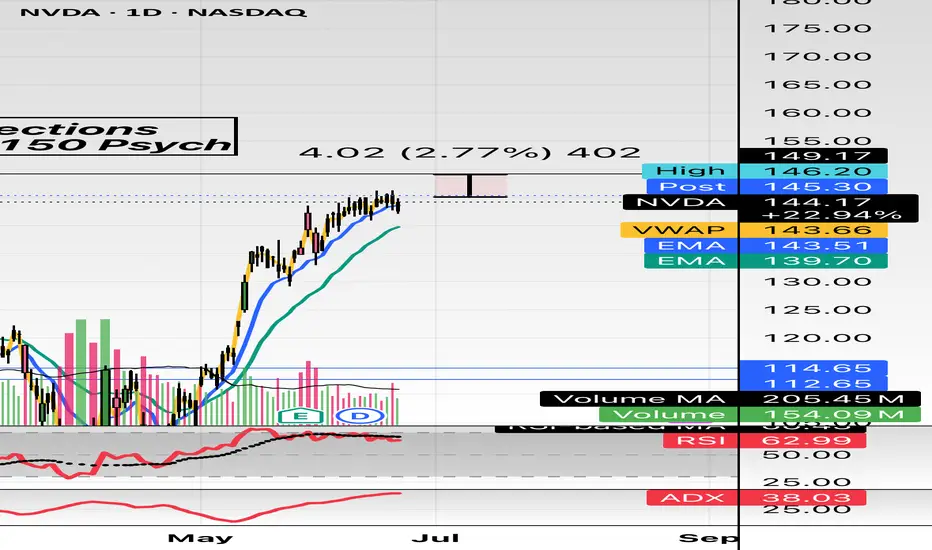
Nvidia (NVDA) Share Price Soars to Record HighNvidia (NVDA) Share Price Soars to Record High
Yesterday, Nvidia’s (NVDA) share price surged by over 4%, with the following key developments:
→ It broke through the psychological $150 per share level;
→ It reached a new all-time high;
→ It also contributed to the Nasdaq 100 index hitting a record peak, as we reported earlier this morning.
As a result, Nvidia has reclaimed its status as the world’s most valuable company. Demand for its shares is being fuelled by the CEO’s optimism.
“We have many growth opportunities across our company, with AI and robotics the two largest, representing a multitrillion-dollar growth opportunity,” said Jensen Huang at Nvidia’s annual investor conference.
Technical Analysis of the NVDA Chart
The last three candlesticks reflect strong demand, as:
→ There are bullish gaps between the candles;
→ Lower wicks are either absent or minimal;
→ Candles are closing near their highs with progressively widening spreads.
This suggests strong momentum as the price confidently breaks through the key $150 resistance level. It is reasonable to assume that the current imbalance in favour of buyers around the $146–150 area (highlighted in purple) may form a support zone in the event of a pullback — for instance, within the existing upward channel (shown in blue).
This article represents the opinion of the Companies operating under the FXOpen brand only. It is not to be construed as an offer, solicitation, or recommendation with respect to products and services provided by the Companies operating under the FXOpen brand, nor is it to be considered financial advice.
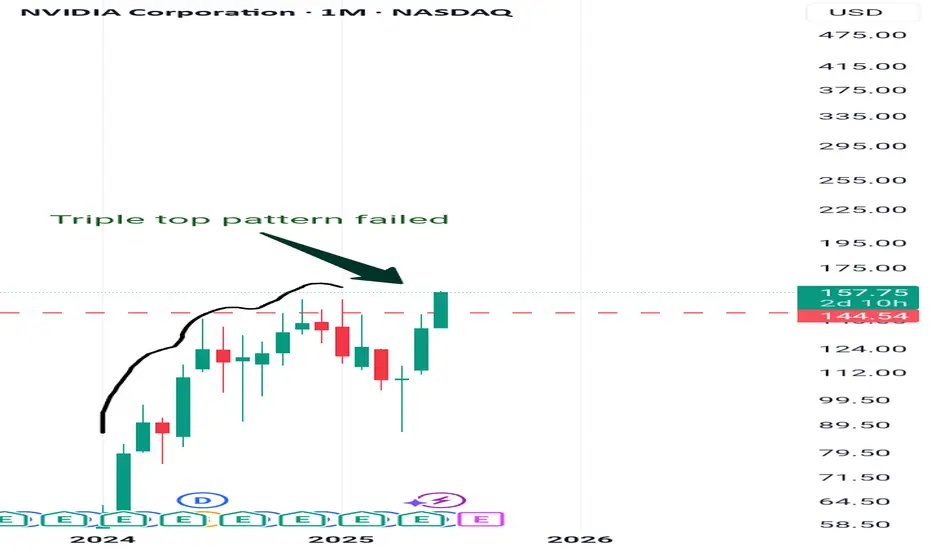
Triple top pattern failedTemporary postponement of repeat of the 1997 Eastern financial crisis by breaking the previous ceiling
Triple top pattern failed
Great outlook on NVIA reverse HSNVIDIA (NVDA) showing a reverse head and shoulders (H&S) pattern can be a very bullish technical signal — often implying a trend reversal from bearish to bullish.
Nvidia & Nasdaq History - What you need to know!Record-high share price: NVDA hit a new all-time high as U.S. stock markets rallied and Wall Street analysts forecast continued upside
Nvidia is pushing towards the first ever $4 Trillion market cap.
Today it surpassed MSFT as the largest company in the world closing up over 4% on the session.
Micron earnings are adding extra fuel to the fire for semi conductors.
Short term picture for semis - they're very extended and need some consolidation.
Micron earnings: Revenue: $8.05 billion, up ~38% YoY, beating the ~$7.89 billion consensus
Data‑center revenue: Tripled YoY, powered by surging demand for high‑bandwidth memory (HBM)
HBM sales: Exceeded $1 billion, growing over 50% sequentially
Strong margin and revenue beat; robust cash flow (~$857 million free cash flow) with a solid balance sheet ($9.6 billion in liquidity)

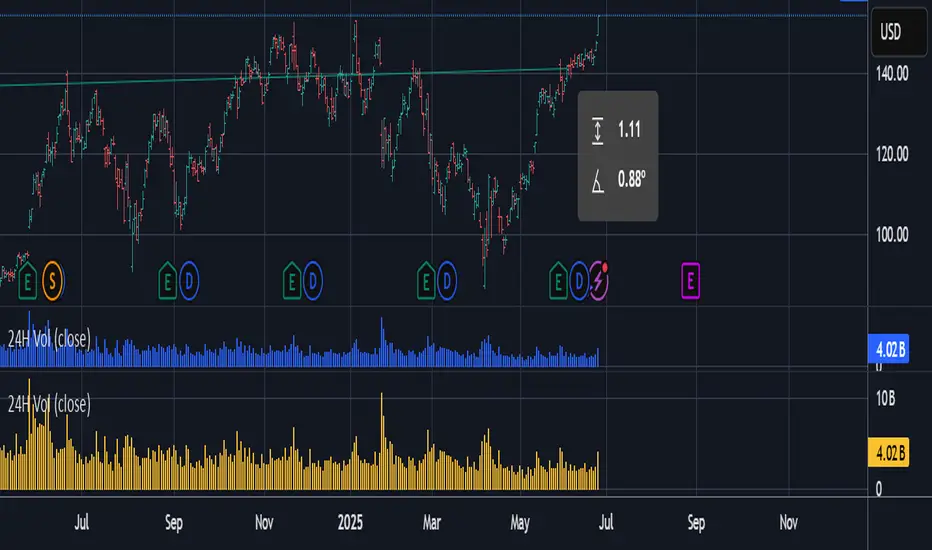
NVIDIA Corporation More Bullish Than BearishIt has been a while since we looked at Nvidia and here we have a mixed and tricky chart. I will try to make an accurate prediction nonetheless, watch!
It is tricky because the bullish move stalled and found resistance. The candles started to curve and there is little growth. Nothing to worry though. There is no retrace and the action is happening above 0.786 Fib. extension. This means that the action around resistance is likely to result in additional growth. Resistance is being weakened the more it is challenged.
If the bears were going to push prices lower they had their chance but nothing. If they tried, they failed and this is all bullish.
I predict NVDA will continue growing long-term. This goes in accordance with the analyzes I made back in early April of this year. We can expect a new all-time high in the latter part of 2025.
Summary
To me, the bullish bias is now confirmed. A continuation should happen in the coming days or weeks. Growth is expected long long-term.
Namaste.
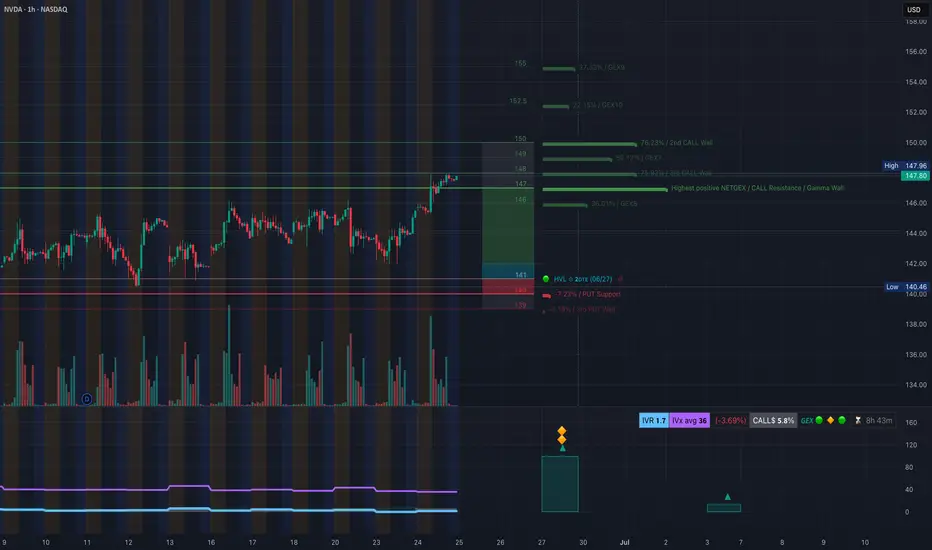
NVDA Heating Up: Gamma Walls Hint at 150+, Is This the Breakout?
📊 GEX Options Sentiment – Bullish Setup
The GEX (Gamma Exposure) landscape for NVDA shows strong bullish pressure:
* Highest Positive GEX & Gamma Wall at $147.80, which NVDA is testing now.
* Call Walls stacked at:
* $148.00 (59% GEX7)
* $149.00 (76.85% GEX8)
* $150.00 (76.23% GEX9)
* IVR: 1.7 (low implied volatility)
* Calls $%: 5.8%
* Sentiment: 🟢🟢🟢 (bullish)
This zone between 147.80–150 is a high-confluence area for a gamma squeeze, especially if NVDA can push and close above 148.00.
✅ Options Suggestion:
Consider 146C–150C (6/28 or 7/5 expiry) if NVDA reclaims 147.80 cleanly with volume. Low IVR makes this attractive for directional plays.
📉 1H Trading Plan – Price Action Analysis
On the 1H chart:
* Structure: Clean Break of Structure (BOS) after reclaiming previous resistance near 145.
* Current price is consolidating in a small supply zone (purple box) at highs.
* Trendline support from June lows is intact.
* Previous CHoCH levels and demand zone between 142–143 remain unbroken — a bullish structure.
Trade Scenarios:
🔼 Bullish Breakout Setup:
* Entry: Above 148.00 breakout (watch for volume confirmation)
* Target: 149.50 → 152.00 → 154.00 (top GEX zones)
* Stop: Below 145.00 (invalidates the breakout)
🔽 Bearish Fade (Only if rejection):
* Entry: Rejection from 148.00 with high volume + failed reclaim
* Target: 145.00 → 143.50
* Stop: Above 148.50
🎯 Final Thoughts
NVDA is sitting right under its gamma squeeze trigger. A breakout above 148 backed by GEX momentum could see a quick move toward 150+. This is a high-conviction zone — but don’t chase blindly. Watch price action around 147.80–148.00 for confirmation.
This analysis is for educational purposes only and not financial advice. Trade at your own risk and always use proper risk management.
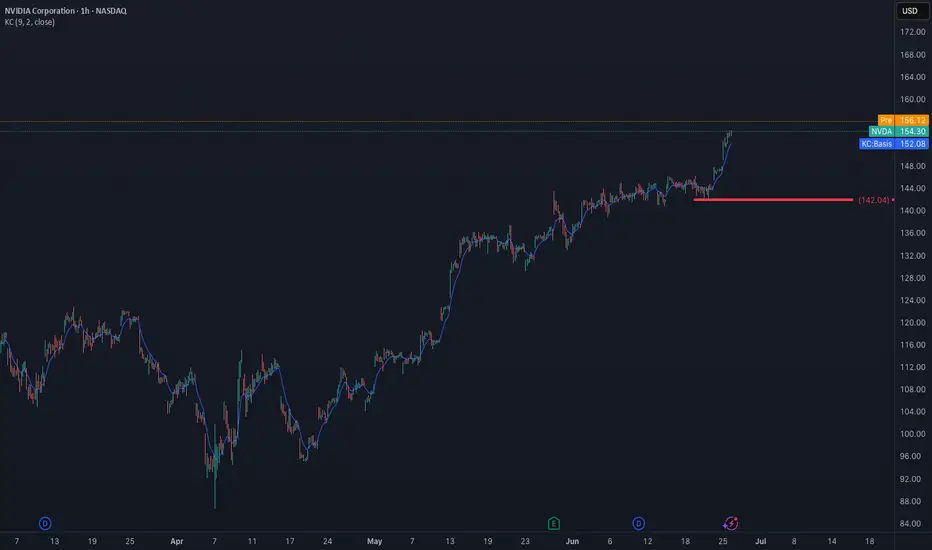
NVDA is still the leader making new ATHNASDAQ:NVDA is making new highs. When will it stop? A sign of weakness would be a break of my LIS at 142. It’s that simple, if you are long don’t panic sell early. Wait for a sign looking at my levels.
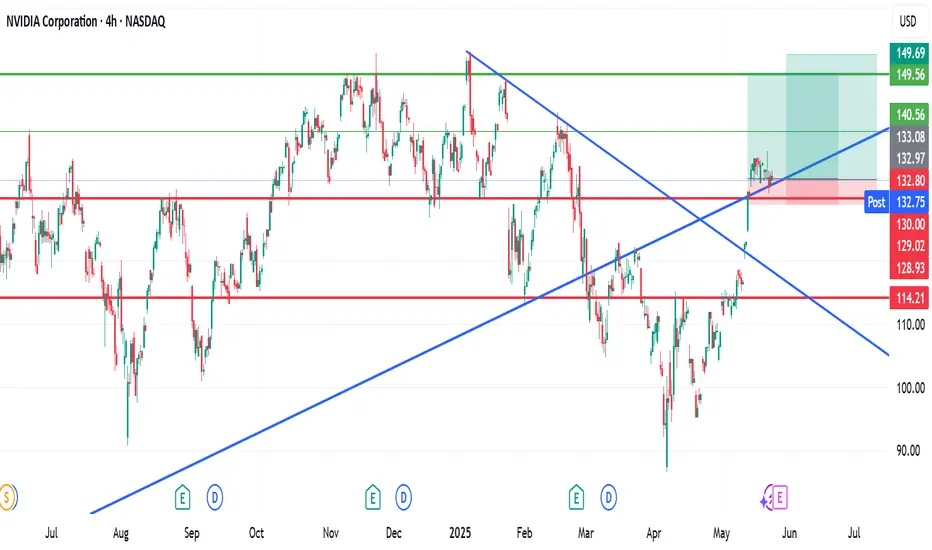
My buy view for NVDAMy buy view for NVDA.
Nvidia has made a significant push up after the meltdown following the new US tariff news.
The push-up is likely cooling off for this baby.
If the current consolidation continues to be sustained by the support zone (TL) in this zone, we are likely to see NVDA rally to $149 and $152 as TP1 and TP2, respectively.
My SL will be around $128.9 zone for both.
RR of 1:4 and 1:4.8
Trade with care
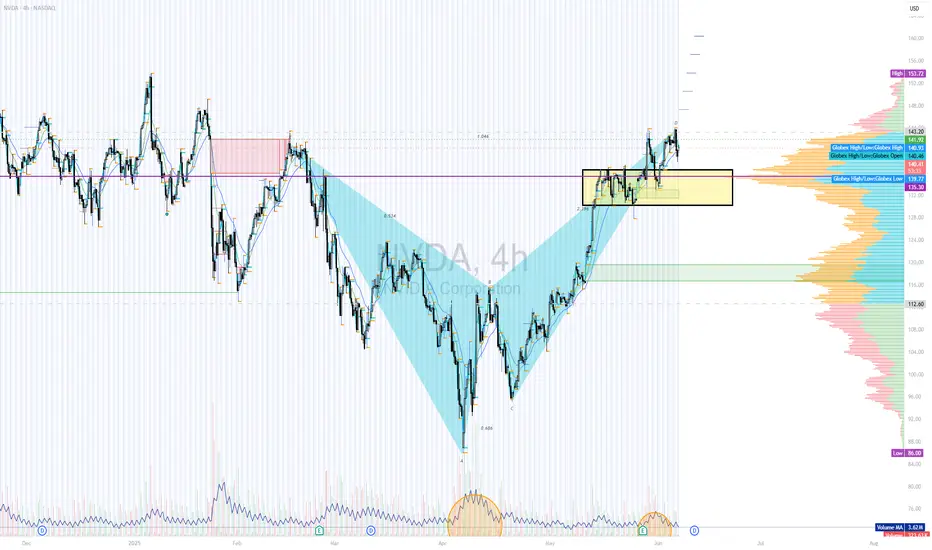
NVDA DECISION TO MAKE watching NVDA on breakdown or failure of breakdown Harmonic. increased volume at double bottom and D PRZ suggests to me this will not breakdown, but i dont think it wont chop away my confidence either. ill just wait for the direction.
$NVDA 6/27 exp week; $150 calls. Quick ChartHello. Market is moving up off the “news” of “ceasefire” from Trump. Take what is given I suppose. NASDAQ:NVDA could see a beautiful upside towards the psych level of $150 in just one session (Tuesday, 6/24) which is just a “small” move of 3%. Could break out of its rising wedge. This name has been lackluster as of late (kinda sorta). $150 calls will be entered at open (6/24) and my first target will be $148.98. There are multiple rejections at these levels. Good luck!
WSL
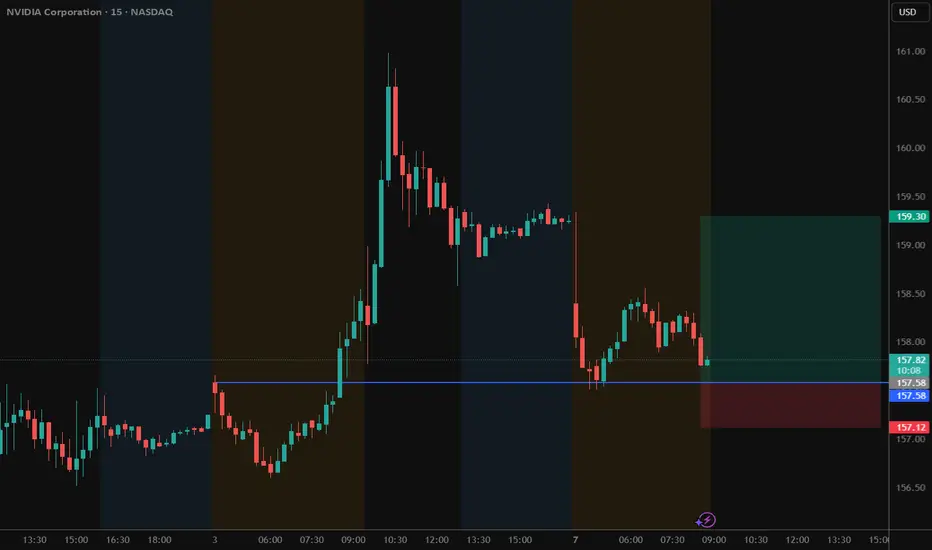
(NVDA) Long Pre-Market position off of previous support. Should wick down, grab liquidity then continue upwards.
How To Spot The Breakout In 3 Steps Or More..In this video we dive into how to spot the breakout
but here is a catch we are using the Stochastic RSI
to spot these breakouts.
Also this spotting of these breakouts is happening
together with the Rocket booster
strategy.
Watch this video to learn more.
Disclaimer:Trading is risky please learn risk management and profit
taking strategies.Also feel free to use a simulation trading account
before you trade with real money.

NVIDIANVIDIA is due for correction, anytime it can start. This week probably would be a good week to start the correction.
Disclosure: We are part of Trade Nation's Influencer program and receive a monthly fee for using their TradingView charts in our analysis.