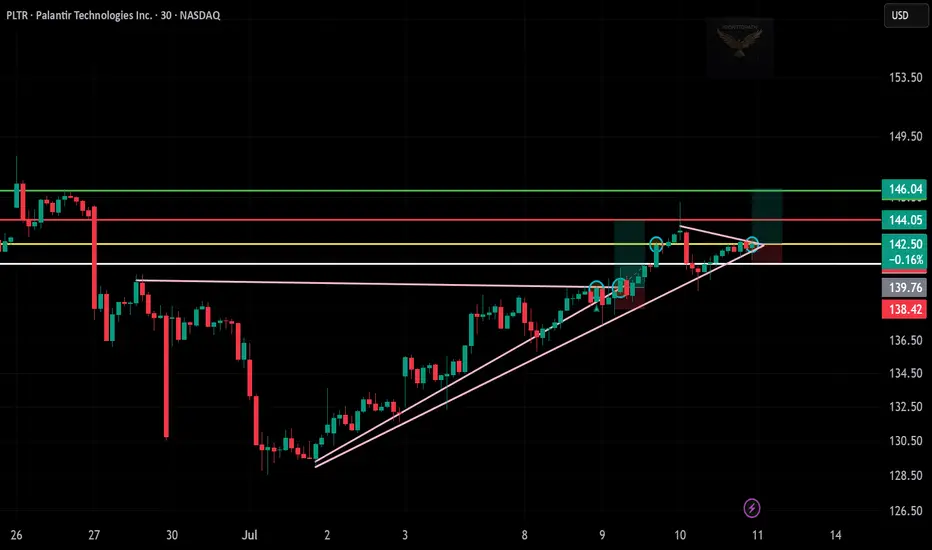
PLTR Trade Update – July 11, 2025📅
PLTR held the breakout like a champ. ✅ After a clean move through the triangle resistance yesterday, today’s price action continues to build strength above $142.50.
🔼 Bulls are in control, riding the momentum with higher lows and tight consolidation near breakout levels.
🎯 Targets remain firm at $144.05 and $146.04.
🛡️ Stop-loss still protected below $139.76 — trade remains active and technically strong.
The structure is bullish, volume supports the trend, and PLTR could be gearing up for the next leg higher. Watching closely for a push into resistance zones.
🔍 Strategy: Breakout Continuation
📊 Sentiment: Bullish & Confident
💡 Holding long — eyes on the volume and breakout follow-through.
PLTR trade ideas
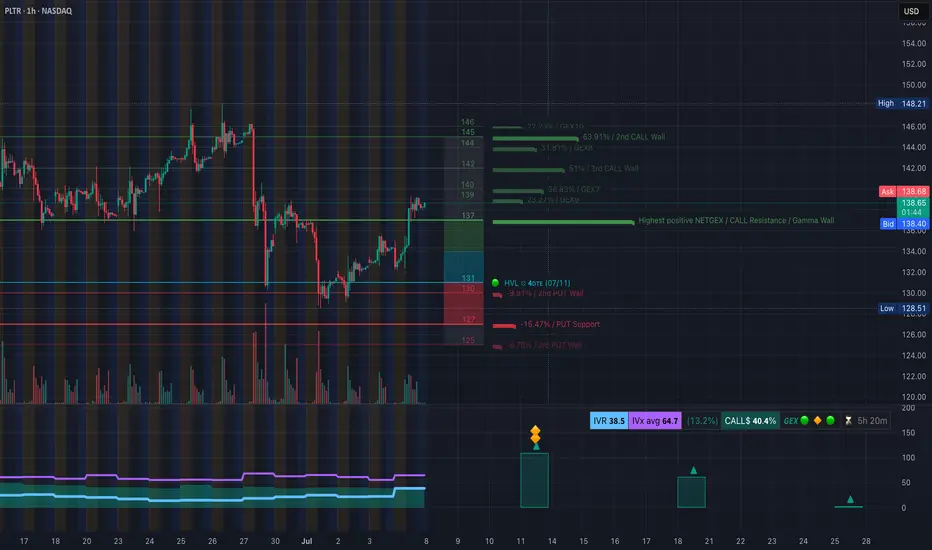
GEX-Based Options Sentiment GEX-Based Options Sentiment (as of July 7)
* Current Price: $138.69
* Highest Gamma Resistance (Call Wall): $139 → heavy OI + positive NetGEX → magnet + possible rejection
* Next Call Walls:
* $142 (GEX7, 51%)
* $144–146 stacked (GEX8–10) — breakout potential zone if $139 clears
* Put Wall + Support Stack:
* $131 (HVL for 7/11 expiry)
* $128, $127 → deep support zones
* Net GEX Bias: Mildly bullish short-term
* IVR / IVX:
* IVR = 38.5 (low)
* IVX = 64.7 avg
* Flow Tilt: 40.4% CALLs → Balanced, but leaning risk-on
📌 Option Trade Thoughts:
If PLTR clears and holds above $139, expect potential squeeze toward $142–$144 zone. Good setup for short-dated directional calls (0DTE or 2DTE) targeting $140–$142 with tight stops.
Below $135.5–134 = breakdown back into the lower GEX zone → bearish PUT play to $131–128.
Options Suggestion:
• Bullish Scenario: 140C or 142C (0DTE/2DTE) if $139 flips support
• Bearish Scenario: 134P or 132P if price fails to reclaim $139 and breaks $135.5
Keep risk small — IV is relatively low so premiums still reasonable.
📉 1-Hour Price Action and SMC Outlook
* Structure: PLTR in a rising channel with clean higher lows
* CHoCH → BOS confirmed: Valid short-term bullish structure
* Current Zone: Consolidating under resistance ($139), forming ascending pennant inside channel
* Support Levels:
* $135.62 → prior CHoCH and EMA confluence
* $134.36 and $132.20 as deeper pullback supports
* Volume: Rising on pushes, fading on retrace → healthy structure
🎯 Trade Setup Ideas:
Bullish:
* Entry: $139 breakout with volume
* Target: $142 → $144
* Stop: Below $135.5
Bearish:
* Entry: Rejection at $139 and break back below $135.5
* Target: $132.2 → $130
* Stop: Above $139.50
📈 Watch for confirmation of breakout or rejection from this wedge. Patience is key.
🧠 My Take:
PLTR is at a decision point — either breakout and trend to mid-$140s, or fakeout and retrace to reload lower. GEX stack shows resistance is thick but not extreme. Smart Money Concepts (CHoCH + BOS + channel structure) suggest bullish bias is intact — but we need confirmation over $139.
Disclaimer:
This analysis is for educational purposes only and does not constitute financial advice. Always manage your risk and do your own research before trading.
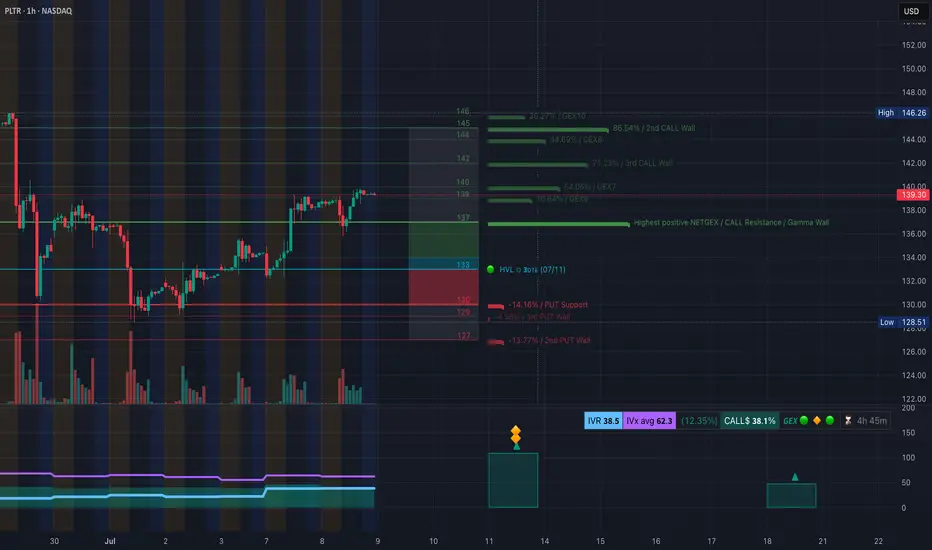
PLTR Approaching Key Gamma Resistance–Will 140 Break or Reject?🔍 Options Sentiment (GEX Analysis):
PLTR is pushing into a high gamma zone with notable resistance from options positioning:
* Call Walls are stacked at 140, 142, and 145, with the 145 line aligning with a GEX10 and 2nd Call Wall (86.54%). This suggests significant overhead resistance and a possible hedging zone.
* Gamma flip zone is near 137, where the Highest Positive NETGEX sits — this acts as a pivot or support.
* Below 133, a Put Wall at 130, along with -14.16% NetGEX, offers clear downside targets if bulls lose momentum.
Implied Volatility Data:
* IVR 38.5 / IVx avg 62.3 – Implied volatility is relatively compressed.
* Call positioning is dominant at 38.1%, with GEX showing a ⚠️ yellow signal and diamond risk signals forming — indicating risk of volatility expansion.
🧠 Options Trade Ideas:
Bullish Case (Momentum breakout):
* If PLTR clears 140 with volume, a breakout toward 144–146 is possible.
* Suggested trade:
* Buy 145C or 150C (next week) on breakout + momentum confirmation.
* Ideal for gamma squeeze into overhead walls.
* Cut below 137.
Bearish Case (Rejection & fade):
* Rejection below 140 + shift under 137 would invalidate gamma support.
* Suggested trade:
* Buy 135P or 130P, looking for unwind down to 133 → 130.
* Cut if PLTR reclaims 140 and holds.
⏱ 1-Hour Price Action Analysis (Intraday to Swing Trading):
PLTR has been climbing steadily within a rising wedge channel, forming higher lows and breaking previous CHoCH/BOS zones.
* Recent CHoCH → xBOS confirms bullish intent but we’re currently at a potential short-term supply zone.
* Price is near structural resistance at 139.30–140, while remaining above the ascending trendline support.
📌 Key Levels:
* Resistance: 140 → 142 → 145
* Support: 137 (pivot), 133 (gap/FVG), then 130
* Trendline Support: Ascending, unbroken since early July
💡 Trading Outlook & Strategy:
* This is a "make-or-break" zone — bulls must clear 140 to unlock upside toward 144–146 (in line with call walls).
* Failure to break this level likely triggers profit-taking, especially if macro headwinds align.
* A pullback to 133–137 could provide a clean dip-buy zone, but a breakdown below 133 opens room to 130 and beyond.
✅ Actionable Strategy:
* Break & Hold Above 140 = Long setup
* Target 144/146
* Stop below 137
* Failure at 140 + Break Below 137 = Short setup
* Target 133/130
* Stop above 140
Disclaimer: This analysis is for educational purposes only and does not constitute financial advice. Always do your own research and manage risk carefully.
PLTR DUMP INCOMINGdump it dump it dump it.
huge resistance off yearly level. gap on daily chart. Untested levels acting as a magnet lower. Dump it.
Earnings HFT gapsThe gaps that form during earnings season on or the next day after the CEO reports the revenues and income for that past quarter are always HFT driven. The concern over the past 2 previous quarters was the fact that the High Frequency Trading Firms were incorporating Artificial Intelligence into their Algos to make automated trading decisions on the millisecond scale. These small lot orders fill the ques milliseconds ahead of the market open in the US and any huge quantity of ORDERS (not lot size) causes the computers of the public exchanges and market to gap up or gap down, often a huge gap.
This can be problematic for those of you who use Pre Earnings Runs to enter a stock in anticipation of a positive to excellent earnings report for this upcoming quarter.
The HFT algos had several major flaws in the programming that did the opposite: The AI triggered sell orders rather than buy order causing the stock price to gap down hugely on good earnings news.
Be mindful that normal gaps due to a corporate event are far more reliable and consistent.
When you trade during earnings season, be aware that there is still added risk of an AI making a mistake and causing the stock to gap and run down on good news.
It is important to calculate the risk factors until it is evident by the end of this earnings season that the errors within the AI programming have been corrected and that the AI will gap appropriately to the actual facts rather than misinterpreted information.

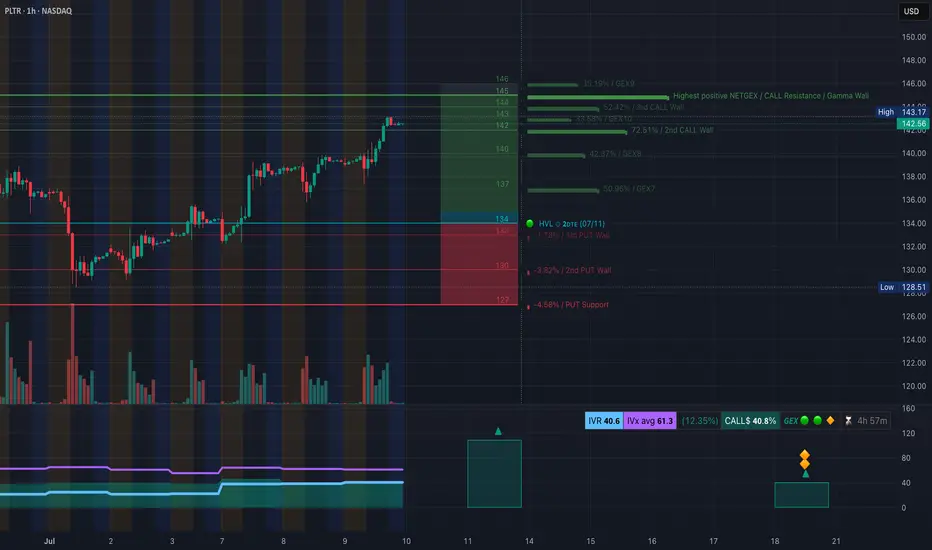
PLTR Poised for Gamma Squeeze? Here's the Key Setup-July 10📈 GEX Options Sentiment & Trade Strategy
Palantir (PLTR) is pressing into a high-compression zone on the Gamma Exposure (GEX) chart, where multiple call walls cluster between 143 → 146, with the strongest net positive GEX wall at 146, acting as the gamma squeeze ceiling. The 3rd call wall sits at ~145, and momentum is building with IVR 40.6, IVx avg 61.3, and a strong 40.8% bullish call-dollar dominance, signaling sustained call flow.
Crucially, there’s minimal put protection above current price, with most put walls far below at 130, 127, and a weak HVL at 133. This imbalance opens room for a potential gamma push toward 145–146, especially if the 143.17 intraday high breaks with volume.
💡 Options Trade Ideas:
* Bullish Setup:
145C (0DTE or 7/12 expiry) if price confirms over 143.50, targeting the 145–146 zone.
Ideal for a short squeeze continuation with trailing stops.
* Hedge/Defensive PUT:
135P if price rejects sharply at 143.50 and loses 140.5 support—risk-managed fade toward HVL at 134.
🔍 1H Chart Technical Outlook
PLTR is moving inside a rising wedge channel, maintaining a strong bullish market structure with back-to-back CHoCH → BOS confirming bullish intent. Price is consolidating under the supply zone near 143–144, coiled for a breakout attempt. The trendline holds firm, and volume is beginning to expand with each retest.
If price breaks and holds above 143.20, bulls can target 146, and even higher toward the channel resistance near 148.21. However, caution: a false breakout here could trap late bulls, so monitor for retest confirmation before chasing.
Support to watch sits at:
* 139.70 / 139.30 – minor support zone
* 137.40 – EMA + trendline confluence
* 134.52 / 133.00 – critical HVL and invalidation zone
✅ Summary & Trade Plan
* Bias: Bullish with gamma momentum, but nearing exhaustion zone
* Breakout Trigger: Above 143.20 → ride the gamma zone to 145–146
* Key Support: 139.70 / 137.40 (hold = healthy trend)
* Invalidation: Break below 134 = game over for bulls short-term
This analysis is for educational purposes only and does not constitute financial advice. Always do your own research and manage your risk accordingly.
PLTR temporary top?Bearish case
Monthly RSI at 91
Weekly candles encountering resistance
Daily candles under the 20 day SMA
Bullish case
Monthly candle not a clear bearish candle, no monthly volume spike or no monthly RSI double top like SMCI and no bearish divergence detected yet.
Weekly no continuation down after first 2 red weekly candles
Daily volume spike suggest temp bottom
Conclusion
Let's see the next weekly candle from July 7 to 11.
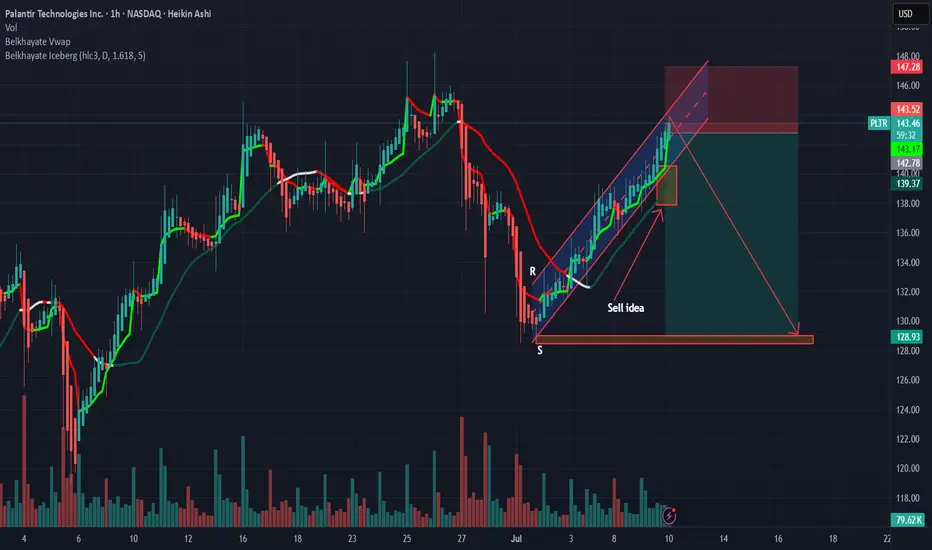
PLTR: Sell ideaSell idea on PLTR as you can see on the chart if and only if we have the breakout with force
the Belkhayate Iceberg, the vwap and the support line by the sellers.
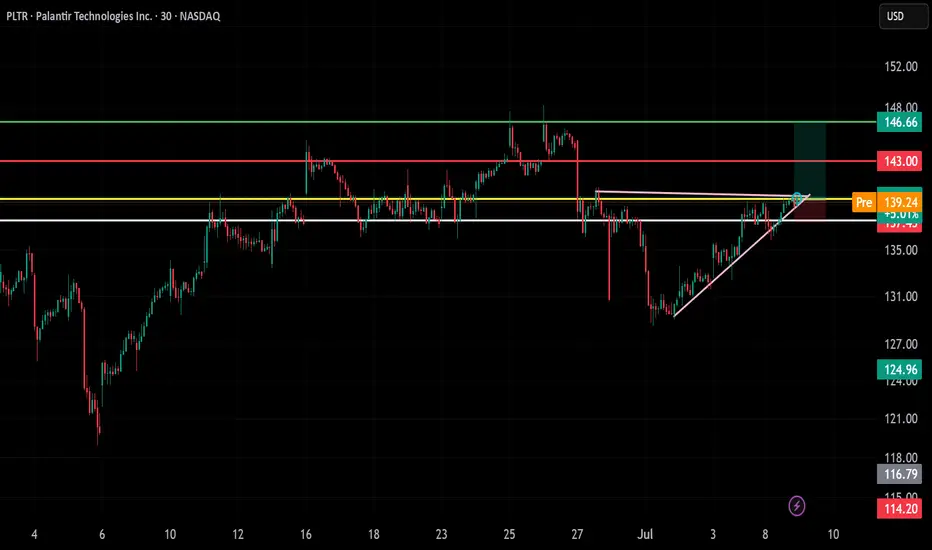
Trade Reflection – PLTR Long Setup🧠
Lately, I’ve been focusing on breakouts from key resistance levels supported by ascending trendlines. Today’s trade on NASDAQ:PLTR was a textbook example.
📈 Ticker: PLTR
🔁 Trade Type: Long
🕒 Timeframe: 30-min
📍 Entry Zone: $139.24 (Pre-market breakout)
🎯 Target: $146.66
🛑 Stop Loss: Below $137.00
🔍 Why I Took This Trade:
Price was consolidating right below strong horizontal resistance around $139.
An ascending trendline formed over the past few sessions, creating bullish pressure.
Clean breakout with volume and confirmation on retest.
🧠 What I Learned:
Waiting for confirmation at resistance breakout is key.
Clean structure + trendline + consolidation = high-probability setup.
Reward-to-risk ratio was favorable, with room to $146.
✨ Whether this trade hits TP or not, the setup followed my plan. That’s a win.
📊 Logging and reviewing setups like this helps me stay disciplined and improve daily.
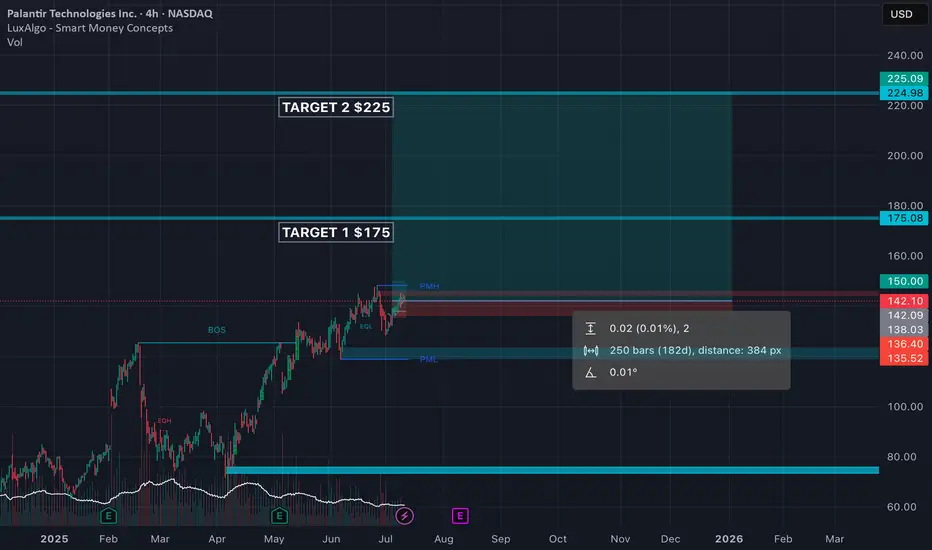
PLTR - Palantir Technologies: Why PLTR is the Perfect PlayExceptional Performance Leadership
Palantir Technologies has established itself as the undisputed champion of the U.S. stock market in 2025. The stock has delivered extraordinary returns of 402.92% over the past 12 months and 87.89% year-to-date, making it the best-performing stock in both the S&P 500 and Nasdaq-100 indices. Currently trading at $142.10, the stock has surged from lows around $21, representing one of the most dramatic momentum plays in modern market history.
Powerful AI-Driven Revenue Growth
The company's financial performance has been nothing short of spectacular. Palantir's U.S. commercial AIP (Artificial Intelligence Platform) revenue has surpassed a $1 billion annual run rate with 71% year-over-year growth. The company reported Q1 2025 revenue of $883.86 million, beating consensus estimates and growing 39% year-over-year. This growth trajectory is being driven by unprecedented demand for AI solutions across both commercial and government sectors.
The company's customer base has expanded to 769 total customers, up 39% year-over-year, with 44% of revenue now coming from commercial clients. This diversification away from pure government dependency represents a significant strategic achievement that provides multiple growth vectors.
Strategic Government AI Dominance
Maven Smart System Contract Expansion
Palantir's government business has reached new heights with its Maven Smart System contract being increased by $795 million, bringing the total value to over $1.3 billion through 2029. Pentagon leaders boosted the contract citing "growing demand" for the system across all military branches, including the Army, Navy, Air Force, Space Force, and Marine Corps.
Stargate AI Initiative Leadership
The company holds a central position in the $500 billion Stargate AI infrastructure project, positioning it as a backbone for America's AI future. This initiative represents one of the largest technological undertakings in U.S. history, designed to establish domestic AI superiority and reduce reliance on foreign systems.
Strategic Partnerships
Palantir has formed landmark partnerships with Microsoft for classified AI deployment and Accenture Federal Services for comprehensive government AI implementation. These alliances significantly expand the company's reach and delivery capabilities across the federal ecosystem.
Technical Momentum Confirmation
Bullish Technical Setup
The stock exhibits exceptional technical strength with multiple confirmation signals:
Moving Average Alignment : All major moving averages (20-day, 50-day, 200-day) are positioned bullishly below the current price, indicating sustained upward momentum
RSI Positioning: At 58.42, the RSI shows healthy momentum without being overbought, providing room for continued advancement
Volume Confirmation: Recent trading volumes have consistently exceeded 50 million shares daily, indicating strong institutional participation
Golden Cross Pattern: The 50-day moving average at $131.9 remains above the 200-day moving average at $101.7, confirming the bullish trend
Breakout Pattern
The stock has successfully broken above the $140 resistance level with strong volume, targeting the $175-$220 range based on technical analysis. The pennant pattern breakout above $140 has been confirmed by institutional buying pressure and retail momentum.
Institutional Investment Surge
Record Institutional Participation
Institutional ownership has reached 45.65% of outstanding shares, with $19.19 billion in institutional inflows over the past 12 months versus only $10.43 billion in outflows. This represents a net institutional buying pressure of nearly $9 billion, demonstrating strong professional investor confidence.
Premium Analyst Coverage
Wedbush Securities has raised its price target to $160, calling Palantir the "Messi of AI" and positioning it as a top pick in their "IVES AI 30" list. The firm sees Palantir's AIP platform as foundational for the trillion-dollar AI spending wave and believes the company has a "golden path to become the next Oracle".
Competitive Advantages and Market Position
Architecture-Agnostic Platform
Palantir's AIP is architecture-agnostic, seamlessly integrating with both centralized cloud systems and decentralized frameworks. This versatility allows the company to serve diverse client needs across multiple sectors, from government defense to commercial healthcare.
Network Effects and Data Flywheel
The company benefits from powerful network effects where more customers generate more data, which improves AI models and increases retention rates. This creates a self-reinforcing competitive advantage that becomes stronger over time.
Government Moats
Palantir's deep government relationships and security clearances create substantial barriers to entry. Multi-year government contracts provide revenue stability and growth visibility that few technology companies can match.
Financial Strength and Profitability
The company has demonstrated seven consecutive quarters of GAAP profitability with expanding margins. Adjusted operating margins have improved to 36% in Q1 2025 from 29% previously, showing operational excellence alongside revenue growth. The company maintains a strong balance sheet with $4 billion in cash and equivalents.
Investment Thesis Summary
Palantir Technologies represents the perfect convergence of momentum, fundamentals, and catalysts that defines exceptional investment opportunities:
Momentum Factors:
402.92% twelve-month returns leading all major indices
Continuous institutional accumulation with $9 billion net inflows
Technical breakout above key resistance with volume confirmation
Fundamental Catalysts:
$1 billion+ AIP commercial revenue run rate with 71% growth
$1.3 billion+ government contract pipeline expansion
Central role in $500 billion Stargate AI infrastructure initiative
Strategic Positioning:
Architecture-agnostic platform creating multiple market opportunities
Government relationships providing defensive moats and growth visibility
Network effects and data flywheel creating competitive advantages
Risk-Adjusted Opportunity:
Clear support levels at $137-$140 range providing defined risk parameters
Multiple price targets ranging from $155-$220 suggesting significant upside potential
Strong balance sheet and cash generation providing downside protection
Palantir Technologies embodies the rare combination of explosive growth, defensive positioning, and strategic importance that creates generational investment opportunities. The company's leadership in AI government applications, combined with accelerating commercial adoption, positions it as a cornerstone holding for the AI revolution.
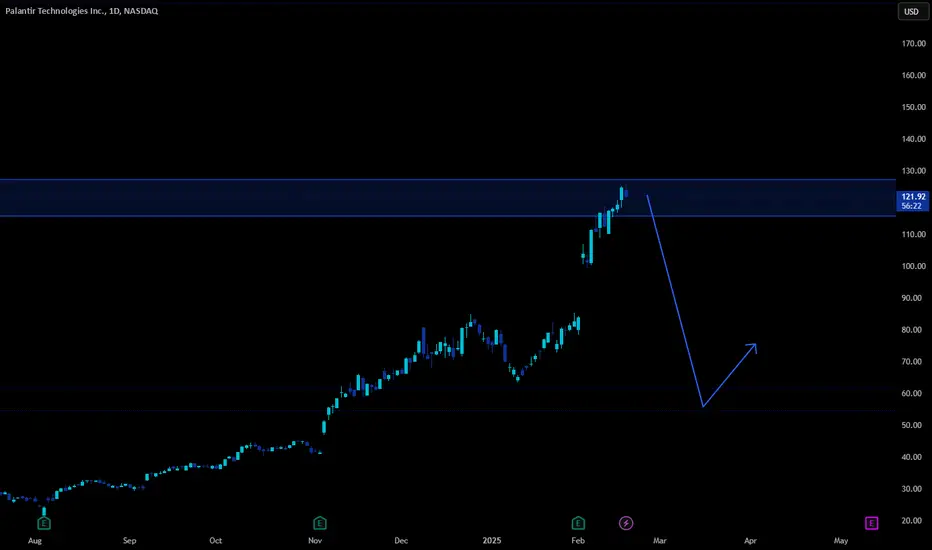
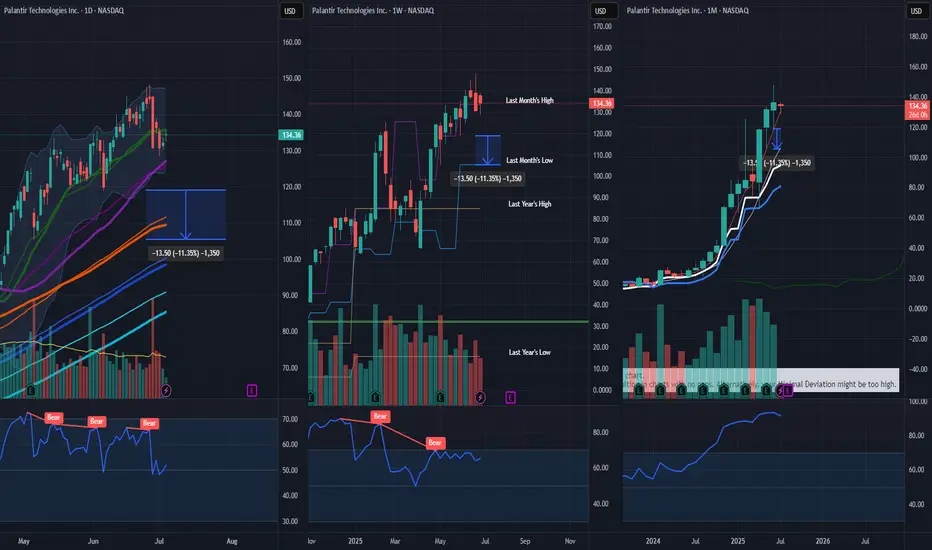
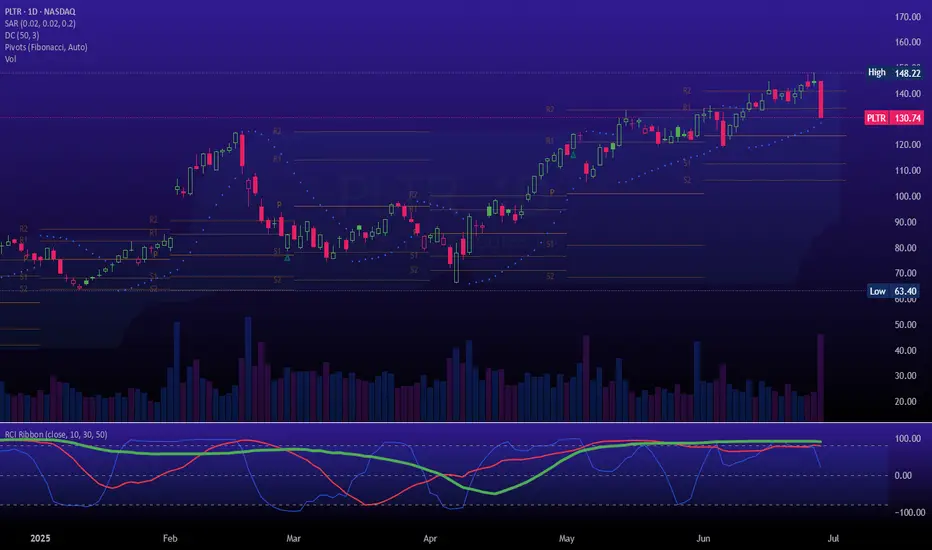
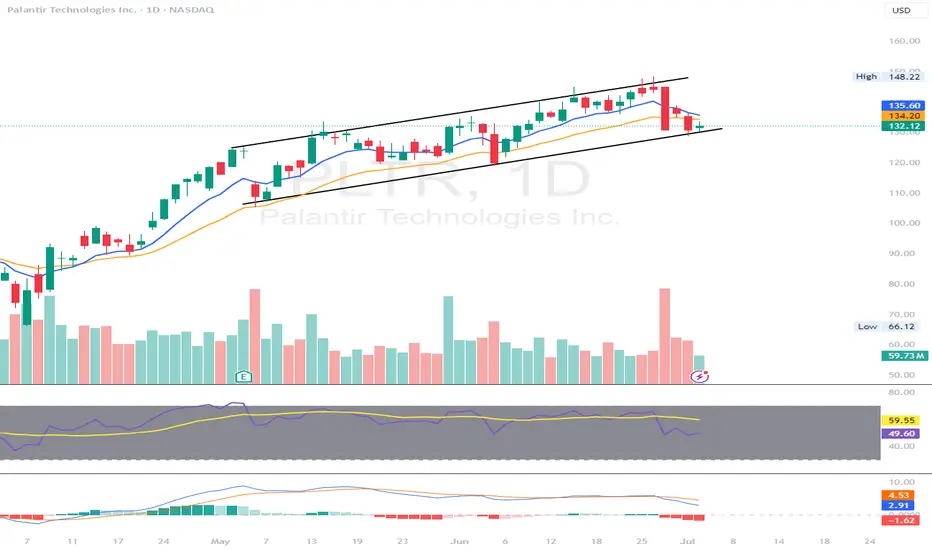
PLTR just started the first phase of the Wyckoff distributionBased on the weekly and daily charts provided for Palantir (PLTR), here is a Wyckoff analysis and a corresponding diagonal option spread strategy.
### **Wyckoff Phase Analysis of PLTR**
From the price and volume action on the charts, **PLTR appears to be in the initial stages of a Wyckoff distribution phase (Phase A)**. This phase marks the stopping of the prior uptrend.
* **Weekly Chart:** The long and powerful uptrend is characteristic of a **Markup** phase. However, the recent price action shows a significant change. The peak near $148.22, followed by a sharp decline, can be interpreted as a **Buying Climax (BC)** and an **Automatic Reaction (AR)**. This is a classic sign that large institutions ("smart money") may be starting to sell or distribute their shares.
* **Daily Chart:** The daily chart shows a failure to make new highs, followed by a very sharp sell-off on a spike in volume. This represents a significant **Sign of Weakness (SOW)** and confirms that the character of the market has changed from bullish to potentially bearish or neutral. The uptrend has been broken.
In summary, the strong upward momentum in PLTR has halted, and the stock is showing clear signs of entering a distribution or consolidation phase at these higher prices.
### **Trading PLTR with a Bearish Diagonal Put Spread**
Given the analysis that PLTR is entering a distribution phase, a neutral to bearish outlook is appropriate. A **bearish diagonal put spread** is a suitable strategy to profit from a potential decline in price or even from the stock trading sideways, as it benefits from time decay.
This strategy involves buying a longer-dated, in-the-money (ITM) put option and selling a shorter-dated, out-of-the-money (OTM) put option.
**How to Structure the PLTR Trade (Current Price ~ $130.74):**
1. **Buy a Long-Term Put:**
* **Action:** Buy to open a put option.
* **Expiration:** Choose a later expiration, for example, **4-6 months out**, to give the distribution and potential markdown phase time to develop.
* **Strike Price:** Select an in-the-money (ITM) strike to create a bearish position. A strike price around **$140 or $145** would be appropriate.
2. **Sell a Short-Term Put:**
* **Action:** Sell to open a put option.
* **Expiration:** Select a near-term expiration, typically **30-45 days away**.
* **Strike Price:** Choose an out-of-the-money (OTM) strike below the current price. For instance, selling the **$120 strike** would provide income and define your risk.
**Example Trade (Illustrative Purposes Only):**
* **Buy 1 PLTR put with an expiration 5 months away at a $140 strike.**
* **Sell 1 PLTR put with an expiration in 35 days at a $120 strike.**
The objective is for the short put to lose value from time decay and expire worthless, allowing you to keep the premium. This premium reduces the cost of your long-term bearish put. You can then sell another short-term put for the following month to continue generating income against your long-term bearish position.
> ***Disclaimer:*** *This content is for informational purposes only and should not be construed as financial advice. Options trading involves substantial risk and is not appropriate for all investors. Please conduct your own research and consult with a qualified financial professional before making any investment decisions.*
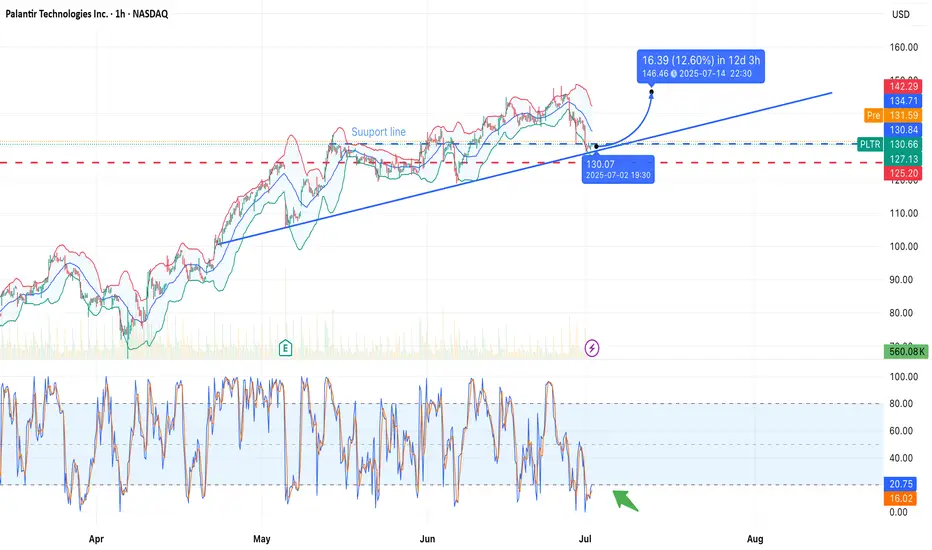
Palantir Technologies (PLTR) — Bounce in Progress?NASDAQ:PLTR is testing a long-term ascending trendline near the $128.79 level, which also aligns with a horizontal support zone. A potential rebound is forming with a projected move toward $145.94 — a +13.32% gain in 12 days.
Technical Highlights:
• Support zone: $128.79 (trendline touch + horizontal level).
• Stochastic Oscillator: Deep in oversold territory — bullish crossover forming (green arrow).
• Bollinger Bands: Price pierced lower band — reversion to the mean is likely.
• Volume: Stable, with room for momentum pickup.
Targets:
• First resistance: $134.71
• Primary target: $145.94
• Stop level: below $127 (to invalidate bullish thesis)
PLTR at a Decision Point! for July 14GEX Walls and Wedge Breakdown Incoming?
🔸 GEX (Gamma Exposure) Breakdown for PLTR:
* Current Price: $141.99
* Key Gamma Resistance Zones:
* 📍 $145.15 – Highest Net Positive GEX (Gamma Wall)
* $144.58 – 2nd CALL Wall
* $146 – Overhead resistance from 2nd wall cluster
* Key Gamma Support Zones:
* $137 – HVL & 1st Put Layer
* $135 – 2nd Put Wall
* $132 – 3rd Put Wall
* $128.51 – GEX Low & Major Put Support
GEX Sentiment:
IVR: 39.3 (moderate)
IVx avg: 66.1
Options Flow Bias: CALL$ 56.7% – Slightly bullish
📈 Options Trade Strategy Based on GEX Zones:
🔹 Scenario A – Rejection from $145.15 (Most Probable):
* Bearish PUT Spread Play:
* Buy: $142.5 PUT
* Sell: $137 PUT (exp 7/19)
* Risk/Reward: Balanced downside toward HVL
* Trigger: If price stays below $142.5 and fails to reclaim $144.58
🔹 Scenario B – Breakout Above $145.15:
* Bullish CALL Play (speculative):
* Buy: $147.5 or $150 CALL
* Target: $155 (GEX9 zone)
* Only if: Price closes strongly above $145.5 on volume
🔸 GEX Outlook Summary:
* Upside capped at $146–$150 unless breakout volume enters
* Downside path to $135 / $132 is smoother if $140 breaks
* Gamma squeeze unlikely unless > $146
🧠 1-Hour Price Action & Intraday Trading Setup
⚙️ Market Structure:
* Trendline Support: Holding from recent rally
* CHoCH formed below resistance, suggesting a potential reversal
* BOS zone near $142.5–$144.6 creating supply
* Rising wedge breakdown forming
📊 Key Zones:
* Support: $140.53 (ascending trendline), then $137 (HVL)
* Resistance: $142.5 → $144.58 → $145.15
* Bearish Bias: As long as price is below $144.6
📉 Intraday Trading Plan (1H)
🔻 Short Setup:
* Entry: If price breaks below $140.50 with momentum
* TP1: $137
* TP2: $135
* Stop Loss: Above $144.60
🔼 Reversal Long (Less Probable):
* Entry: Break and hold above $145.15
* TP: $149.5 → $155
* SL: Below $143.5
🧭 Summary Thoughts:
* PLTR is sitting below strong GEX resistance with rising wedge weakness.
* Bearish structure forming unless bulls reclaim $145+ quickly.
* Favor PUT plays targeting $137–$135 unless breakout proves otherwise.
Disclaimer: This analysis is for educational purposes only and does not constitute financial advice. Always manage risk and do your own due diligence before trading.

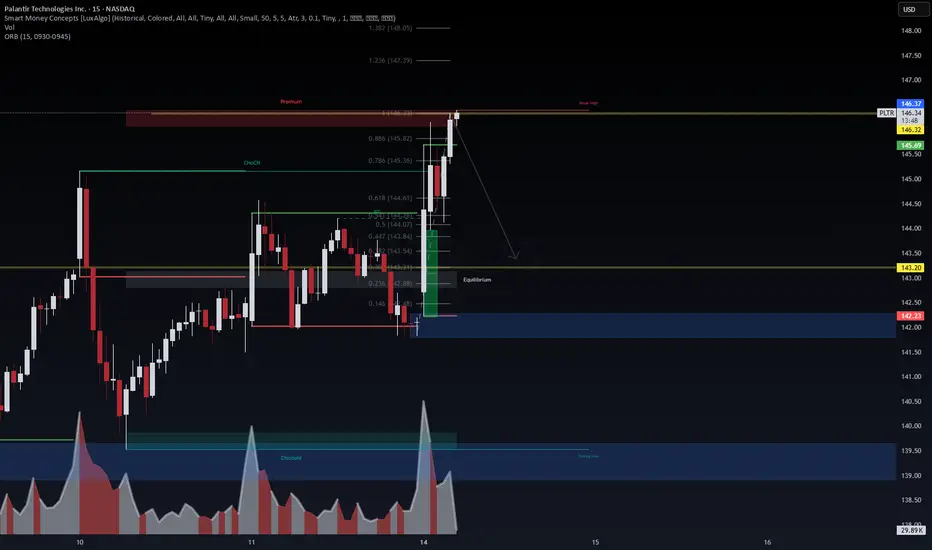
PLTR - Premium Rejection Detected | Bearish Flow Confirms Put🧠 WaverVanir DSS | 15-min SMC x Options Flow x Liquidity
Palantir ( NASDAQ:PLTR ) has just tapped the 0.886–1.0 Fibonacci zone inside the Premium zone near $146.32, where price wicked above the weak high. This aligns with key liquidity exhaustion, suggesting a short-term distribution phase.
Meanwhile, our scanner picked up notable $144 Puts expiring July 18:
🧾 3,500 contracts traded with IV at 80.4%
🔁 Volume > OI → fresh bearish positioning
📉 $2.76 premium → traders paying up to hedge downside risk
🧩 Trade Breakdown:
Price action: Smart Money Premium rejection from $146.32 with reversal wick
Volume: Spike into imbalance zone below $143.20 = next probable draw
Options Flow: Bearish bets on $144 puts line up with chart thesis
ORB (9:30–9:45): High at $145.69, rejected cleanly at structure
🧭 Target Zone: $142.23 (discount block)
🚨 Risk Level: Above $146.50 invalidates short idea
PLTR local top $150Palantir has has a nice run but this could be a local top. Reasons include hitting peak Trendline + hitting 2.618 fib + plus hitting #5 fib time zone. Also BTC appears to hit it's ATH Trendline today as well. So is everything hitting its local top before Trumps Liberation Day II on Aug 1? This week starts off with inflation data tomorrow, VIXEX on Wednesday, Mercury Retrograde starts Thursday, and we have OPEX on Friday. Stay tuned lets see what happens

Good scenario for PalantirDo you want coffee NASDAQ:PLTR ?
Palantir has performed excellently throughout 2025 and looks set to continue doing so.

PLTR Looks Ready for a ReboundPLTR Looks Ready for a Rebound — Gamma & SMC Say Watch This Level 👀
GEX Insight: Why Calls Might Be the Move
Looking at the options sentiment chart, we’re sitting on top of the strongest PUT support wall at 130, which lines up with the highest negative NET GEX. This area often marks a pivot or bounce zone. IVR is elevated at 24.8, and while IVX is still higher, GEX is flipping cautiously bullish with GEX 🔴🟢🟢.
💡 If buyers defend this 130 GEX pivot, the flow could shift bullish fast. Smart traders might consider grabbing short-term CALLS around 130 targeting the gap fill toward 137 or even 140 if momentum builds. But if 130 breaks and stays below, PUTS open up down to 127–125 range.
Price Action & SMC Setup
On the 1H chart, structure confirms a bearish BOS after a CHoCH, but price is now stalling at the lower channel and OB box. That green reaction block is the first test of demand in days — if price reclaims above 132.50, expect liquidity to drive back toward 135–137.
Trendline resistance is steep, but any break and hold over 137 could confirm a new bullish CHoCH. That gives us two key zones to watch.
Intraday Trade Plan (Tuesday July 2)
Bullish Scenario
* Entry: Near 130.50–131.00 (call buyers step in on support reclaim)
* Trigger: Break and hold over 132.50
* Target 1: 135
* Target 2: 137–138
* Stop: Below 129.50 (invalidates support)
Bearish Scenario
* Entry: Rejection at 132.00–132.50 or break below 130
* Target 1: 127
* Target 2: 125 (gamma wall zone)
* Stop: Above 133.00 (invalidates the bearish push)
My Thoughts
This is a bounce-or-break zone. If bulls can hold this GEX floor at 130 and reclaim structure on the 1H, we might see a quick short-covering rally. But failure here and PLTR will likely slide down to the next GEX support.
Disclaimer: This is not financial advice. Just a trader’s opinion based on GEX and price action. Always manage risk and trade smart.

PLTR: Decoding the Current PullbackPLTR: Decoding the Current Pullback
Current Price Action & Trend:
The asset has experienced a significant uptrend from its late March low of approximately 65.88 (marked as 1 on the Fibonacci tool) up to a peak of 148.44 (marked as 0) in early July. Currently, the price is undergoing a pullback from this recent high, trading around 129. An ascending trendline or channel acts as dynamic support on several occasions during the uptrend.
Key Support Levels & Zones:
"Ideal Area 120" & Ascending Trendline Confluence:
For PLTR an "Ideal Area is 120." This zone is notable as it aligns directly with the ascending blue trendline. This area is served as a point of interest or consolidation during the uptrend, suggesting it could act as a significant support level upon a pullback.
Fibonacci Retracement Levels:
A Fibonacci Retracement tool has been applied from the swing low (65.88) to the swing high (148.44) of the preceding impulse wave.
The 0.5 Fibonacci retracement level is identified at 107.16. This level often acts as a significant support or resistance point.
The 0.618 Fibonacci retracement level, commonly referred to as the "Golden Ratio," is located at 97.42. This level coincides with a broader orange horizontal zone labeled "Fib Golden zone & Strong Level 100." This confluence suggests a particularly strong area of potential support around the psychological 100-mark, bolstered by the Fibonacci ratio. The yellow ellipses indicate prior interactions with this broader zone.
Potential Scenarios (Illustrated by Dotted Lines):
Scenario 1 (Shorter Retracement): This path suggests a potential bounce from the "Ideal Area 120" and the ascending blue trendline, leading to a resumption of the upward movement towards previous highs (148.44) and potentially beyond.
Scenario 2 (Deeper Retracement): This path illustrates a possible deeper pullback, indicating that if the "Ideal Area 120" does not hold, the price might seek support at the "Fib Golden zone & Strong Level 100" (0.618 Fib level around 97.42) before a potential reversal and continuation of the broader uptrend.
Conclusion:
The current price action is undergoing a correction within a defined uptrend. Technical levels, including dynamic trendline support and static Fibonacci retracement zones, are presented as key areas for observation, offering insights into potential points of interest for future price reactions.
Disclaimer:
The information provided in this chart is for educational and informational purposes only and should not be considered as investment advice. Trading and investing involve substantial risk and are not suitable for every investor. You should carefully consider your financial situation and consult with a financial advisor before making any investment decisions. The creator of this chart does not guarantee any specific outcome or profit and is not responsible for any losses incurred as a result of using this information. Past performance is not indicative of future results. Use this information at your own risk. This chart has been created for my own improvement in Trading and Investment Analysis. Please do your own analysis before any investments.

$PLTR - support bounce at $130PLTR - Stock testing bottom of the channel on the daily time frame. Stock has held that support level trice. on high watch if we see a bounce here. Calls above $135 looking good . Stock is decent at the indicator level.
PALANTIR REMAINS YOUR TRADING GOAL, DOUBLING IN PRICE IN 2025In the Faraway Kingdom... In the Thirtieth Realm....
Somewhere in another Galaxy.. in late December, 2024 (yet before The Second Coming of Trump), @TradingView asked at it awesome Giveaway: Happy Holidays & Merry Christmas .
1️⃣ What was your best trade this year?
2️⃣ What is your trading goal for 2025?
Here's what we answered:
1️⃣ What was your best trade this year?
- Surely Palantir NASDAQ:PLTR 💖
I followed Palantir all the year since January, 2024, from $16 per share, watch here .
Current result is 5X, to $80 per share.
Also I added more Palantir after SP500 Index inclusion in September 2024 watch here .
Current result is 2.6X, from $30 to $80 per share.
2️⃣ What is your trading goal for 2025?
- Once again, surely Palantir NASDAQ:PLTR 💖
It's gone 7 months or so... (Wow... 7 months really? 😸😸😸)
Let see what's happened next at the main graph of Palantir stock, to LEARN WHY PALANTIR REMAINS THE TRADING GOAL, DOUBLING IN PRICE IN 2025...
Palantir stock remains an attractive trading goal for several compelling reasons rooted in its strong market performance, innovative technology, and robust growth prospects, particularly in the artificial intelligence (AI) sector.
1. Exceptional Stock Performance and Momentum.
Palantir Technologies has been one of the best-performing stocks in 2025, surging over 80% in the first half of the year alone, vastly outperforming the S&P 500’s modest 5.5% gain. The stock recently hit all-time highs around $149, reflecting a nearly 400% increase year-over-year, underscoring its strong momentum and investor enthusiasm. This surge positions Palantir as a top AI stock to watch, attracting both retail and institutional investors, including conservative entities like the Czech National Bank.
2. Leadership in AI and Data Analytics.
Palantir is not just a data analytics company; it has transformed into a major AI software provider with its Artificial Intelligence Platform (AIP). This platform extends beyond government contracts into commercial sectors such as healthcare, energy, and automotive, fueling significant revenue growth. The company reported a 39% revenue increase to $883.9 million in Q1 2025, driven largely by AI adoption. Its AI platform is gaining traction globally, with many companies rapidly adopting Palantir’s software through short training bootcamps, demonstrating scalable and fast integration.
3. Strong Government and Commercial Contracts.
Palantir’s roots in government intelligence and defense continue to be a significant revenue driver. The U.S. government division alone generated $373 million in Q1 2025, with overall government revenue up 45% year-over-year. Strategic partnerships, such as with Accenture to streamline federal operations and projects like the U.S. Navy’s ‘Warp Speed for Warships,’ highlight Palantir’s expanding footprint in critical government sectors. Simultaneously, the commercial segment is booming, with revenue soaring 71% to $255 million in Q1 and projected to reach $1.178 billion in 2025.
4. Financial Health and Growth Outlook.
Palantir’s financials are strengthening, with no debt and adjusted free cash flow more than doubling to $370.4 million in the recent quarter. Analysts forecast the company’s revenue to exceed $3.5 billion in 2025, up from $2.23 billion the previous year, and project potential revenue of $7 billion by 2028. Operating margins are improving, with a recent quarter reporting a 26% margin, the highest in company history. This solid financial foundation supports further investment in AI innovation and market expansion.
5. Market Position and Competitive Edge.
While Palantir competes with tech giants like Microsoft, Amazon, and Google in the AI and data analytics space, it has carved out a unique niche with its specialized government contracts and AI-driven software solutions. Its ability to integrate complex datasets for real-world operational use distinguishes it from competitors, fostering a loyal investor base and a "cult-like" following among retail investors.
6. High Valuation Reflects Growth Expectations.
Despite a high price-to-earnings ratio (PE around 621), reflecting elevated expectations, many analysts remain optimistic about Palantir’s long-term potential due to its rapid growth and expanding AI capabilities. The company’s market capitalization has soared above $330 billion, surpassing many established corporations, signaling strong market confidence.
7. Palantir stock is a compelling trading goal because it combines robust growth, cutting-edge AI technology, strong government and commercial contracts, and solid financial health.
8. In conclusion, Palantir remarkable stock performance and strategic positioning in the booming AI sector make it a promising investment for traders seeking exposure to transformative technology with significant upside potential.
9. ...and yet, Palantir performance since inception (It ultimately went public on the New York Stock Exchange through a direct public offering on September 30, 2020) is better, rather then Bitcoin.
--
Best wishes,
@PandorraResearch Team 😎

PLTR: Trend Analysis 📈 PLTR | SMC Trend Continuation or Reversal? Watch This Key Zone
🔍 Chart Type: 15m
🧠 Strategy: Smart Money Concepts (LuxAlgo), EMA Stack (20/50/100/200)
📊 Volume Surge: 177.99K
🧭 Narrative: Institutional Accumulation + Premium Rejection
🚨 Current Price: $145.88
📍 Market Structure:
Price is currently reacting from a Premium Zone just above a recent Break of Structure (BoS).
We've seen a Chg of Character (ChgofCHoCH) and several bullish BoS confirming smart money intent.
Volume expansion at the highs suggests potential liquidity grab.
📐 Key Levels:
Premium Zone near $146
Equilibrium at ~$143
Discount Zone begins near $140
Strong Edge (deep discount) below $138
Long-term Target remains at $165.11 if bullish channel is respected.
📉 Bearish Scenario:
Break below Equilibrium and retest of Discount Zone = liquidity sweep
Watch if price retraces toward $140.10 (blue line) or lower for a higher-probability long.
📈 Bullish Scenario:
Break above current swing high confirms expansion toward $152+ and eventually $165.11
EMA stack remains bullishly aligned → trending continuation likely unless broken with momentum.
🔎 Institutional Insight:
Smart Money is likely building positions below equilibrium before major continuation. Liquidity pockets between $138–$140 are prime zones for potential long entries.
📆 Watchlist Catalyst:
Earnings cycle or Palantir federal contract news could align with breakout.
🧠 VolanX DSS Rating: BULLISH BIAS
✅ Structure: Bullish
✅ Volume: High
✅ Liquidity: Grabbed above recent highs
⛔ Confirmation: Await premium rejection or retrace to discount
—
🔁 Executed via VolanX Scanner + WaverVanir DSS
📊 Trade the future. Protect the edge. Lead with intelligence.
#WaverVanir #PLTR #SmartMoneyConcepts #VolumeProfile #MarketStructure #TechnicalAnalysis #VolanX #InstitutionalTrading #QuantFinance #TradingEdge #PropTrading

PALANTIR vs S&P500 INDEX. WILL AI UPBEAT TYCOON BUFFETT ITSELFFar far ago, somewhere in another Galaxy, in late December, 2024 (yet before The Second Coming of Trump), @TradingView asked at it awesome Giveaway: Happy Holidays & Merry Christmas.
1️⃣ What was your best trade this year?
2️⃣ What is your trading goal for 2025?
Here's what we answered:
1️⃣ What was your best trade this year?
- Surely Palantir NASDAQ:PLTR 💖
I followed Palantir all the year since January, 2024, from $16 per share, watch here .
Current result is 5X, to $80 per share.
Also I added more Palantir after SP500 Index inclusion in September 2024 watch here .
Current result is 2.6X, from $30 to $80 per share.
2️⃣ What is your trading goal for 2025?
- Once again, surely Palantir NASDAQ:PLTR 💖
It's gone 6 months or so... (Duh..? Ahaha.. 6 months already, really? 😸😸😸)
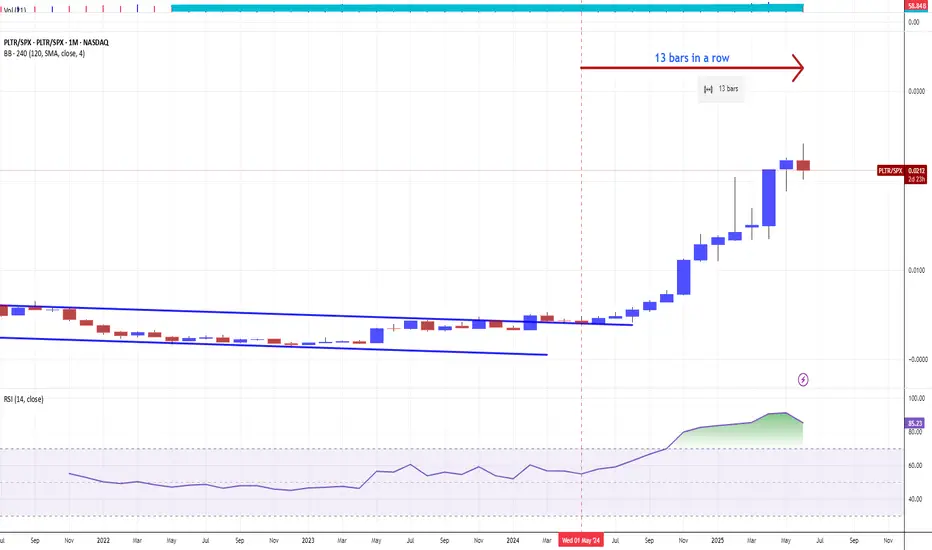
Let see what's happened next at the main graph PLTR/SPX
First of all, let me explain in a few words what does this graph mean.
Rising (Blue) candle means Palantir PLTR monthly return is better vs SPX
Falling (Red) candle means Palantir PLTR monthly return is worse vs SPX
Conclusion
Palantir. The stock that outperformed S&P 500 Index, 12 consecutive months in a row.
Palantir. The stock that printed 12x since inception. 5.5x over the past twelve month and 1.8x in the year 2025 (one the best results so far over the all S&P 500 Index components).
Palantir. The stock that goes to UPBEAT Tycoon Buffett record, that has been achieved in early 1990s (in 1992-93 Berkshire Hathway outperformed S&P 500 Index for straight TWELVE MONTHS).
Palantir. The stock that goes to repeat Microsoft NASDAQ:MSFT record, that has been achieved in 1990s (in 1996-97 Microsoft outperformed S&P 500 Index for straight THIRTEEN MONTHS).
Palantir. Were we right with this stock on contest and won it? Exactly! Even though our prize has been toadly strangled. 🤭
//P.S. We did not find any biggest series then 13-month straight gain. Microsoft 13 straght months superiority over S&P500 index is the biggest ever series in history we found.
//P.P.S. Just one day left (June 30, 2025) to a very potential and a very historical event.
--
Best wishes,
Your Beloved @PandorraResearch Team 😎
PLTR: Encoded Wave Replication IAs bullish wave gets mature on the way up, it draws distinctive tops in a way that warns of bullish exhaustion ahead because to some extent topologically highs indicate a registered rejection of moving further in a local scope (some period).
Scalable Recursive Patterns
If we pay attention to building blocks on smaller scale
Those patterns replicate in bigger scale for example
If the pattern really carries the identified encoding, I'd pay attention to how price retraces within fibonacci channel which is adjusted to the direction of fractal cycle in a clean version.
