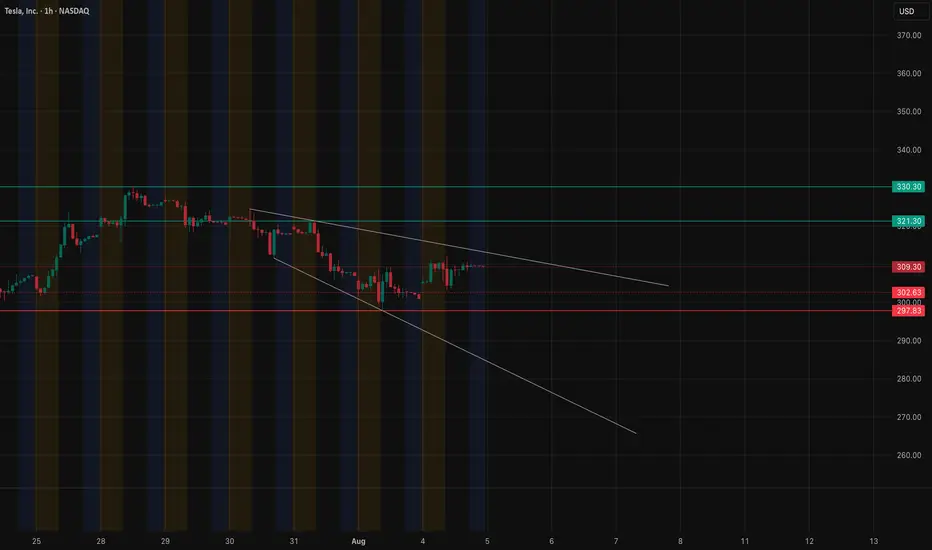
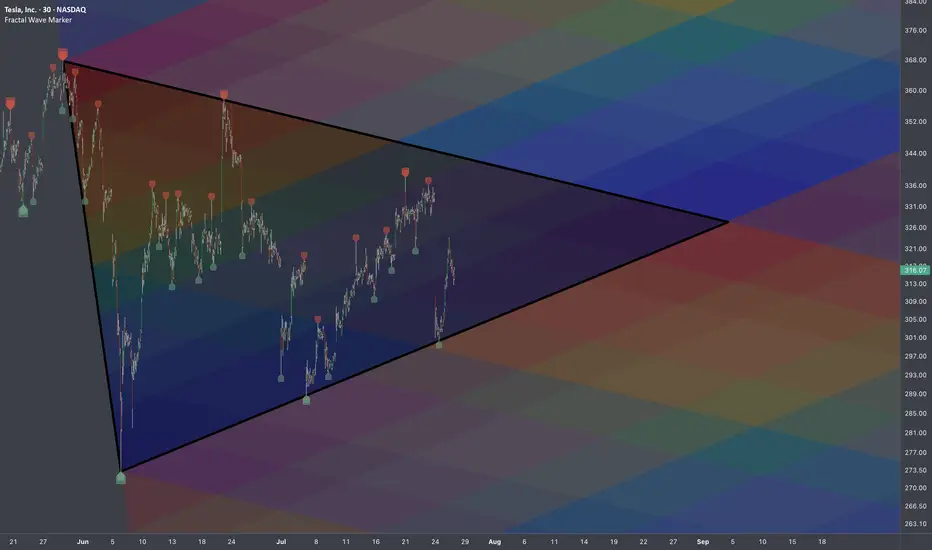
TESLA Lagging BehindA compelling reason to buy Tesla stock now—despite it being beaten down—is the asymmetric risk-reward setup driven by its depressed valuation relative to long-term growth potential. Sentiment is currently low due to concerns about EV demand, competition, and Elon’s distractions, but this pessimism is largely priced in. Meanwhile, Tesla still holds massive optionality: AI-driven autonomy, energy storage, and Dojo supercomputing. If even one of these verticals scales meaningfully, current prices may prove a generational entry.
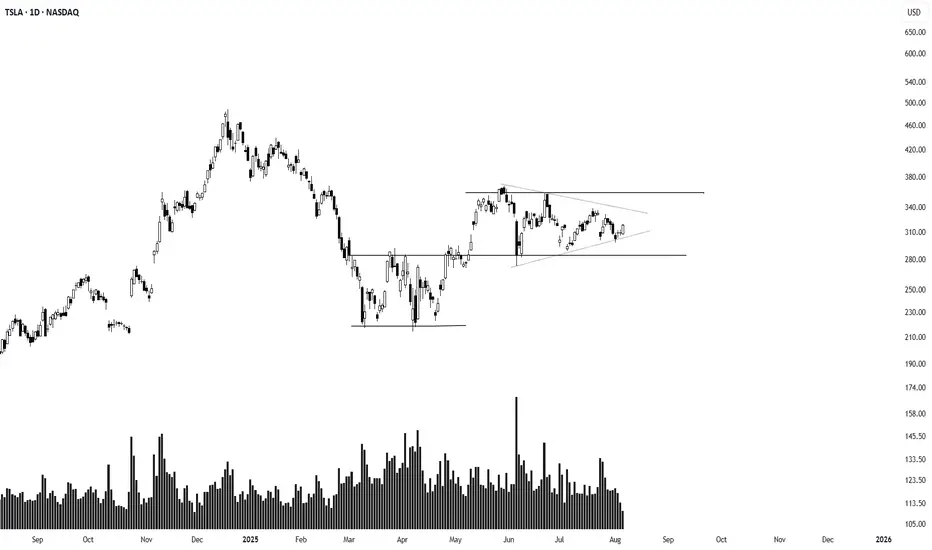
At the moment, we are hitting some of my key support levels being the anchored vwap from the low , as well as the previous Value Area High range retest within the formation of this broader triangle, suggesting a potential continuation to the upside should we get a strong breakout.
I will be watching for further down side as the current risk is only approx 6-7% for a potential upside of 60%-70% , a massive Risk to reward.
Should this reclaim the downtrend vwap, it can be a strong sign of strength for this stock to move back to ATH's as tesla is massively lagging behind.
TSLA trade ideas
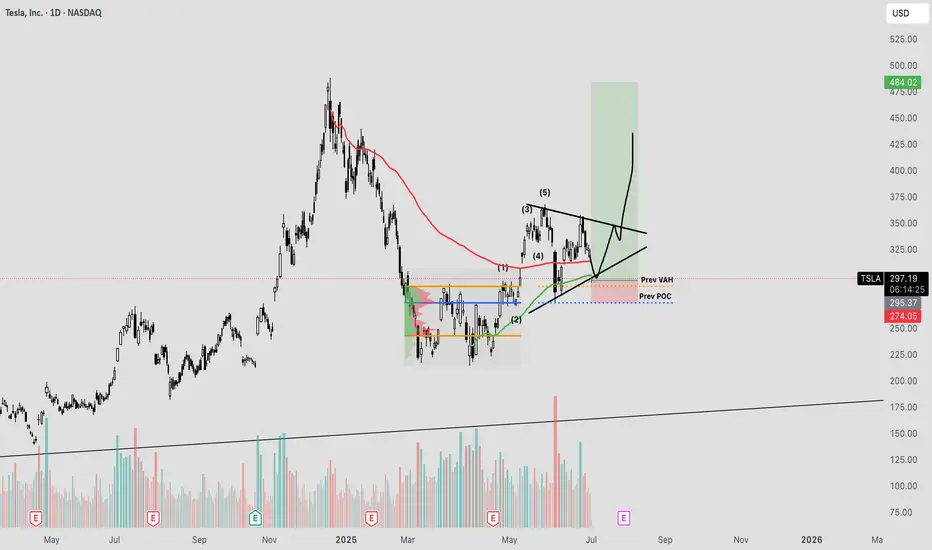
WXY structure with a double topTesla has been in a uptrend with a corrective structure WXY. I am not sure if the WXY is a part of wave 5 terminal structure or a B wave. However expecting a double top or 78.6 retrace to 425-430 range as a minimum. For this scenario, an impulsive upside move is expected within the next few weeks. However the price needs to move back into the channel next week as a first step.

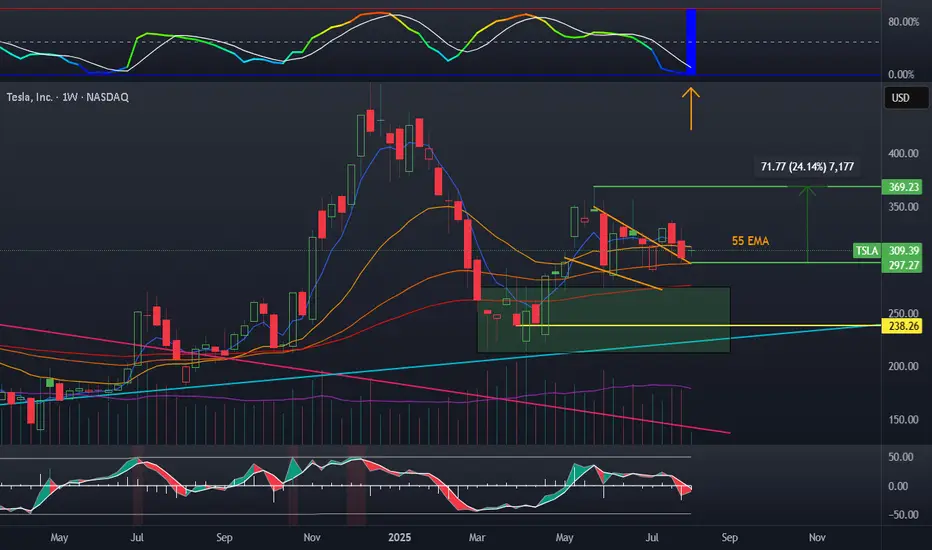
Tesla wedge and volatilityTesla has been riding this wedge downward after a false breakout on terrible earnings. BBWP has flashed blue, which has not happened since 2017, which is a signal for me. Stochastic has reset, and a stall candle is forming. Volume is generally up.
My plan:
TSLL shares, possible cash secured puts
TESLA POST EARNING 24 JULY 2025This is Post earning analysis for Tesla . I have clearly explained all the levels. Please trade carefully & try to stick to your plan.
NOTE: FOLLOW THE LEVELS

Bearish Triangle: TSLAWaiting for TSLA to breakout 292 to form a bearish triangle pattern.
Target price: 22X

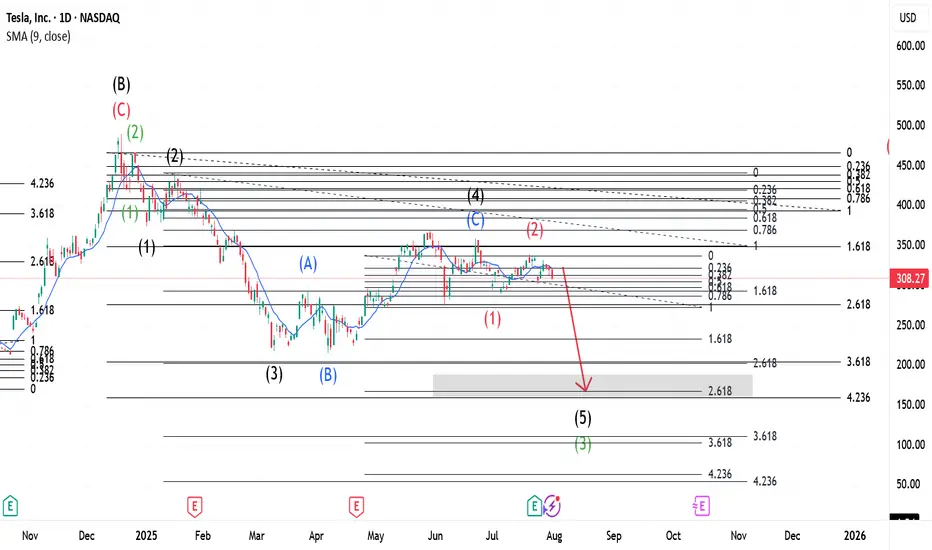
$TSLA ~ Elliott Wave Updates.This whole wave is Wave C(Black) that started when Wave B(Black) was completed. This Wave C(Black) expresses itself in 5 main waves shown in Green. Wave 2(Green) was a Zigzag and a Flat should be expected for 4(Green). Meanwhile, Wave 3(Green) expresses itself in a 5 wave move shown in Black- with Wave 2(Black) being a Zigzag, our 4 was a Flat. This Flat is shown as Blue ABC. When Wave 4(Black) completed, our Wave 5 began which upon completion, would be Wave 3(Green) of the main wave. Wave 2(Red) is a Flat and a Zigzag should be expected after 3(Red).
Go to for more information of the same.
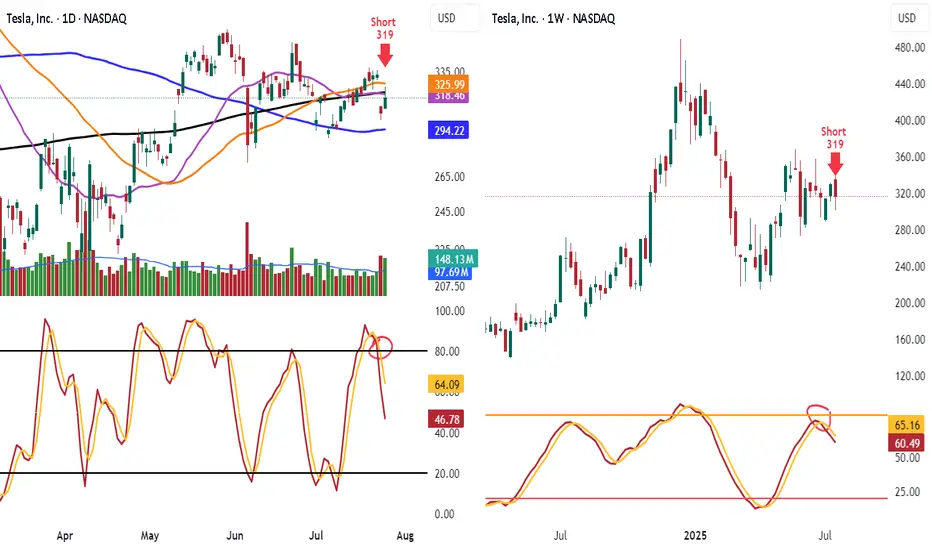
Shorted TSLA 319 Look at TSLA hit 50 day and 200 day MA and failed and know under them
Look at the lower highs and see the stoch heading down
Know lets look weekly stoch heading down and lower highs
Target is 100 day ma 294.22 take some off. When it breaks will add back on
Have trailing stop in place
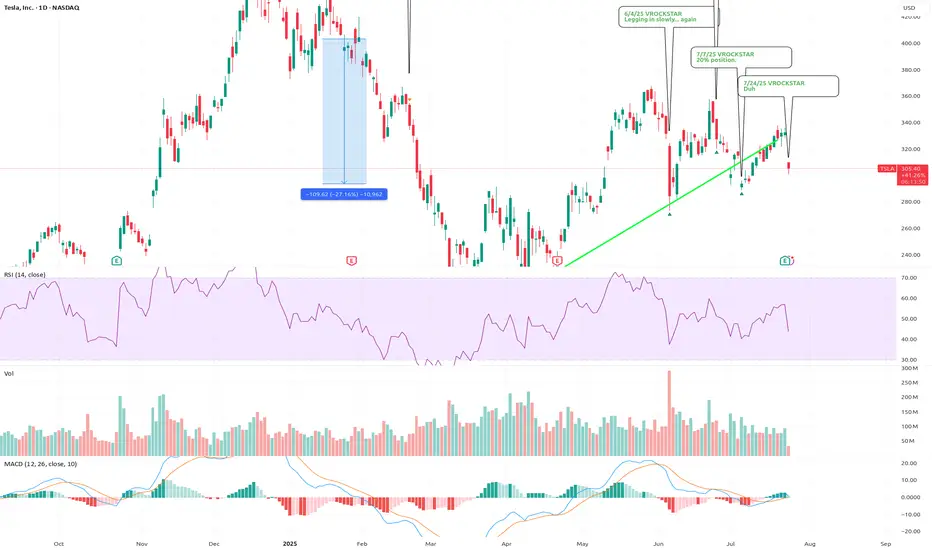
7/24/25 - $tsla - Duh 7/24/25 :: VROCKSTAR :: NASDAQ:TSLA
Duh
- ppl focused on ST FCF (all over X!) is 100% of the reason why when you put the pieces together, you realize that while ST this might not behave like anyone expects... LT, TSLA is v likely going to in, elon's own words, be the largest cap in the history of capital markets
- two leading robots with leadership position in IRL AI
- profitable, is all that matters
- have not yet hit the S-curve
was super lucky to trim some of this last week
now i'm back to sizing into a full position, not yet there like on that silly political dump, but i'm nearly 10% (20% is my max size).
V
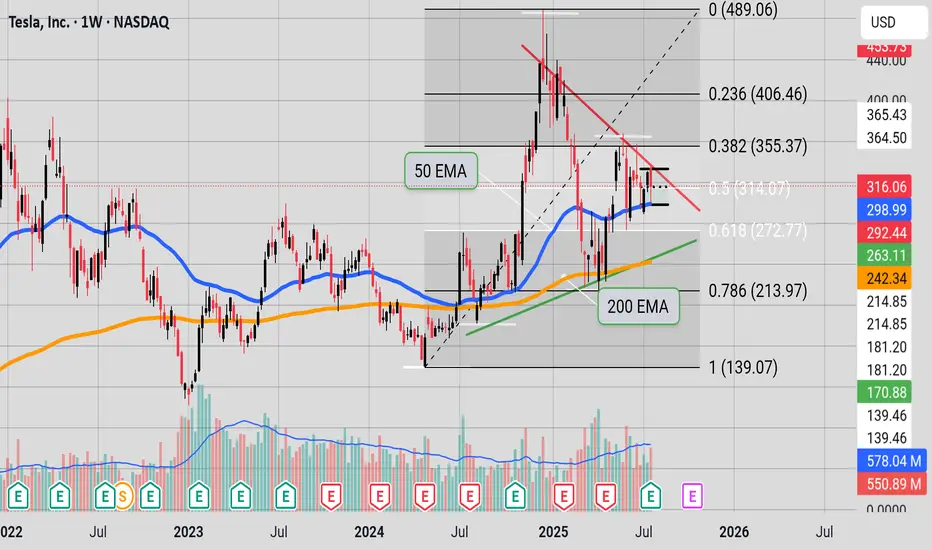
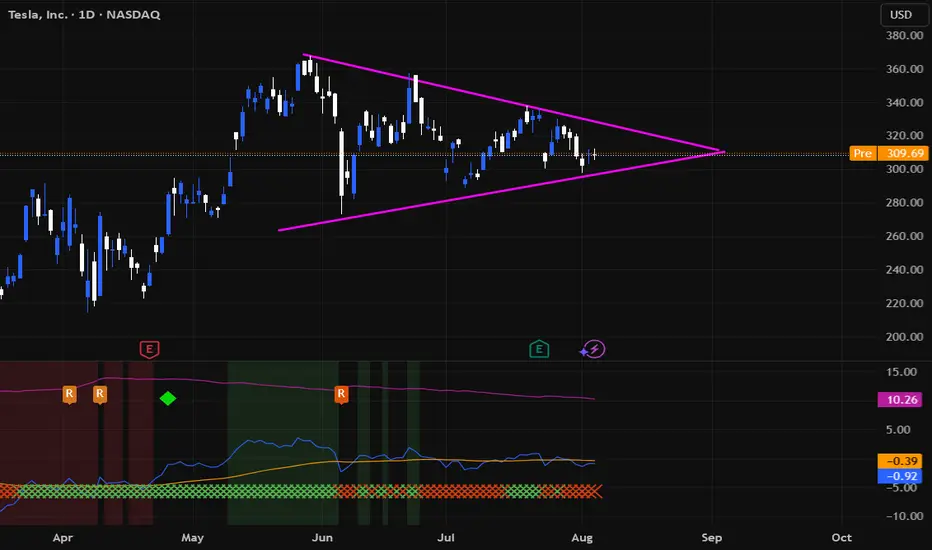
Inflection point"Tesla is at a binary point on the chart. The stock is wedged tightly between the red, downward-sloping resistance line (upper boundary) and the green, upward-sloping support line (lower boundary)—the classic apex of an asymmetrical triangle.
At this stage:
A breakout above the red resistance would be a clear bullish signal, potentially starting a new upward trend.
A rejection at resistance and breakdown below the green support would signal bearish momentum, with likely downside toward lower Fibonacci levels like 272.77 or 213.97.
With price at this inflection zone, the next decisive move—either up or down—will likely define Tesla’s short-to-medium-term trend. This is a textbook example of a binary technical situation: whichever direction is confirmed next, that’s likely to dictate the coming weeks' price action." (Some help from Perplexity)
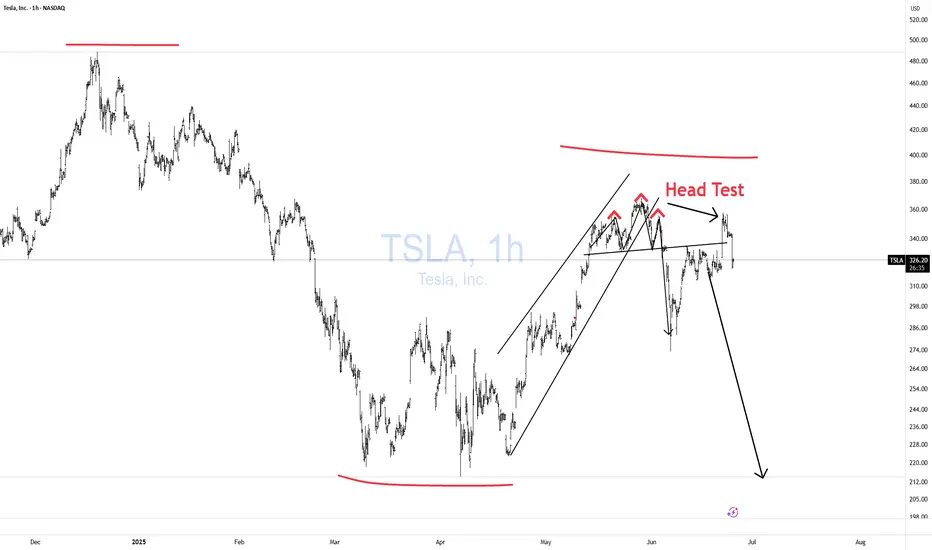
TSLA Honey Ticking Bull Trap! UPDATE 1This is an updated chart, as I keep being prompted to reach "My Target" by TV.
No matter how bad things get for Elona and TSLA, there are always people who are willing to pile in and buy at any price. The problem is the chart is showing lower highs, as TSLA no longer attracts the people needed to boost price, just like TSLA the brand. As a result, people keep getting honey ticked.
Don't Get HONEY TICKED!
As I always say, never EVER!! Invest in toxic people like Elona. They always blow themselves up in the end. It's in their nature!
Click Boost, Follow, subscribe, and let's reach 5,000 followers. ;)
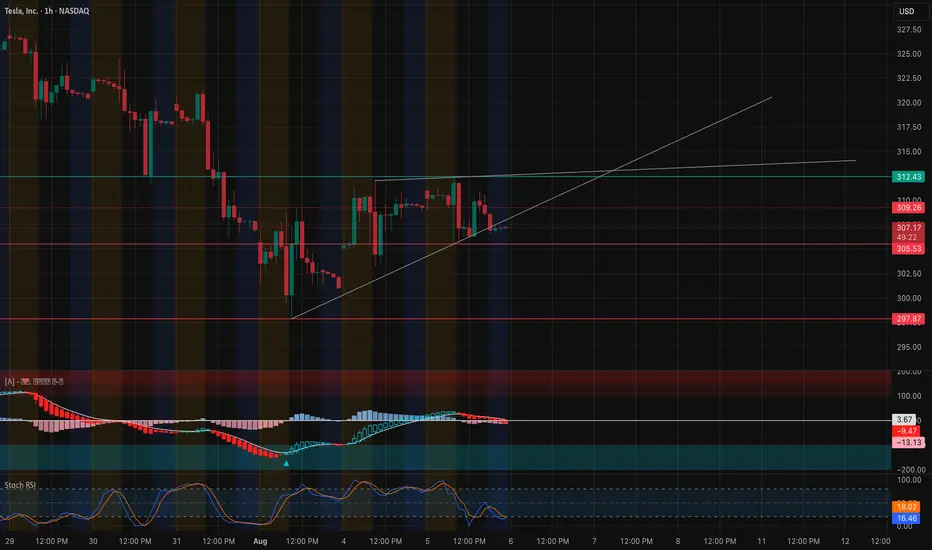
TSLA Attempting Breakout – Watching $312 Key Level. Aug. 5TSLA Attempting Breakout – Watching $312 Key Level 🚀
Technical Overview (1H)
TSLA is consolidating just below the critical $312 resistance, aligning with the Highest Positive GEX and 2nd Call Wall (57.55%). A breakout above this level could trigger a gamma squeeze toward $317.5 and potentially $325.
Support sits at $300 (Major Put Support -58.42%). If this fails, bears could push toward $295 and $290. Price is currently forming a falling wedge, a bullish reversal pattern if confirmed.
GEX & Options Flow Insights
* Highest Positive GEX: $312 – Strong resistance; breaking above can fuel upside momentum.
* Major Call Walls: $317.5, $325 – Profit-taking zones for bulls.
* Major Put Support: $300 – Bears will defend here; losing it invites heavier selling.
* Call/Put Positioning: CALLs 31.3% vs Puts – Skew still leans slightly bullish, but gamma flip is near $300.
My Thoughts
TSLA is coiling for a potential move. As long as price holds above $300, the risk/reward still favors a bullish breakout play. However, failure to clear $312 could see a pullback into $305–$300 range before another attempt.
Trade Ideas
Bullish Scenario:
* Entry: On a breakout above $312 with strong volume
* Targets: $317.5 → $325
* Stop-Loss: Below $305
Bearish Scenario:
* Entry: Rejection at $312 and loss of $305
* Targets: $300 → $295
* Stop-Loss: Above $315
15-Minute Short-Term Setup
* Intraday traders should watch for a mini breakout retest above $310 for scalps to $312+.
* If $307 fails intraday, momentum could stall toward $304–$302.
Disclaimer: This analysis is for educational purposes only and does not constitute financial advice. Always do your own research and manage your risk before trading.
TSLA Weekly Bearish Play — August 2, 2025
🔻 **TSLA Weekly Bearish Play — August 2, 2025** 🔻
🚨 **Multi-Model Consensus Signals a Tactical Put Opportunity**
### 🔍 Market Snapshot:
* **Daily RSI:** 39.9 (Bearish)
* **Weekly RSI:** 53.2 → Falling
* **Volume:** Weak (0.8x last week)
* **Options Flow:** Neutral (C/P Ratio \~1.04)
* **VIX:** 20.38 → Favorable for Options Plays
* **Institutional Support:** Weak
---
### 🔮 Model Consensus:
📉 **All major models (xAI, Google, Claude, Meta, DeepSeek)** confirm:
* Bearish momentum on both daily + weekly RSI
* Weak volume = cautious institutional behavior
* Volatility setup perfect for short-dated puts
---
### 🎯 Viral Trade Setup:
**💥 Trade Type:** PUT (Short TSLA)
**🔻 Strike:** \$300
**📆 Expiry:** 2025-08-08
**💰 Entry Price:** \$6.65
**🎯 Target Exit:** \$10.64 – \$13.30 (60%-100% gain)
**🛑 Stop Loss:** \$3.99
**📊 Confidence:** 65%
**📍 Entry Timing:** Monday open
**🕒 Signal Timestamp:** 2025-08-03 01:33:56 EDT
---
### ⚠️ Key Levels:
* Support to watch: **\$297.82**
* News/event risks: Stay alert ⚡
* Use tight risk controls for weekly plays!
---
🔥 **If you trade TSLA — don’t sleep on this one.**
Bearish consensus + clean setup = **high-probability weekly play.**

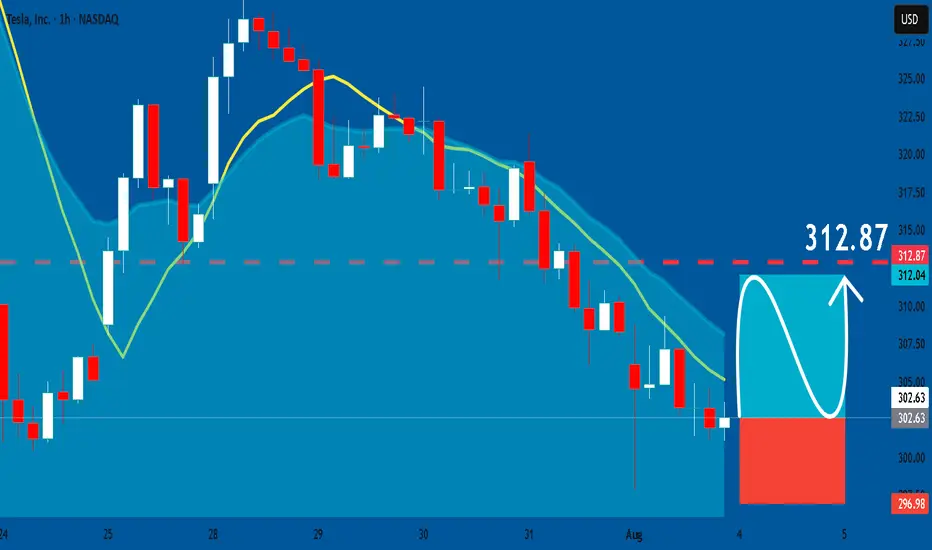
TESLA: Bullish Continuation & Long Trade
TESLA
- Classic bullish setup
- Our team expects bullish continuation
SUGGESTED TRADE:
Swing Trade
Long TESLA
Entry Point - 302.63
Stop Loss - 296.98
Take Profit - 312.87
Our Risk - 1%
Start protection of your profits from lower levels
Disclosure: I am part of Trade Nation's Influencer program and receive a monthly fee for using their TradingView charts in my analysis.
❤️ Please, support our work with like & comment! ❤️
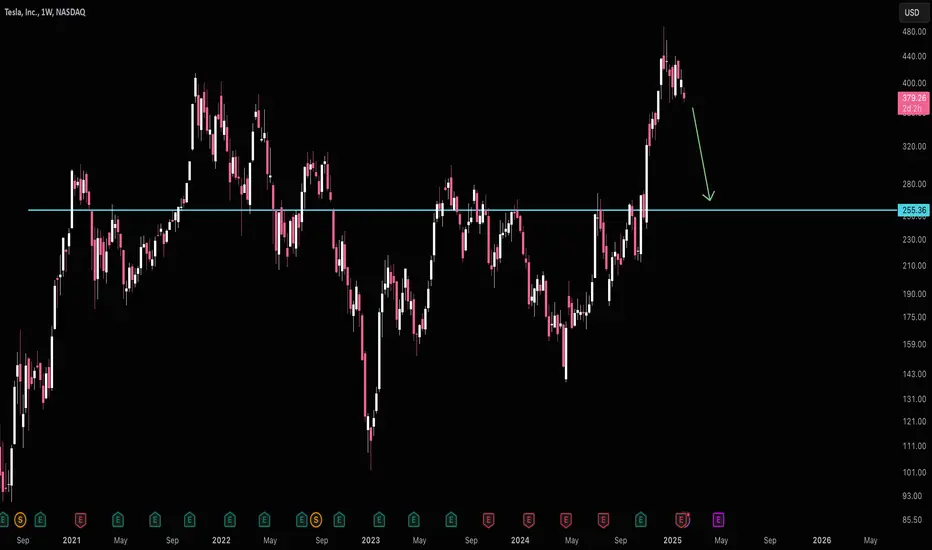
Tesla High Risk of $255Tesla is Stuck under $430 ATH resistance and at high risk of falling back to $255 support.
Tesla is no longer growing and Musk is polarizing and alienating their mostly progressive leaning customer base. This stock simply makes zero sense for a 200 pe ratio.

Sitting Right on the 200-Day EMATSLA is sitting right on the 200-Day EMA here while holding this wedge for quite some time. TSLA's Bollinger Bands are starting to squeeze, indicating a significant move is forthcoming, and moving averages (MA 5/10/30/60) are flattening, indicating a loss of bullish momentum. It will be interesting to watch from here.
Tesla Builds Toward Fair Value GapFenzoFx—Tesla (#TSLA) bounced from the ascending trendline and closed yesterday's session at the volume point of interest, the $322.3 mark. This level is above the monthly VWAP, meaning bulls are gaining, and bears are losing money.
That said, we expect the uptick in momentum to resume, targeting $338.9, and if this level is breached, the stock will likely aim to fill the Fair Value Gap at $350.0.

$TSLA: Breakout Wave Dimensions🏛️ Research Notes
Apart from known compression patterns for Tesla, there is another squeeze happening on smaller scale:
That area will be processed to derive the chart-based levels and see how market reacts to them.
Triangle
Breakout Expansion
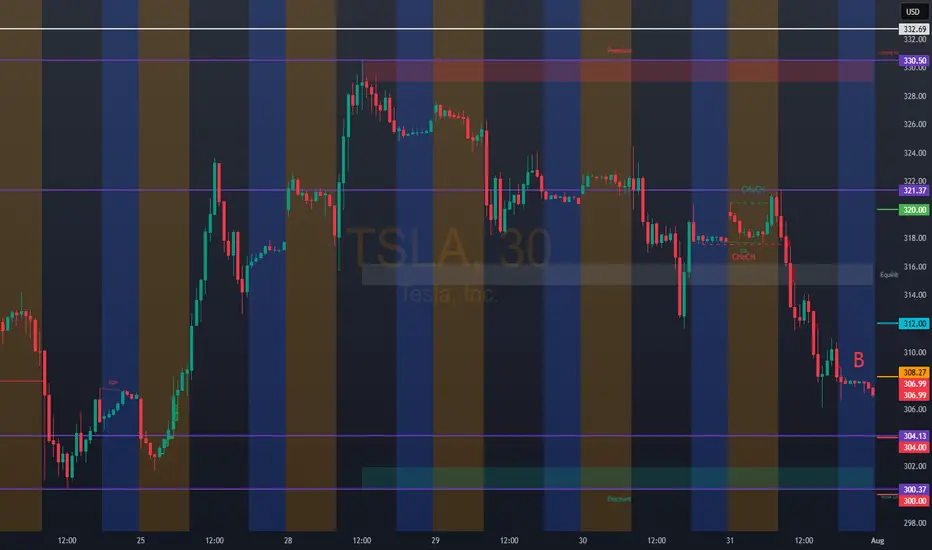
TSLA – Testing Key Gamma & Structure Levels. TA for Aug. 6TSLA – Testing Key Gamma & Structure Levels
Technical Overview
TSLA has been consolidating just under a key resistance zone at 310–312, which also aligns with the highest positive GEX / gamma resistance area. Price is forming a higher-low structure off the 303–305 support trendline, suggesting buyers are still defending key levels despite recent selling pressure.
MACD is flattening out and Stoch RSI is cycling near mid-range, indicating a potential momentum build but no confirmed breakout yet.
GEX / Options Sentiment
* Gamma Resistance: Heavy call wall at 312 with 52% concentration, and further stacked resistance into 320–325. This creates a ceiling unless strong bullish momentum steps in.
* Gamma Support: Large put positioning at 300 (-64% concentration) and 295 acting as a key defensive floor.
* Dealer Positioning: Above 312, gamma flip could drive momentum toward 320–325 quickly. Below 300, dealer hedging could accelerate selling into 295 and possibly 290.
Trade Scenarios
Bullish Case
* Trigger: Break & hold above 312 with volume.
* Target 1: 320
* Target 2: 325
* Stop: <305
Bearish Case
* Trigger: Close below 300 with momentum.
* Target 1: 295
* Target 2: 290
* Stop: >312
Options Thoughts
* Bullish: Consider short-term calls if price breaks above 312 with strong volume and momentum confirmation.
* Bearish: Consider puts targeting 300 if rejection occurs at 310–312 and sellers regain control.
* Neutral / Premium Selling: Selling an iron condor around 295–325 could work if expecting continued range trading until a catalyst emerges.
📌 My Take: TSLA is coiling for a decisive move. GEX shows a tight battle between 312 call resistance and 300 put support. A break in either direction could lead to a fast expansion move. I’m leaning neutral-to-bullish as long as 305 holds, but I’ll switch bearish if 300 breaks.
Disclaimer: This analysis is for educational purposes only and not financial advice. Always do your own research and manage risk accordingly.
TSLA: 308.27Bullish Entries: 312.00/318.00 Stop 316.00 / Target 322.00–325.00
Bearish Entries: 304.00/300.00 Stop 302.00 / Target 296.00–292.00. Note: If the open starts above 312.00, we should wait for it to touch 318.00. Then, 320.00 is the entry for the previous day's bearish trend reversal and the new uptrend.
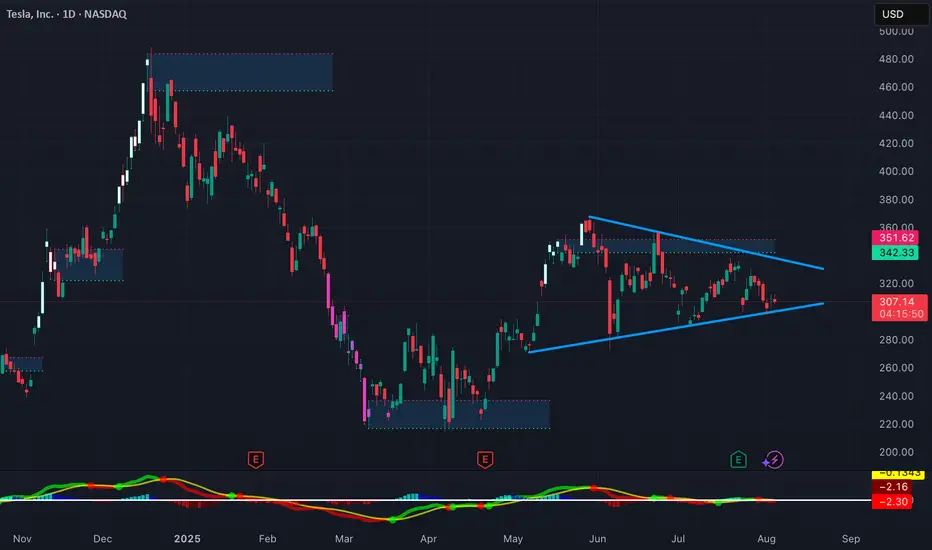
Leave your comment about TESLATesla is in a flag pattern on the daily time frame and I think there is fire under the ashes! Breaking the upper side of the triangle is good news for its holders.
Tesla : Bullish or Bearish? Targets and AnalysisWe currently have a symmetrical triangle formation on the lower time frames for TSLA. As of right now we are direction-neutral and waiting on a break above or below our current support/resistance. I give targets and breakage points in this video.

Tesla Forming an ApexTesla is tightening up into an Apex formation. We are seeing volume spikes at the lows which could signal a breakout to the upside, but still need confirmation of this.