Bitcoin, SPX, Ethereum, Tesla: Whats Next? BTC appears to be showing distribution signs.
I do believe BTC local top is in, but alt coins like Ethereum can still push a bit higher.
Ethereum short around 3900-4000 looks promising
Tesla fell sharply on the back of cash flow burn and expenditures.
Investors are also fearful of sales decline and loss of EV credits.
SPX hit major long term resistance today. Coupling this with a depressed Vix we are likely setting up for a pullback in the market.
Small caps saw distribution today on the back of rising yields. A failed breakout observed on IWM chart.
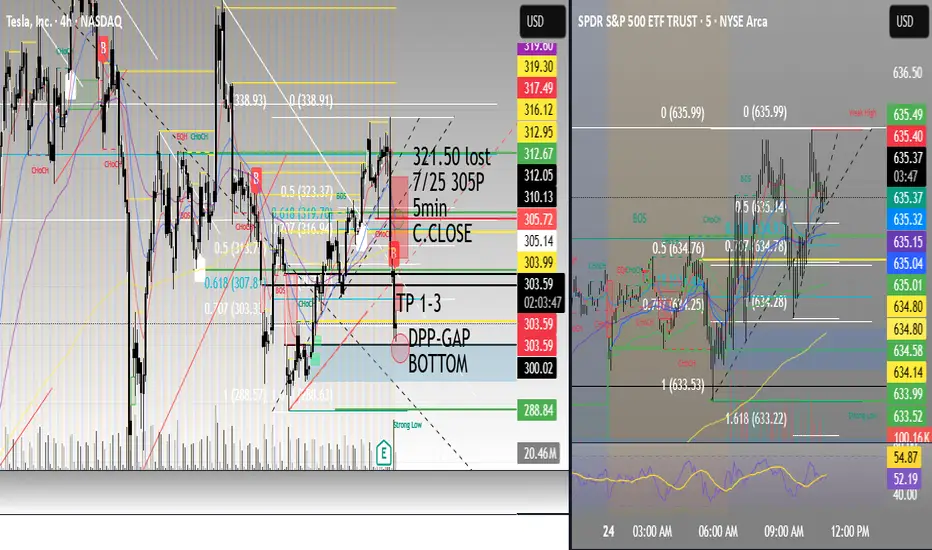
TSLA trade ideas

TSLA, revenue decline/textbook technical setup.TSLA, revenue decline/textbook technical setup.
Confluence of major levels, how to take a well defined short trade with puts.
Clean as it gets.
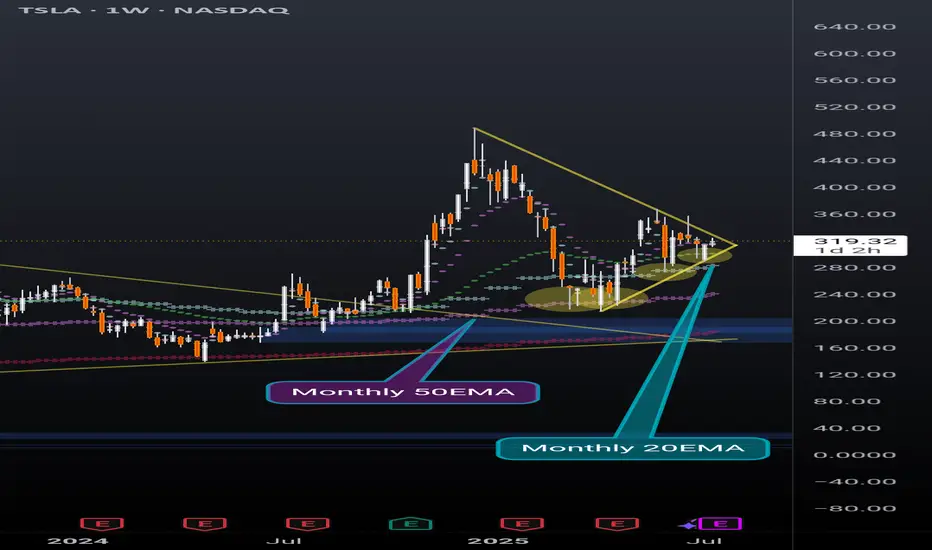
TSLA weekly coiling into something powerfulNever doubt the power of TSLA. Recently broke out of a huge pennant, and now nearing the end of another pennant while simultaneously holding support above the daily 20EMA(overlayed on this weekly chart).
Also recently found support off of the monthly 20EMA (overlayed on this weekly chart) and took 2 direct hits on the monthly 50EMA (overlayed on this weekly chart) before that and rallied up. It will take a lot to crush this setup but anything can happen. Possibly a longer pennant formation.
I'm just a cat not a financial advisor.
TSLA 24 JULY 2025I have marked 2 levels in green boxes. Price is inside this box pre market and TSLA is down -8.5% from the highs of $338 post market till $310 & -7.5% down from yesterday's close
A better level is the lower demand zone but its not the best. Price has not hit any major resistance.
My job is to read the data & trade. I am still bullish & 10% up down move is normal for Tesla &
This could be a "BEAR TRAP".
Tesla Shares (TSLA) Drop Following Earnings ReportTesla Shares (TSLA) Drop Following Earnings Report
Yesterday, after the close of the main trading session on the stock market, Tesla released its quarterly earnings report. While both earnings per share (EPS) and gross profit slightly exceeded analysts’ expectations, the results reflected a negative trend driven by declining sales. This decline is being influenced by intensifying competition from Chinese EV manufacturers as well as Elon Musk’s political activity.
According to Elon Musk:
→ The company is facing “a few tough quarters” due to the withdrawal of electric vehicle incentives in the US;
→ The more affordable Tesla model (mass production expected in the second half of 2025) will resemble the Model Y;
→ By the end of next year, Tesla's financials should become "highly compelling".
Tesla’s share price (TSLA) fell by approximately 4.5% in after-hours trading, clearly reflecting the market’s reaction to the report. Today, the stock is likely to open around the $317 level, down from over $330 just the day before.
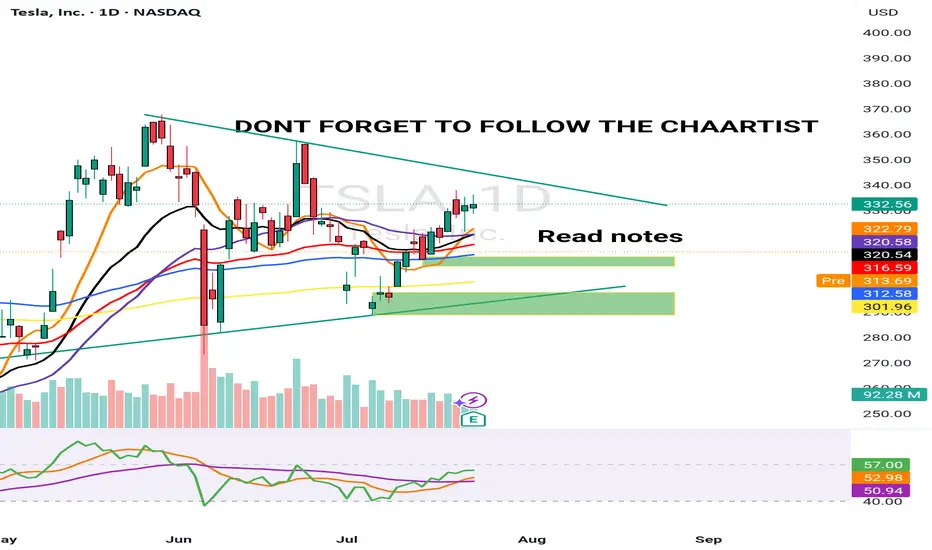
Technical Analysis of TSLA Stock Chart
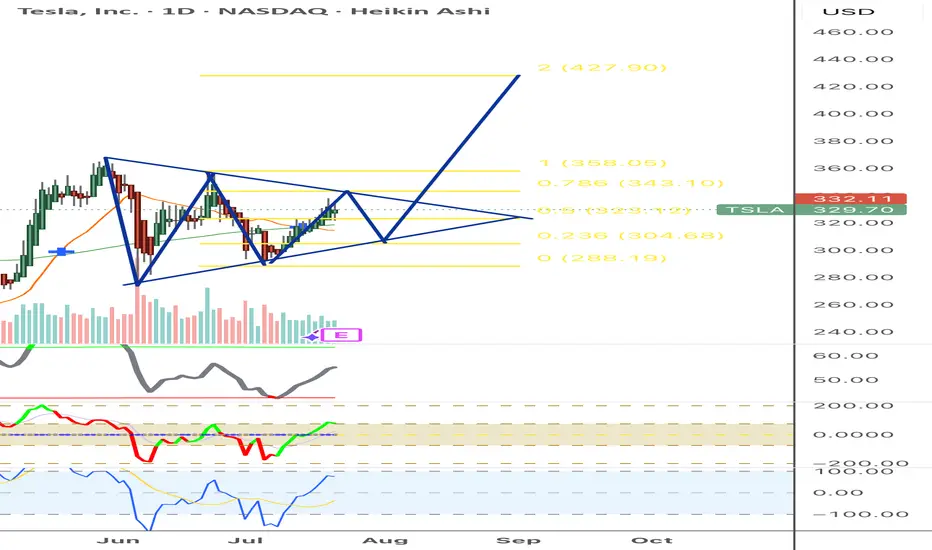
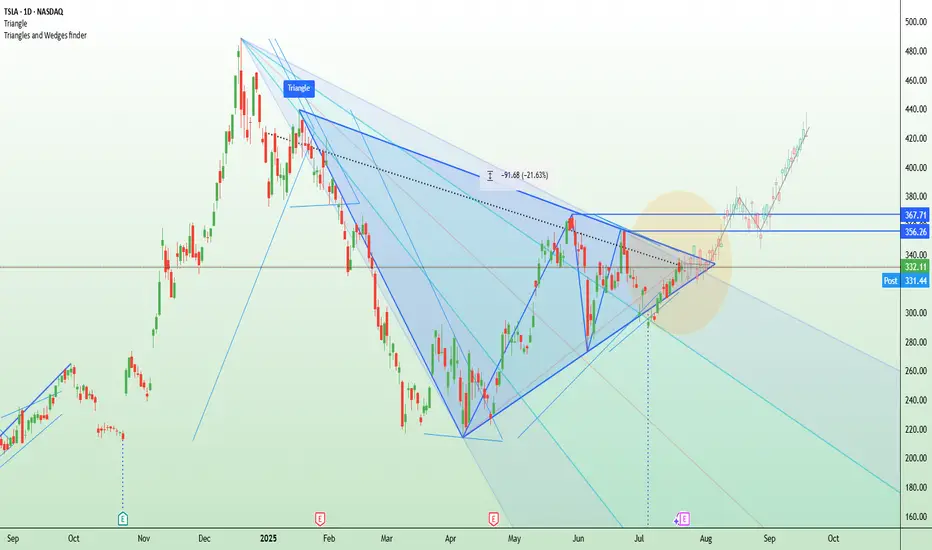
In our analysis of TSLA charts dated 2 July and 8 July, we outlined a scenario in which the stock price could form a broad contracting triangle, with its axis around the $317 level.
The new candlesticks that have appeared on the chart since then have reinforced the relevance of this triangle, as the price rebounded from the lower boundary (as indicated by the arrow) and headed towards the upper boundary. However, yesterday’s earnings report disrupted this upward move.
Thus, while the broader stock market is trending higher (with the S&P 500 reaching a historic high yesterday), TSLA may remain "stuck" in a consolidation phase, fluctuating around the $317 level—at least until new fundamental drivers shift market sentiment.
This article represents the opinion of the Companies operating under the FXOpen brand only. It is not to be construed as an offer, solicitation, or recommendation with respect to products and services provided by the Companies operating under the FXOpen brand, nor is it to be considered financial advice.

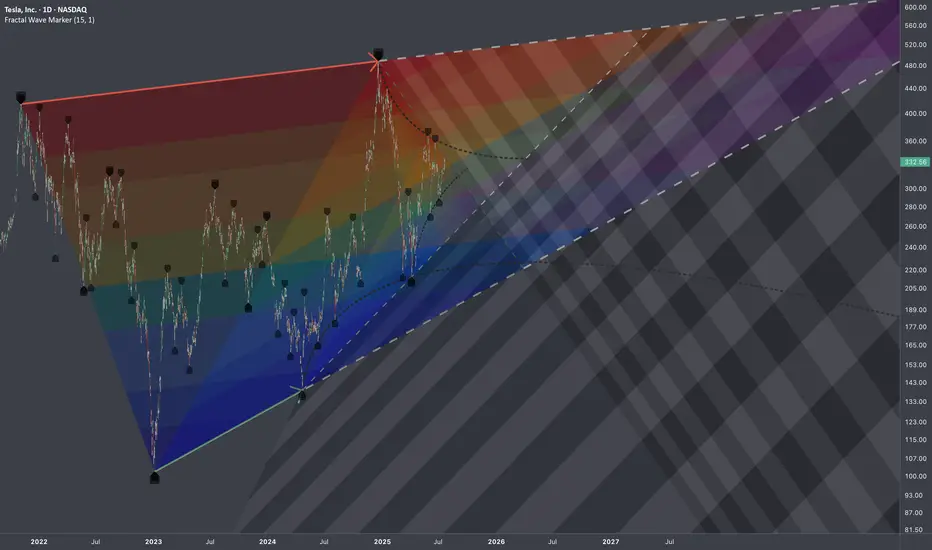
$TSLA: Multi-Scale DensityResearch Notes
Identified structural compressions happening within two periods:
This set has provided a perfect opportunity to study exponential fibs with growth rate starting from phi^1/4 applied to area of expression of squeeze.
Geometrically, gives a better sense of a continuity than regular fibs.
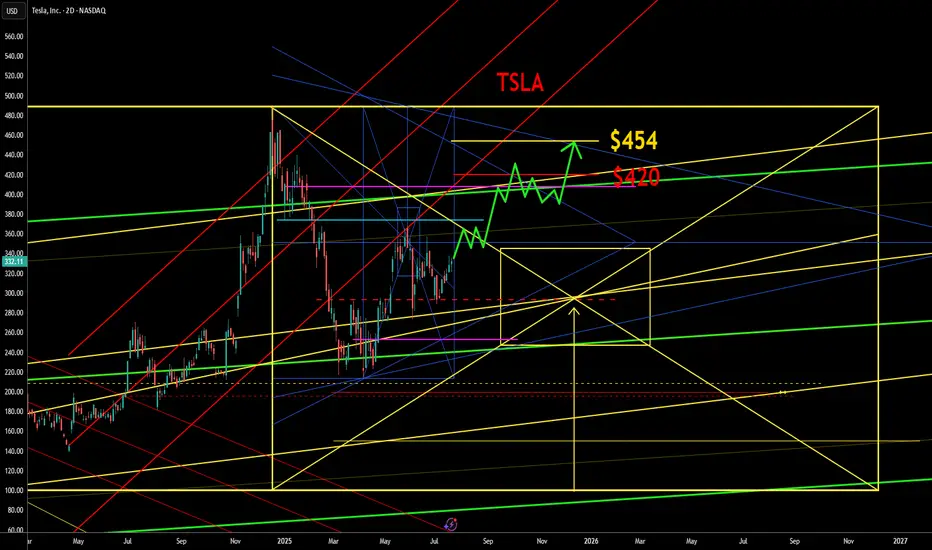
TSLA to $450-$500 this year Technicals:
Big Picture: Huge wedge breakout, followed by retest and bounce, and now we are flagging.
2Month Chart: Every time TSLA has had a hammer candle on the 2M chart, we have rallied hard within 2-7 months.
100 SMA on the daily: Everytime TSLA’s daily 100 SMA has gone from an extended downslope to upsloping (with the addition of some wedge breakout or Inverted H&S), it’s been the beginning of a rally.
Fundamentals: While this analysis is primarily technical, Tesla’s long-term prospects, its strong base of loyal investors, and the high level of short interest believing its already over priced- suggests to me that the technicals are signaling a huge run this year to $450-$500+.

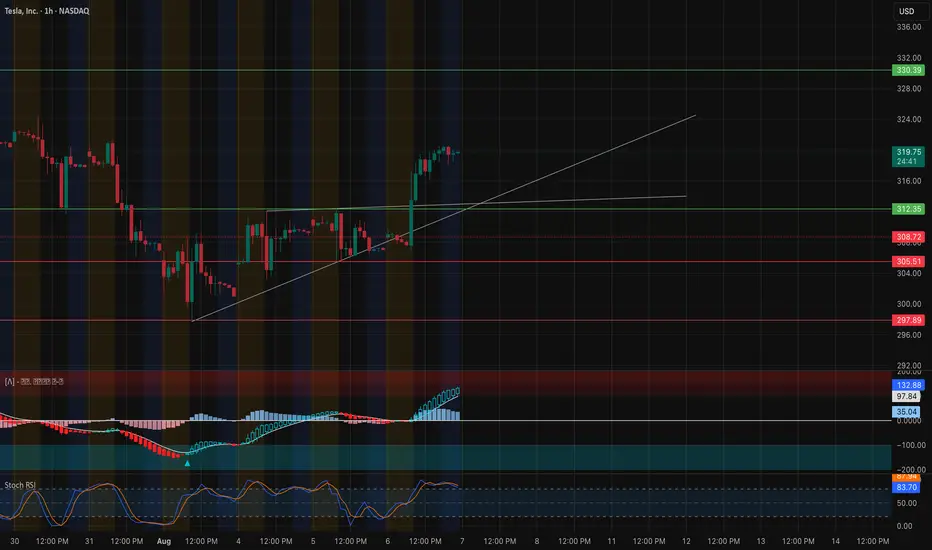
TSLA Breaking Out — But Can It Hold Above $320? Aug. 7📊 Technical Analysis (1H + 15-Min Confluence)
TSLA has surged out of its $308–$312 consolidation range with strong bullish momentum. It's now pressing against the key resistance zone just under $320, with clean price structure and a rising trendline.
* Trend: Higher lows with a breakout above structure = bullish continuation bias
* MACD: Bullish crossover + expanding histogram = momentum building
* Stoch RSI: Overbought at 88+ = short-term cooling possible, but not a sell signal on its own
* Volume: Strong breakout volume confirms interest — now needs follow-through above $320
Key Levels to Watch:
* Support Zones:
* $317.50 (micro support)
* $312.35 (breakout base / trendline confluence)
* $308.72 (former top of range)
* Resistance Zones:
* $319.85 (current high)
* $322.50 (major gamma wall)
* $325 → $330.39 (stacked supply above)
Scalping Setup (15-Min View):
* Entry (CALLs): Break and hold above $320
* Target: $322.50 then $325
* Stop: Below $317.50
* Bias: Momentum continuation as long as price holds trendline + VWAP
🔬 GEX-Based Option Sentiment (1H GEX Map)
The options market is now showing significant gamma resistance overhead, making this a crucial inflection zone:
* CALL Walls:
* $319.85 = 2nd CALL Wall (95.21%) — this is where price is currently pausing
* $322.50 = 3rd CALL Wall (86.55%)
* $325–$330 = GEX10/GEX7 cluster — potential fade zone
* PUT Support:
* $305 = HVL + strong buyer interest
* $300 = -26.58% PUT Wall
* $297.83 = 3rd PUT Wall — major dealer de-hedging zone
* Net GEX Bias:
* Positive GEX above $312.50 → bullish momentum slows as dealers hedge
* Below $305 = faster downside risk (gamma unwind)
* IVR 5.5, IVx Avg 51.4 → IV drop = favorable for buying options, not selling them
🎯 Options Trade Ideas:
* Bullish Swing (Speculative Breakout):
* Entry: Break > $322.50
* Target: $325 / $330
* Stop: < $317.5
* Bearish Fade (Gamma Cap Reversal):
* Entry: Reject below $320 with stalling momentum
* Target: $312.5 / $308
* Stop: Close > $322.5
⚠️ My Thoughts:
TSLA is at a key gamma inflection point. Price structure supports more upside, but dealer positioning above $322.5 may cap momentum unless volume forces a squeeze. Use trendline and VWAP confluence as your confirmation anchors — and watch for failed breakout traps into overhead gamma zones.
This analysis is for educational purposes only and does not constitute financial advice. Always do your own research and manage your risk before trading.
TSLA, Beyond the candlesTSLA has been printing back-to-back bounce signals, with higher lows forming consistently.
Hoping this leads to a sustained uptrend.


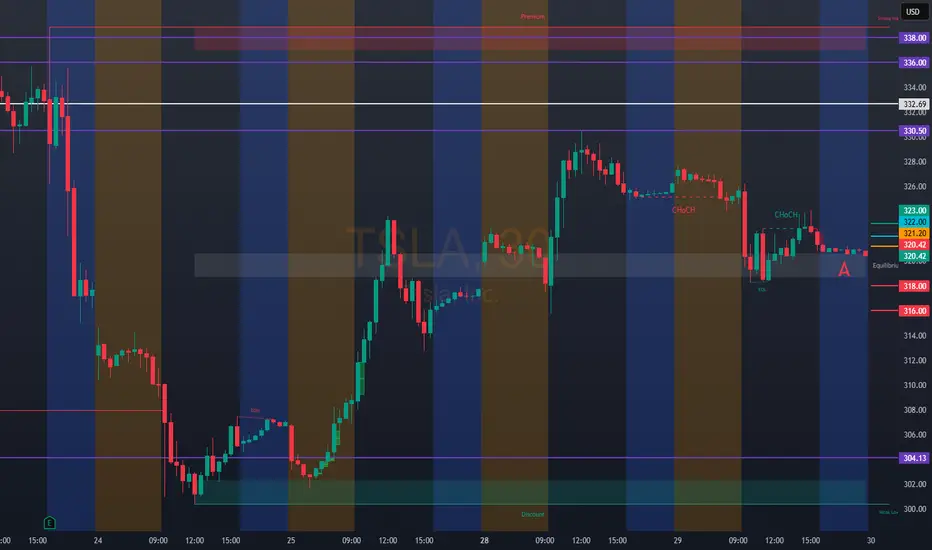
TSLA: 321.20Bullish Entries: 322.00 / 323.00 (high activity) Target:
328.00 / 330.00 Stop:
319.00 TSLA needs to close the earning gap at 332.69. Its continuation price of 332.00/336.00 is within the supply zone. Be very careful.
TSLA WEEKLY OPTIONS SETUP
### 🚗 TSLA WEEKLY OPTIONS SETUP (2025-07-28)
**Big Call Flow. Low VIX. Can Bulls Hold \$325?**
---
📊 **Momentum Overview:**
* **Daily RSI:** 48.2 🔻 → *Neutral-to-Weak*
* **Weekly RSI:** 57.1 🔻 → *Still bullish zone, but falling*
⚠️ **Interpretation:** Momentum is softening, trend in question.
📉 **Volume Context:**
* **Volume Ratio:** 1.3x ⬆️ (vs. last week)
* **Price Change:** -0.77% despite that volume
🔍 *Distribution Alert:* Institutions may be selling into strength.
📈 **Options Flow:**
* **Call/Put Ratio:** **1.70** = 🚨 *Bullish flow confirmed*
* **Volatility (VIX):** 15.16 🟢 Favorable for directional plays
✅ Strong setup for options traders riding short-term momentum
---
### 🧠 **Weekly Sentiment Scorecard:**
* ✅ **Bullish Signals (2):** Options Flow, Volatility
* ⚠️ **Neutral Signals (2):** Daily & Weekly RSI
* ❌ **Bearish Signal (1):** Volume pattern = distribution risk
**Overall Bias:** 🟢 *Moderate Bullish*
---
### 🔥 **TRADE SETUP IDEA:**
🎯 **Strategy:** Long Call Option
* 📌 **Instrument:** TSLA
* 💵 **Strike:** \$355C
* 📅 **Expiry:** Aug 1, 2025
* 💸 **Entry:** \~\$0.75
* 🎯 **Profit Target:** \$1.50
* 🛑 **Stop Loss:** \$0.45
* 🔒 **Key Support to Watch:** \$327.50 — lose that = exit fast
📈 **Confidence Level:** 65%
⚠️ **Gamma Risk:** High → trade small, manage tight.
---
### 📦 TRADE\_DETAILS (JSON Format for Algo/Backtest):
```json
{
"instrument": "TSLA",
"direction": "call",
"strike": 355.0,
"expiry": "2025-08-01",
"confidence": 0.65,
"profit_target": 1.50,
"stop_loss": 0.45,
"size": 1,
"entry_price": 0.75,
"entry_timing": "open",
"signal_publish_time": "2025-08-01 09:30:00 UTC-04:00"
}
```
---
### 🧭 **Quick Notes for Traders:**
* ✅ Bulls have short-term edge — but **momentum is fading**
* ⚠️ If TSLA breaks below **\$325**, exit fast.
* 🔍 Watch for fakeouts: options flow is bullish, but volume says “not so fast.”
---
📊 TSLA \$355C → Risk \$0.75 to potentially double 📈
💬 Will this hold, or is it a bull trap before a dump? 👀
Comment below ⬇️ and follow for Monday updates!
---
**#TSLA #OptionsFlow #WeeklyTrade #TradingSetup #GammaRisk #AITrading #TeslaStock #UnusualOptionsActivity #SmartMoneyMoves**

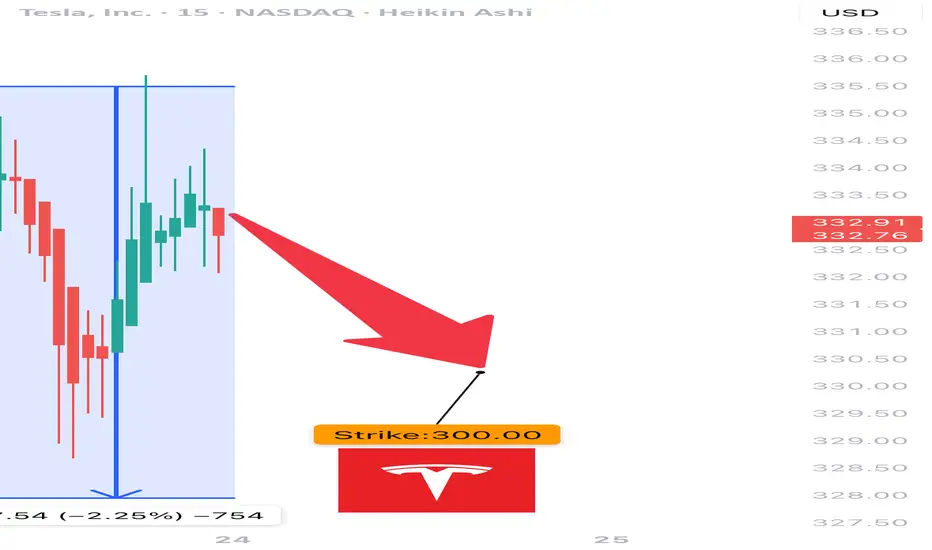
TSLA Earnings Play (Bearish Bias)
🚨 TSLA Earnings Play (Bearish Bias) 🚨
Earnings Date: July 23, 2025 (AMC)
🧠 Confidence: 75% Bearish | 🎯 Target Move: -10%
⸻
🔍 Key Takeaways:
• 📉 TTM Revenue Growth: -9.2% → EV demand weakness
• 🧾 Margins Under Pressure: Gross 17.7%, Operating 2.5%, Net 6.4%
• ❌ EPS Beat Rate: Only 25% in last 8 quarters
• 🐻 Options Flow: High put volume at $330 strike
• 🧊 Low Volume Drift: Trading above 20/50MA but losing steam
• 📉 Sector Macro: EV competition + cyclical headwinds
⸻
🧨 Earnings Trade Setup:
{
"instrument": "TSLA",
"direction": "put",
"strike": 300,
"expiry": "2025-07-25",
"entry_price": 2.02,
"confidence": 75,
"profit_target": 6.06,
"stop_loss": 1.01,
"entry_timing": "pre_earnings_close",
"expected_move": 7.1,
"iv_rank": 0.75
}
⸻
🛠️ Trade Details:
Parameter Value
🎯 Strike Price $300 PUT
💰 Premium Paid $2.02
📅 Expiry Date 2025-07-25
🛑 Stop Loss $1.01
🚀 Profit Target $6.06
📏 Size 1 Contract
⏱ Entry Timing Pre-Earnings
📊 IV Rank 75%
🕒 Signal Time 7/23 @ 14:14 EDT
⸻
📈 Strategy Notes:
• 🧯 IV Crush Risk: Exit within 2 hours post-earnings
• 🎲 Risk/Reward: 1:3 setup | Max Loss: $202 | Max Gain: $606+
• 🧭 Volume Weakness & put/call skew signal downside
• 🧩 Macro + Tech + Flow Alignment = Tactical bearish play
⸻
🧠 “Not all dips are worth buying — this might be one to short.”
📢 Drop your thoughts — would you take the trade or fade it?

TSLA WEEKLY CALL SETUP — 07/23/2025
🚀 TSLA WEEKLY CALL SETUP — 07/23/2025
📈 AI Consensus Signals 🔥 Bullish Move Incoming
⸻
🔍 SENTIMENT SNAPSHOT
5 AI Models (Grok, Gemini, Claude, Meta, DeepSeek) =
✅ MODERATE BULLISH BIAS
➡️ Why?
• ✅ RSI Momentum (Daily + Weekly = UP)
• ✅ Bullish VIX sentiment
• ⚠️ Weak volume + neutral options flow
• 🧠 No model signals bearish direction
⸻
🎯 TRADE IDEA — CALL OPTION PLAY
{
"instrument": "TSLA",
"direction": "CALL",
"strike": 380,
"entry_price": 0.88,
"profit_target": 1.76,
"stop_loss": 0.44,
"expiry": "2025-07-25",
"confidence": 65%,
"entry_timing": "Open",
"size": 1 contract
}
⸻
📊 TRADE PLAN
🔹 🔸
🎯 Strike 380 CALL
💵 Entry Price 0.88
🎯 Target 1.76 (2× gain)
🛑 Stop Loss 0.44
📅 Expiry July 25, 2025
📈 Confidence 65%
⏰ Entry Market Open
⚠️ Risk High gamma / low time (2DTE)
⸻
📉 MODEL CONSENSUS
🧠 Grok – Bullish RSI, cautious due to volume
🧠 Gemini – Momentum confirmed, weekly strength
🧠 Claude – RSI + VIX = green light
🧠 Meta – 3 bullish signals, minor risk caution
🧠 DeepSeek – RSI + volatility favorable, careful on size
⸻
💬 Drop a 🟢 if you’re in
📈 Drop a ⚡ if you’re watching this flip
🚀 TSLA 380C looks primed if we break resistance near $376
#TSLA #OptionsTrading #CallOptions #WeeklySetup #AIPowered #MomentumTrade #TeslaTrade #GammaRisk #ZeroDTEReady

TSLA VolanX Earnings Strategy: Short-Term Bearish Bias (TEST)🧠 VolanX Earnings Strategy: Short-Term Bearish Bias
🎯 Goal:
Capitalize on downside or neutral reaction to earnings with defined risk and IV crush protection.
🔻 Primary Trade: Bear Put Spread
Strategy: Buy Put at ATM, Sell Put at lower strike
Expiration: July 25, 2025
Structure:
Buy 330 Put
Sell 315 Put
Max Risk: Premium paid (e.g., $5–6 per spread)
Max Profit: ~$15 if TSLA closes ≤ 315
Breakeven: ~$325
📈 Why This Works:
Aligns with DSS projection ($317.74 30-day)
Short expiry captures earnings move + IV crush
Profits if stock stays below ~325 post-earnings
🟨 Alternative Trade: Neutral-to-Bearish Iron Condor
If expecting rangebound post-earnings:
Sell 340 Call / Buy 345 Call
Sell 315 Put / Buy 310 Put
Credit: ~$3.50–4.00
Max Risk: ~$1.50–2.00
Profit Zone: 315–340
Best if TSLA volatility collapses and price stays in a channel.
🧨 High-Risk, High-Reward: Put Ratio Backspread
Buy 2x 320 Puts
Sell 1x 330 Put
Cost: Small debit or credit
Profit: If TSLA tanks → big delta gain
Risk: Small near expiry if TSLA closes near 320–330
Use this only if expecting a big bearish surprise.
🔧 Risk Management:
Position size = max 1–2% of account
Avoid holding spreads past Jul 25 if IV collapses
Use alerts around 330 / 325 / 317.5 for exits
🧠 DSS-Backed Tagline:
"With DSS projecting a controlled pullback and flow confirming overhead hedging, we favor bearish verticals and vol crush plays going into earnings."

TSLA to $420 - $454 areaTSLA is ready and primed to move into the $420 - $454 area over the coming quarter. This is a good options play.
We will encounter a little expected resistance at the $360 area, then an aggressive move to the $420 area.
TESLA PRICE ACTION 22 JULY 2025This is the price action for Tesla. i have discussed indicators as well. Do not blindly trade without understanding the logics. I am long here with stocks & calls.
NOTE: DO NOT BLINDLY BUY

TSLAJust another observation to see if this will play out? I’m not in the market, this just for my own play tracking to see how things work out
TESLA'S BEST CASE SCENARIO, $1100 BY DECEMBER?The sequel to my last long-term Tesla video: The Worst Case Scenario, but this time, we look at the best case scenario to determine where NASDAQ:TSLA could go from here

TSLA squeezes into resistance ahead of earnings Tesla is set to report Q2 earnings after the closing bell on Wednesday, covering the quarter ending June 2025.
The stock has been highly volatile this year, amid concerns about tariffs, Elon Musk’s politics (and nazi salutes), and his public clashes with President Donald Trump.
Tesla bulls Wedbush think, “We are at a 'positive crossroads' in the Tesla story,” suggesting that investors will look past the current numbers and focus on Tesla’s long-term AI potential.
Technically, Tesla is now testing a major descending trendline that’s capped every rally since December. The current price action resembles an ascending triangle pattern — a bullish structure — with resistance around $356 and a series of higher lows from May through July. This tightening formation suggests building pressure ahead of the earnings release.
$TSLA Weekly Call Play – 07/22/25
🚀 NASDAQ:TSLA Weekly Call Play – 07/22/25
RSI Bullish 📈 | Options Flow Strong 🔁 | Volume Weak 💤 | 3DTE Tactical Entry
⸻
📊 Market Snapshot
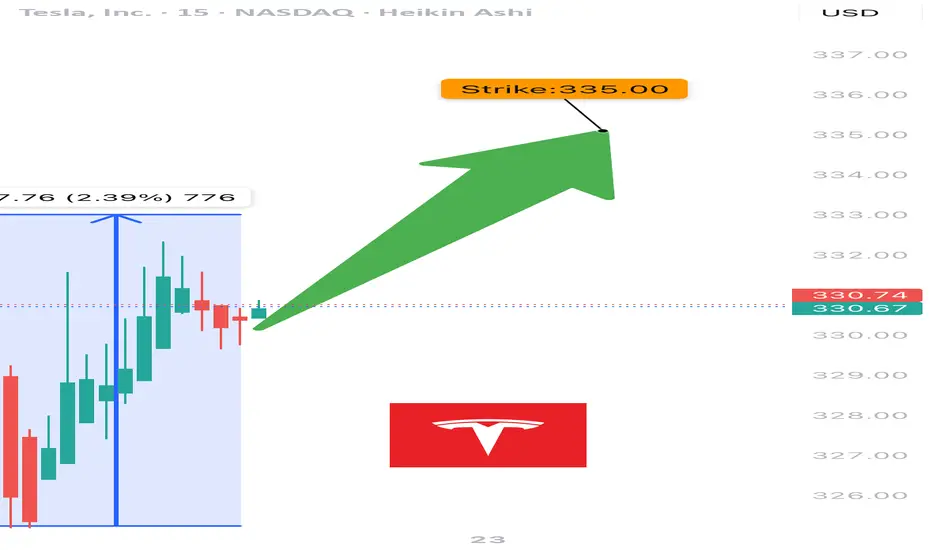
• Price: ~$332–335 (spot near strike)
• Call/Put Ratio: 🔁 1.24 – Bullish Flow
• Daily RSI: ✅ 57.6 – Rising momentum
• Weekly RSI: ⚠️ 54.8 – Neutral / flattening
• Volume: ❌ Weak – Institutional absence
• Gamma Risk: ⚠️ Moderate (DTE = 3)
• VIX: ✅ Favorable
⸻
🧠 Trade Setup
{
"Instrument": "TSLA",
"Direction": "CALL",
"Strike": 335.00,
"Entry": 9.90,
"Profit Target": 15.00,
"Stop Loss": 6.00,
"Expiry": "2025-07-25",
"Confidence": 0.65,
"Size": 1,
"Entry Timing": "Open"
}
⸻
🔬 Sentiment Breakdown
Indicator Signal
📈 Daily RSI ✅ Bullish – confirms entry
📉 Weekly RSI ⚠️ Flat – no long-term edge
🔊 Volume ❌ Weak – no institutional bid
🔁 Options Flow ✅ Bullish (C/P = 1.24)
💨 VIX ✅ Favorable for upside trades
⏳ Gamma Decay ⚠️ High risk (3DTE)
⸻
📍 Chart Focus
• Support Zone: $328–$330
• Breakout Watch: $335+
• Target Zone: $340–$345
• ⚠️ Risk Watch: Volume divergence + gamma decay on low move
⸻
📢 Viral Caption / Hook (for TradingView, X, Discord):
“ NASDAQ:TSLA bulls flash 335C with confidence, but volume’s asleep. RSI’s in, gamma’s ticking. 3DTE lotto with caution tape.” 💥📉
💵 Entry: $9.90 | 🎯 Target: $15.00+ | 📉 Stop: $6.00 | ⚖️ Confidence: 65%
⸻
⚠️ Who This Trade Is For:
• 🔁 Options traders chasing short-term call flows
• 📈 Momentum scalpers riding RSI pop
• 🧠 Disciplined risk managers eyeing 3DTE setups
⸻
💬 Want a safer bull call spread (e.g., 330/340) or risk-defined iron fly for theta control?
Just ask — I’ll build and optimize it for you.
TESLA and the Elliott Wave Theory.This Chart shows a large Flat correction with Wave A and B(Black) completed. Wave B(Black) expressed itself in 3 waves namely A,B,C and are shown in Red. After B(Black) completed, a Wave C(Black) began so as to round off the Flat correction. A Wave 1(Green) formed, followed by a Zigzag correction and this meant a Flat for Wave 4(Green) was expected. After the Zigzag at Wave 2(Green), our Wave 3(Green) expressed itself in 5 Waves and are shown in Black. Wave 2(Black) was a Zigzag correction and Wave 4(Black) as expected, was a Flat. Wave 4(Black) completed recently meaning we are headed for a Wave 5(Black) which is also our Wave 3(Green). A confirmation at its current price location would trigger a sell.
Please note that Wave 5's(Black) location on the chart is purely for demonstration and price could move beyond or around this point.
@fantasyste
