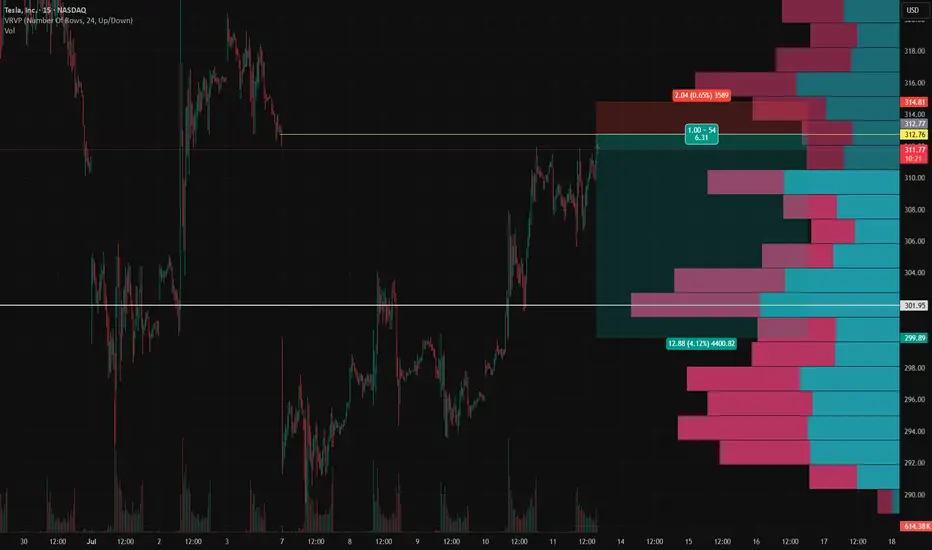
TSLA Short Setup – Fading the July 7 Gap FillTSLA Short Setup – Fading the July 7 Gap Fill 📉
This short idea on TSLA builds off a key gap fill from Monday, July 7 , combined with a strong local volume profile and risk-reward alignment on the 15-minute chart.
Entry: $312.76
Stop Loss: $314.81 (above gap resistance and local high)
Target: $299.89 (gap base and volume shelf)
RR: ~6.3R
Why I'm shorting here:
TSLA has just filled the July 7 gap , which often acts as a technical resistance zone on retest.
Price stalled right as it completed the fill — with visible hesitation and selling pressure stepping in.
VRVP shows low liquidity above, suggesting diminished reward for upside continuation.
Below, there's a clean volume shelf around $294–$300 that could attract price if weakness confirms.
Trade Logic:
This is a classic fade-the-gap-fill setup, targeting the lower edge of the volume cluster for a potential bounce or reversal zone.
As always: size accordingly, stick to the stop, and don’t chase if the entry’s already gone.
Thoughts? Anyone else watching this gap level?
TSLA trade ideas
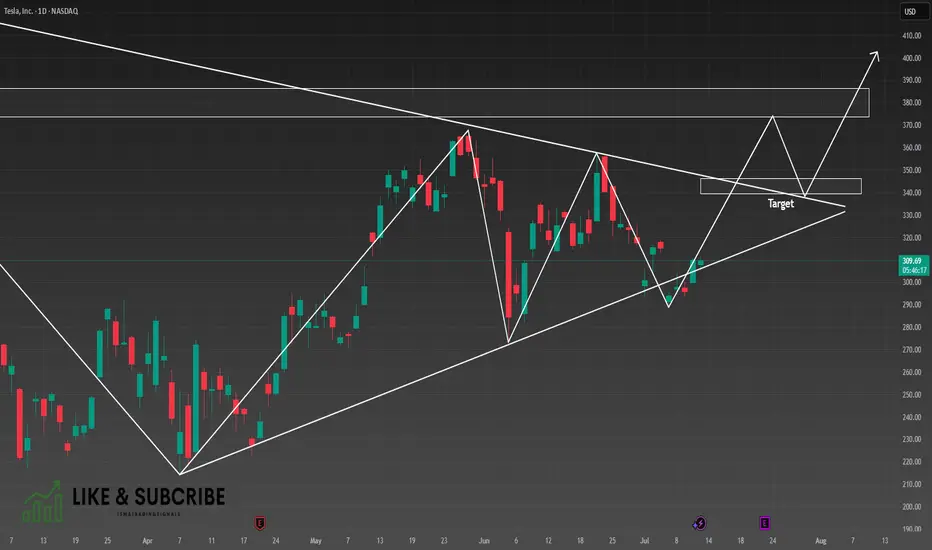
TSLA, Long, 1D✅ TSLA has just broken out of a clear symmetrical triangle pattern, signaling a potential bullish continuation.
Yesterday’s daily candle was a white Marubozu, indicating strong buying pressure and clear dominance by the bulls.
LONG 📈
✅ Like and subscribe to never miss a new technical analysis! ✅
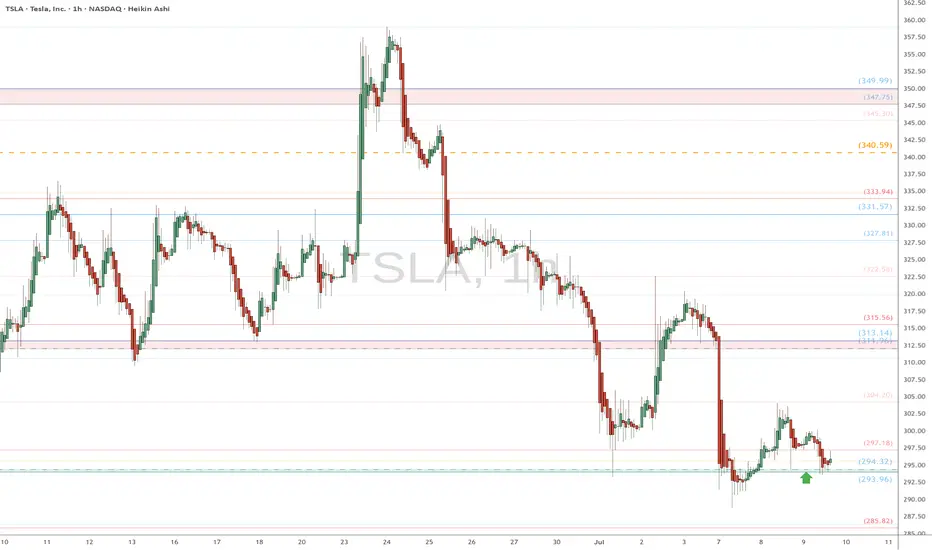
TSLA eyes on $294: Key Support for bulls to hold or face $253TSLA oscillating all over the place thanks to Musk moves.
Currently testing a key support zone $293.96-294.32.
Loss of this floor opens the Golden Genesis at $253.57
See "Related Publications" for previous charts ------------>>>>>>
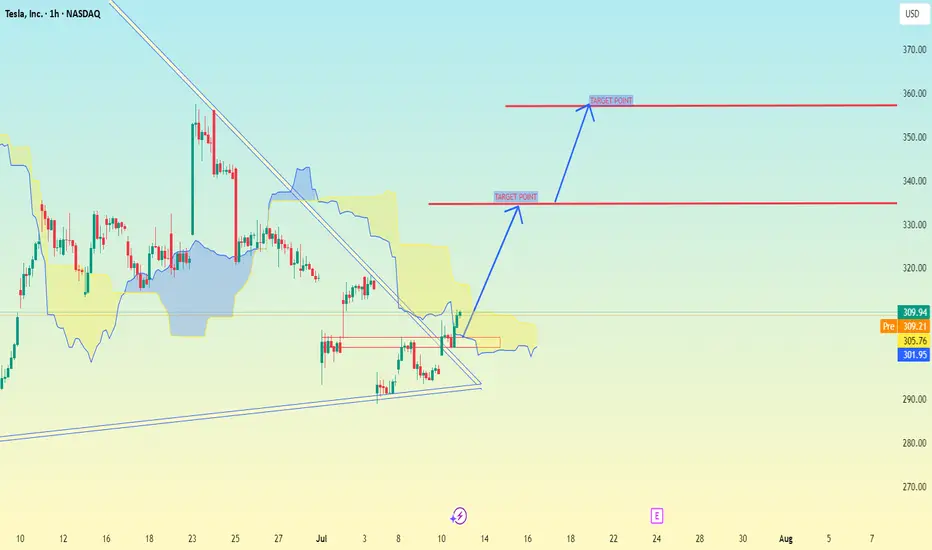
Tesla (TSLA) 1-hour chartTesla (TSLA) 1-hour chart im provided, here are the key bullish target points indicated by the chart analysis:
📈 Bullish Target Points (Upside Levels):
First Target Point:
🔹 Around $338.00 – $340.00
This level is marked as the initial breakout target, likely based on recent price structure and resistance zone.
Second Target Point (Extended Target):
🔹 Around $362.00 – $364.00
This is the higher target zone, representing a potential move if bullish momentum continues strongly. Likely aligning with a measured move or previous highs.
🧠 Context:
Price has broken out of a descending triangle/wedge pattern, a bullish signal.
It's also moving above the Ichimoku cloud, showing short-term bullish trend continuation.
Holding above the breakout level (around $305–$308) is critical to maintain upward momentum.
Triangle Pattern in TSLALooking at 4H-1D Chart, there is a triangle pattern emerging which may target 400 area. Good luck.
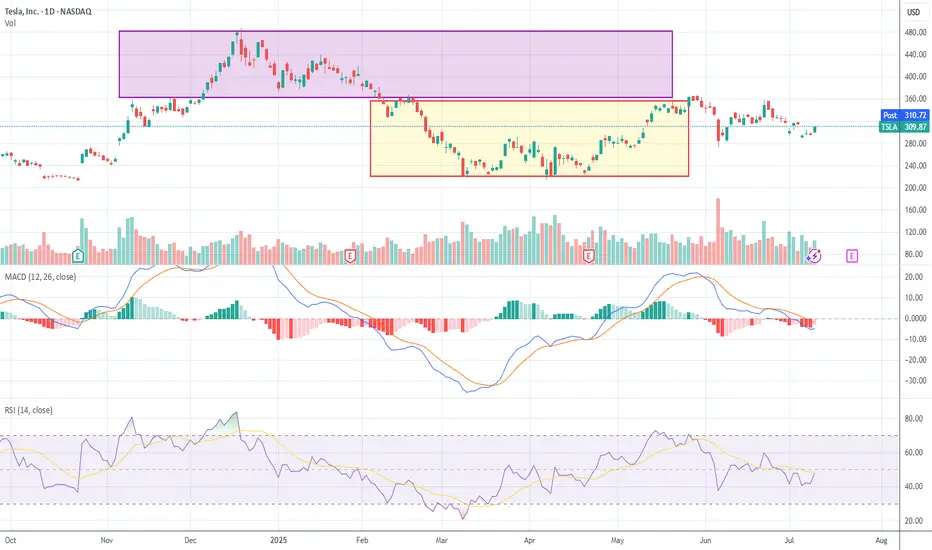
Tesla Flashes Bullish Reversal: Engulfing Candle and Volume PoinLet’s reassess TSLA now that we have this new candle (a big move +4.73%) in context. This changes things substantially, so I’ll reapply candlestick techniques, assess trend health, box positioning, and momentum.
Candlestick Analysis
The new candle:
Large white body (+4.7%) closing at $309.87. Engulfing prior 2 candles’ real bodies → this is a Bullish Engulfing Pattern. Occurs near the 50% retracement ($290) zone (previous support). Volume expanded vs prior days → adds validity. Bullish engulfing after a down leg is an early reversal signal.
Context:
This happens after weeks of indecision candles (spinning tops / dojis) → classic “coiling” behavior before expansion.
Trend Health & Momentum
MACD: Still below zero but histogram bars turning less negative → momentum starting to shift.
RSI: Up to ~47.6, breaking out of its down channel. A move >50 would confirm momentum pivot.
Box Dynamics
TSLA just punched through the upper edge of Box 2 ($300) with conviction.
Now entering “no man’s land” between Box 2 ($300–$360) and Box 1 ($360–$465).
For a sustained breakout it must close above $306–310 range for 2-3 days. Ideally see follow-through with a test of $328 (78.6% Fib).
Tactical Breakdown
✅ Breakout case (higher probability now):
Bullish Engulfing + volume expansion at support zone.
Closing above $306-310 increases odds of a run toward $328 (78.6%) and possibly $360.
❌ Reversal back down (lower probability):
Only if TSLA immediately rejects $310 and falls back below $300 in the next 1–2 sessions.
This price action looks like accumulation showing its hand. Large white candle suggests buyers absorbing supply at prior resistance.
Breakout above $306 confirmed if follow-through continues. Odds for a reversal lower just dropped sharply after today’s engulfing.
TSLA racing to break thru resistancearea 1: 340
area 2: 360
will be tuned into earnings to see if the jig is jiggin July 23rd.
Elon is busy. so let's see what's the dealio.
****280 is a key level
**300 needs to hold for these attempts
Why TSLA will Crash based On Copper TarrifsHere’s why that bearish outlook is gaining traction:
Copper costs are surging: Tesla uses over 180 pounds of copper per vehicle. With prices spiking 13% in a single day and a 50% tariff looming, production costs are rising fast.
Analysts are cutting price targets: UBS, JPMorgan, and Bank of America have all lowered their forecasts for Tesla, citing margin pressure and weakening demand3.
Brand sentiment is shaky: Tesla’s recent delivery miss and political controversies around Elon Musk have added to investor unease.
Tariff ripple effects: The broader trade war is expected to disrupt supply chains and inflate costs across the EV sector5.
That said, some analysts still see long-term upside if Tesla can pivot quickly—especially with its AI and autonomous driving ambitions. But for now, the market is reacting to the immediate risks.
Overall Enter Short for Gains of 3-5 percent.
Tesla (TSLA) Market UpdateTesla NASDAQ:TSLA shares dropped nearly 7% after Elon Musk dismissed analyst Dan Ives' suggestion to scale back his political activities. Musk also proposed a new pay package, raising concerns among investors about potential distractions from Tesla’s core business.
📊 Upcoming Catalyst:
Tesla is set to report its Q2 earnings on July 23, with investors eagerly awaiting updates on the company’s financial performance and the newly launched robo-taxi service in Austin, Texas.
⚠️ Sentiment:
Recent bearish headlines include:
Concerns over potential Robotaxi issues
The ongoing Trump/Elon Musk political drama
📈 Trading Opportunity (Long Setup):
Despite the negative sentiment, this dip could offer a solid long entry opportunity:
Entry Zone: $275–$270
Take Profit Targets:
TP1: $315
TP2: $335
Stop Loss: Close below $265
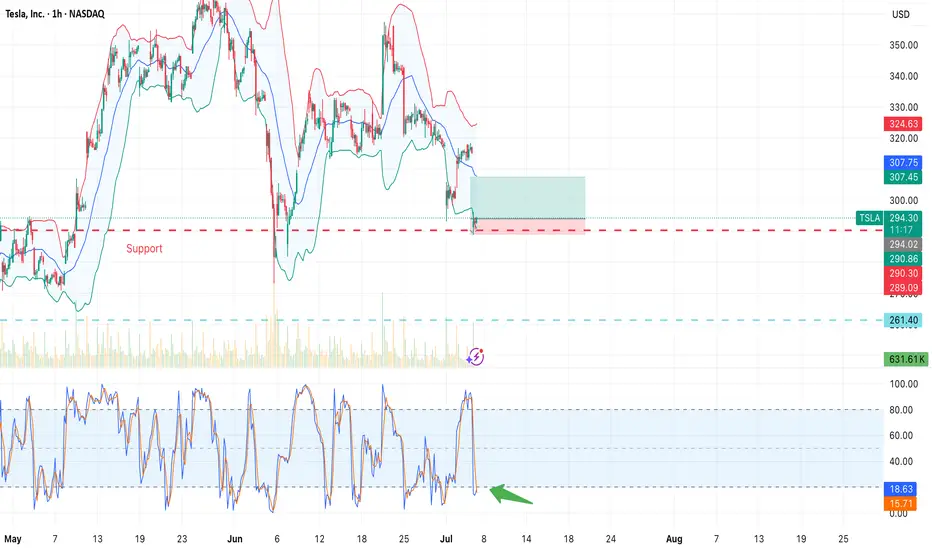
TSLA Long Idea — Buying the Support After News-Driven DipNASDAQ:TSLA price has stabilized near the key $290–291 support zone, a level that has previously triggered rebounds. This presents a solid entry opportunity with limited downside risk.
Context: The recent drop was triggered by headlines involving the U.S. President and Elon Musk. If this was mainly speculative noise, now could be the best time to buy, as the market absorbs the news and finds technical support.
Technical Setup:
• Strong support at $290–291 holding firm.
• Stochastic is in the oversold zone and starting to turn upward.
• Bollinger Bands tightening — breakout likely.
• Target: $307.45 (+4.57%)
• Stop-loss: $289.09 (−1.68%)
• Risk/Reward Ratio: 2.72
Expected move by July 9, 2025. With strong technical signals and fading news impact, this setup offers a favorable risk/reward for bulls looking to ride a rebound.
Long TESLATrading Fam,
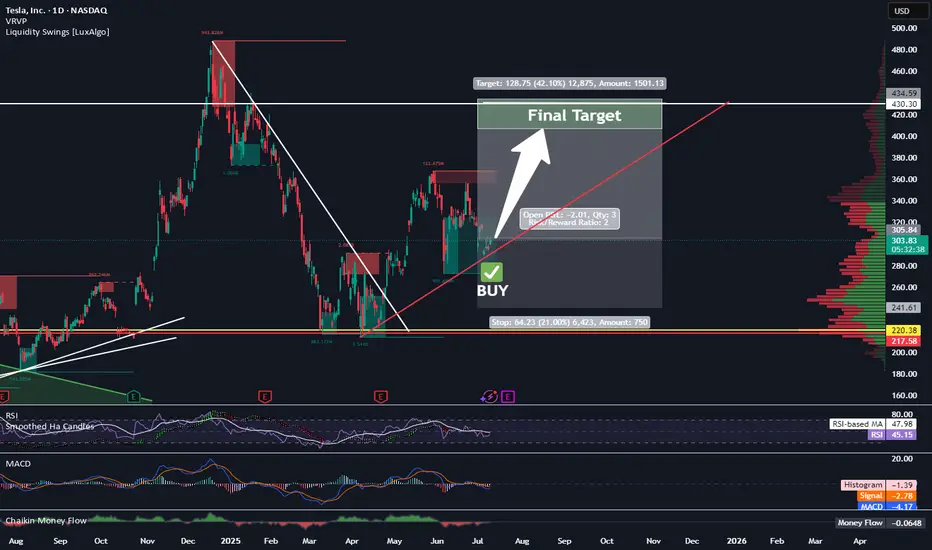
Today my indicator has signaled a BUY on $TSLA. The technicals align. M pattern looks to have completed at strong support (RED TL) and is bouncing upwards inside of a solid liquidity block. Buyers are stepping in. I'm in at $315 and will shoot for $430 (probably taking some profit along the way). My SL is currently $241 but will trail as we enter profit.
Best,
Stew
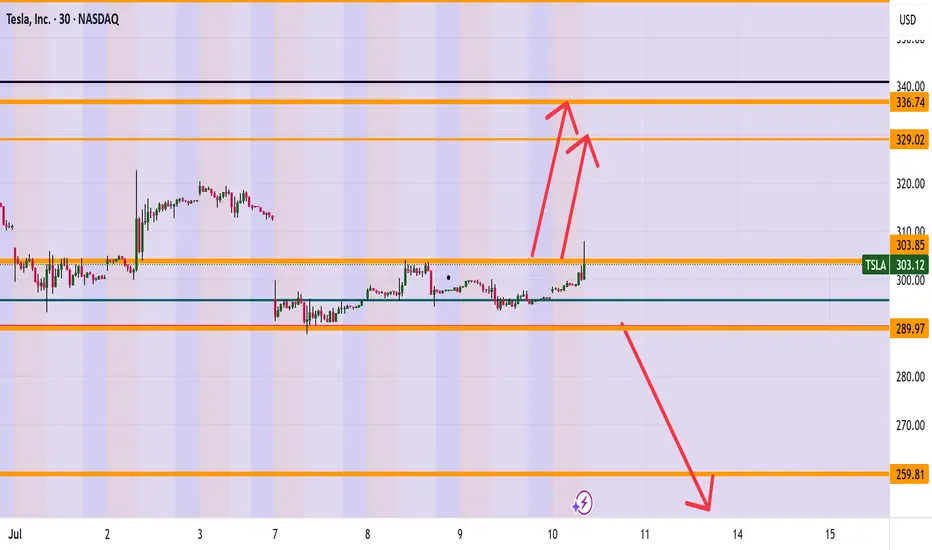
TESLA (TSLA) ARE WE HEADING TO 336? Morning Folks
It appears we are trying to break the highs of 304 and if we are successful a nice range up to 327-336 makes sense. However be careful if sink back down under 289 which then can see levels of 259 getting hit.
What are your thoughts on Tesla? Put in the comments section below
Kris Mindbloome Exchange
Trade Smarter Live Better
TSLA: Buy ideaBuy idea on TSLA as you can see on the chart after the breakout with force the resistance line by the buyers.
TSLA BUY 253.8Recently, TSLA has maintained a volatile operation. Currently, we can pay attention to the area around 253.8 below, which is a potential buying position for a bullish Gartley pattern. At the same time, this position is within the previous demand area.
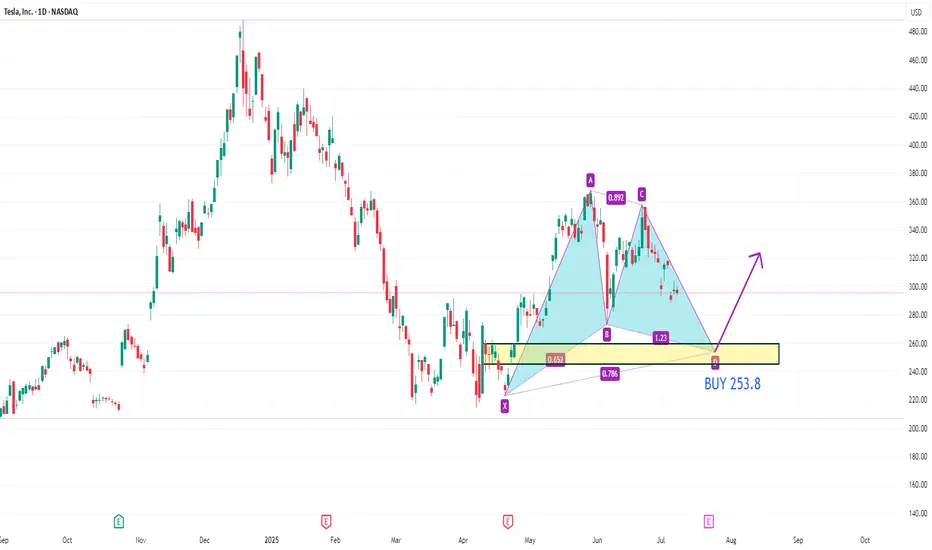
Important Volatility Period: Around August 21
Hello, traders.
If you "Follow", you can always get the latest information quickly.
Have a nice day today.
-------------------------------------
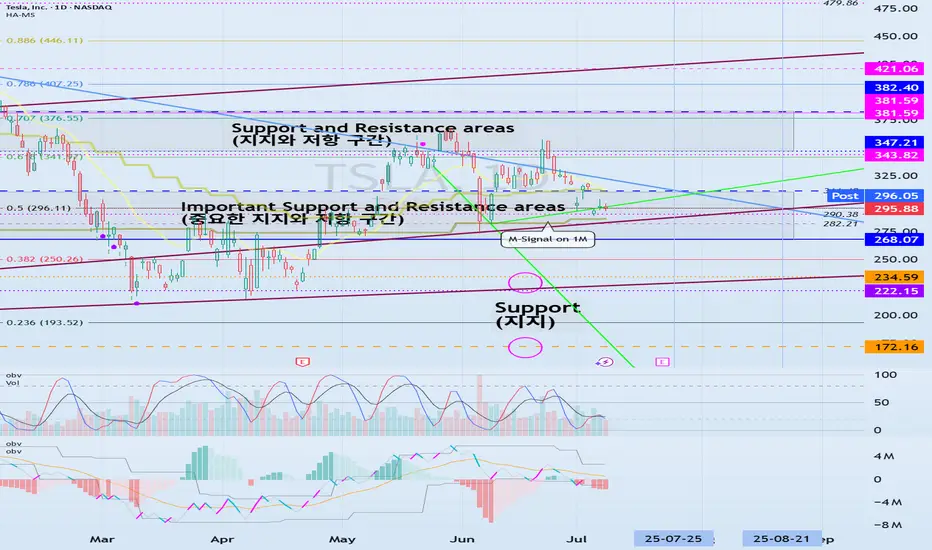
(TSLA 1D chart)
The medium-term trend is maintaining an uptrend.
However, if the price falls below the M-Signal indicator on the 1M chart and maintains, there is a possibility of a downtrend, so caution is required.
The support zone is
1st: 222.15-235.59
2nd: 172.16
Around the 1st and 2nd above.
The 268.07-311.48 zone is an important support and resistance zone.
If the price is maintained above this zone, there is a high possibility that a full-scale upward trend will continue.
However, since a resistance zone is formed in the 347.21-382.40 zone, we need to look at how this zone is broken upward.
-
When it falls to the 172.16-234.59 zone, we need to find a time to buy.
If not, we need to buy when it shows support in the 268.07-311.48 zone.
It would be better to buy at a lower price, but since the investment period will inevitably be longer, I think it is better to buy when an upward trend is detected.
-
The important volatility period is around August 21st, but before that, we need to check the movement around July 25th.
If it falls below 268.07 after August 21st, it could lead to further decline.
If it rises above 311.48 and maintains the price during the movement around July 25th, it could lead to further increase and it seems likely to create a trend after the volatility period around August 21st.
-
Thank you for reading to the end.
I hope you have a successful trade.
--------------------------------------------------
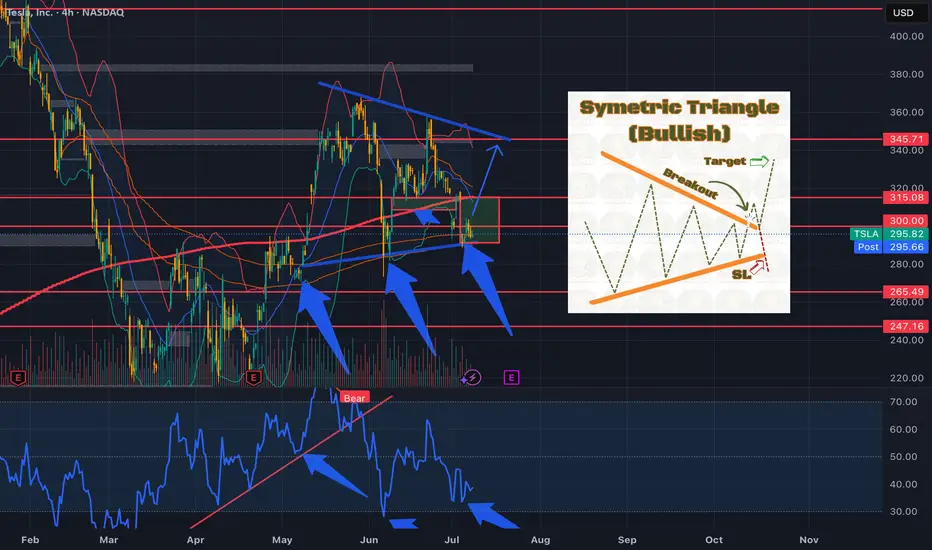
TSLA....Symetric Triangle....Earnings Rally?Could we see the bulls step in and leads us into earnings?
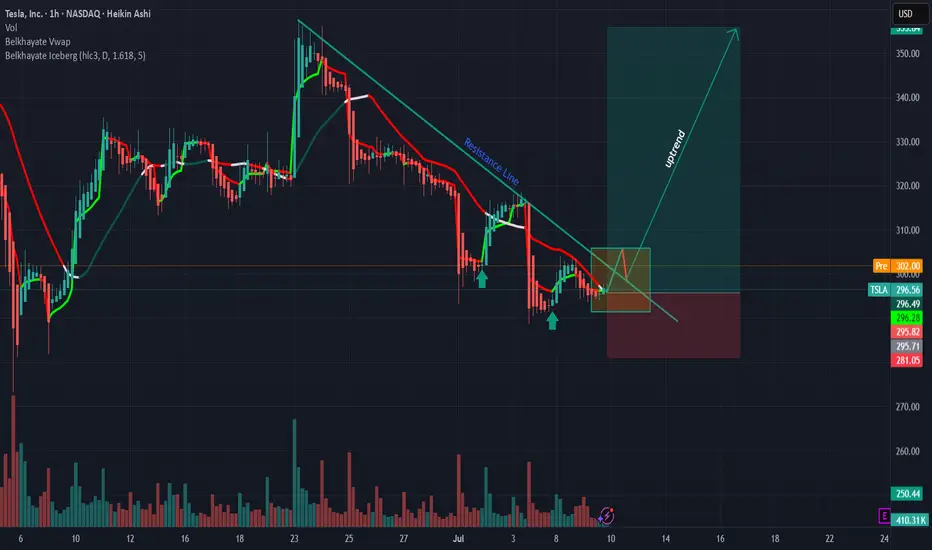
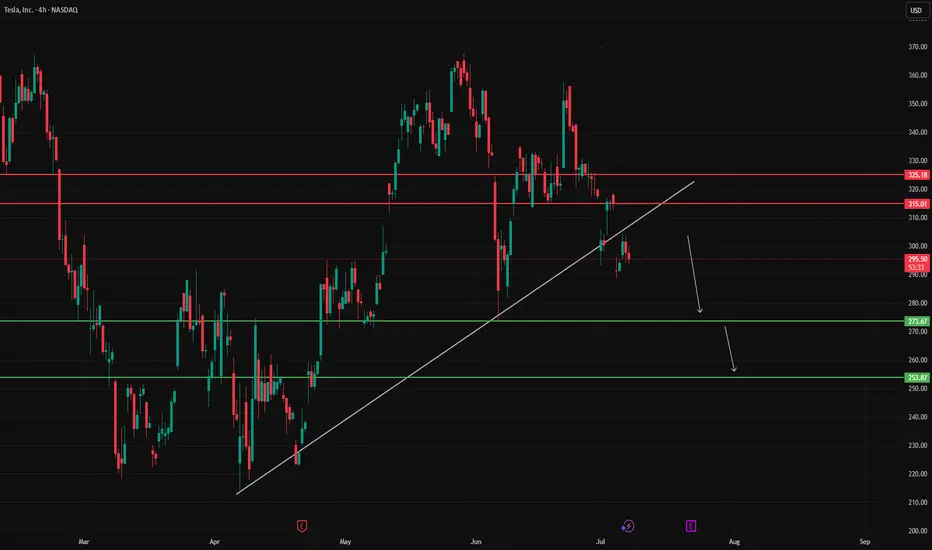
Break of rising trendline TSLA – 4H 🧠
Bias: Bearish
Entry: Below 300.00
🎯 Targets: 273.67 – 253.87
❌ Invalidation: Above 315.01
Break of rising trendline signals bearish momentum. Downside continuation anticipated.
#TSLA #Stocks #NASDAQ #PriceAction #TradingView #piporia
Tsla below 288 ?I see an H&S pattern forming if we break below 288 we could see it drop to 280 ish imo. Can play out this week. Lets see
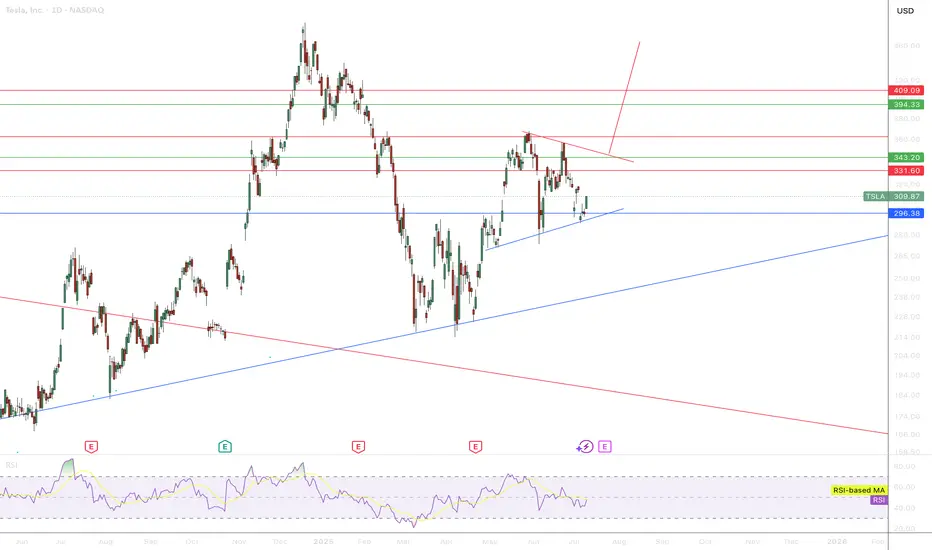
Tesla Share Price at Key Technical LevelTesla’s share price has returned to a well-established upward trendline. The key question now is: will this trendline act as support and trigger a bounce, or will it be breached, attracting further selling pressure and pushing the price lower?
We’d love to hear your thoughts — will the bulls defend this level, or are the bears gaining ground?
$TSLA: Battleground stock. There’re better way to make money. In this bull market where almost all the stocks are working, NASDAQ:TSLA seems to be still in the penalty box. When NASDAQ:NVDA , NASDAQ:MSFT are at ATH and most of the Mag7 are near to the ATH. NASDAQ:TSLA is still 33% below its ATH of 484 $. And the price action is not particularly bullish. This week NASDAQ:AVGO crossed NASDAQ:TSLA with a larger Market Cap cos. May be NASDAQ:AVGO should replace NASDAQ:TSLA in MAG7. A food for thought.
With such poor price action and the price stuck within the 0.618 and 0.382 Fib retracement levels the stock has not looked bullish recently. IN this recent market reversal all the speculative sectors like Quantum, Space stocks and Drone stocks are working, NASDAQ:TSLA is still searching for direction. In my opinion NASDAQ:TSLA has a great future with a visionary leader, but it might end up being a good company but not a good stock. With controversy surrounding the leadership it has become a battle ground stock. There are many large cap liquid stocks where the positive momentum is working. Until the stock breaks out of this consolidating pattern it’s better to make money somewhere else.
Verdict: Stay on sidelines for NASDAQ:TSLA stock. Accumulate if you need to. Buy it above 400 $ once momentum is back.
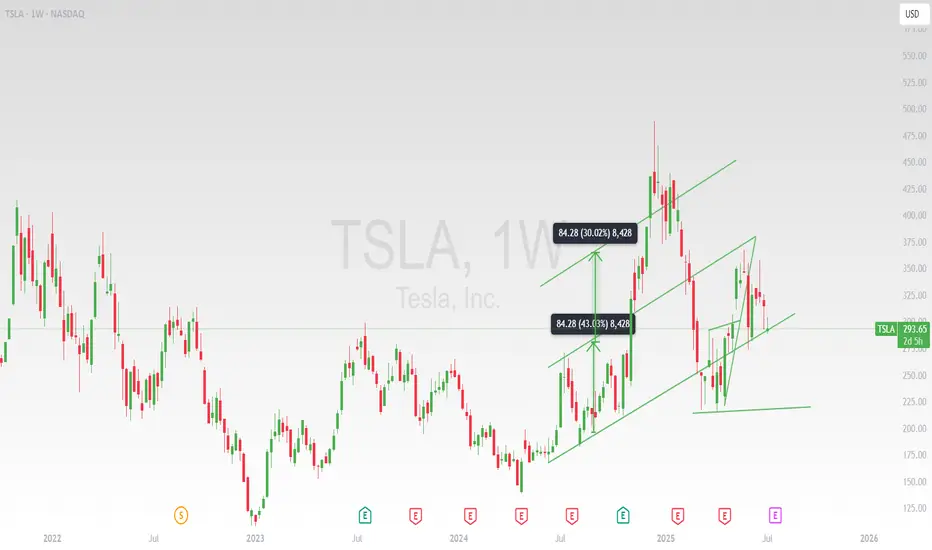
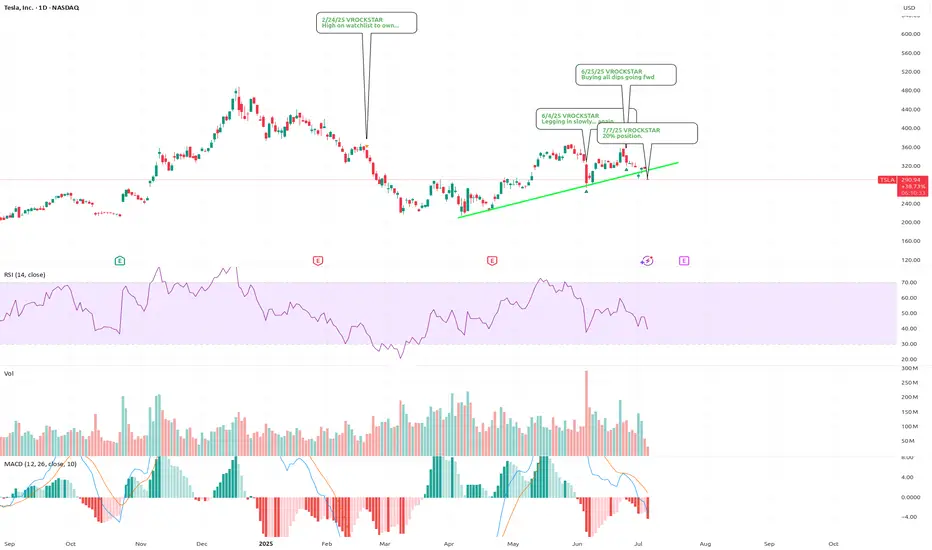
7/7/25 - $tsla - 20% position.7/7/25 :: VROCKSTAR :: NASDAQ:TSLA
20% position.
- that's the message... refer to prior msg "buying all dips"
- u do u
V
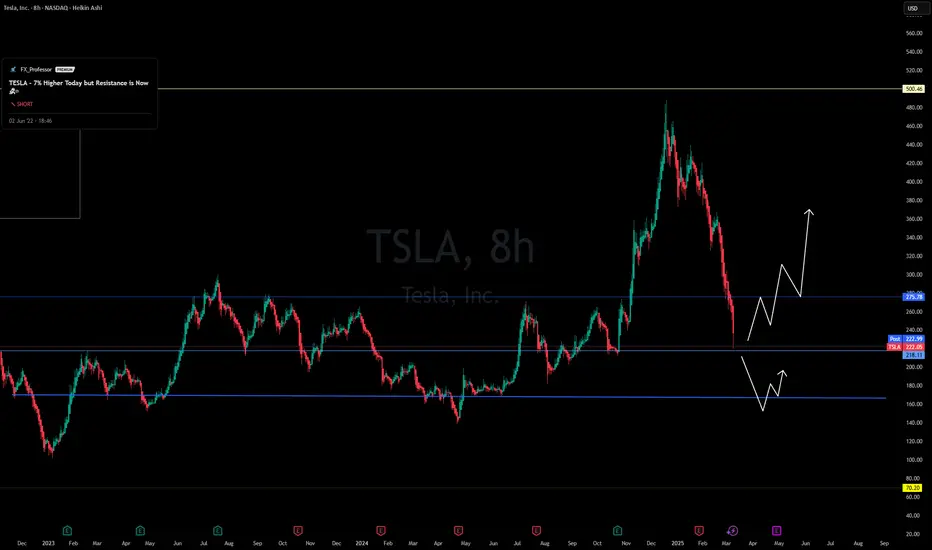
Tesla on the Edge – Key Support or Deeper Drop?📉 Tesla on the Edge – Key Support or Deeper Drop? 🔥🔍
Tesla is in freefall, dropping nearly 9% today. The stock has plummeted from its highs near $500, now testing the critical $220-$200 support zone.
📊 Key Levels to Watch:
📌 Holding $220 could trigger a relief bounce towards $275+.
📌 A breakdown below $200 could open doors to $160-$180, or worse.
🔎 What’s Happening?
Tesla, along with X and SpaceX, is under intense scrutiny amid political pressure, regulatory battles, and even cyberattacks. This aligns with the broader market uncertainty, as Bitcoin struggles to reclaim $79,478.
👀 Elon Musk is in the spotlight, facing global resistance, from social media wars to business challenges. Could this spell opportunity or more downside for Tesla?
⚡️ Will TSLA rebound, or is it heading even lower? Let me know your thoughts below!
One Love,
The FXPROFESSOR 💙
#Tesla #TSLA #ElonMusk #StockMarket #Trading #TechStocks