Turning Stock Declines Into Your Best Trading OpportunityTurning Stock Declines Into Your Best Trading Opportunity
When stocks fall dramatically, many investors panic. But what if those drops were actually the set-up for some of the most lucrative opportunities?
In this article, you’ll discover why sharp declines can set the stage for outsized gains, how the mathematics of recovery works, and how to use classic technical patterns to identify the ideal entry points. And the most important, how to do it easily on Tradingview!
The Power of Recovery: Why a Drop = Big Upside
Every percentage drop in a stock’s price requires a much larger percentage gain to return to its previous high. Recognizing this simple truth can turn “market fear” into “trader’s opportunity.”
Here’s exactly what a stock would need to climb, after various drops, to reclaim old highs:
| Drop (%) | Required Gain to Recover (%) |
|----------|-----------------------------|
| 10 | 11.1 |
| 20 | 25.0 |
| 30 | 42.9 |
| 40 | 66.7 |
| 50 | 100.0 |
| 60 | 150.0 |
| 70 | 233.3 |
If a top-quality stock drops 50%, it needs to go up 100% just to get back, so smart entries after steep drops can double your money on a bounce.
When These Pullbacks Are Opportunity: The Case of Market Leaders
Stocks like Eli Lilly, UNH, Novo Nordisk, ASML, AMD, or Lululemon are examples of quality growth companies that sometimes undergo sharp, hype-driven sell-offs.
Recent history shows:
- Eli Lilly, UNH or Novo Nordisk : Leaders in innovative health solutions, frequently see pullbacks despite strong demand in their sectors.
💊 NYSE:LLY (Down up to 30%)
Most analysts are highly bullish on Eli Lilly , with most giving it a "Strong Buy" rating. The 12-month consensus price target ranges between $956 and $1,016 , suggesting a 25–32% upside from current levels . Optimism is driven by strong momentum in its obesity and diabetes drug pipeline, especially GLP-1 treatments like orforglipron. Risks include high valuation and dependence on future drug approvals.
Technically speaking, Eli Lilly is currently trading within a channel , also known as a flag pattern when it forms during a bull trend. There are two common ways to trade this setup:
You can either wait for the price to drop to the bottom of the channel for a lower-risk entry, or wait for an upside breakout to join the rally at its strongest point.
Both approaches are considered low-risk, high-reward trades. However, entering a position right now is not ideal , as there is still room for the price to decline before a potential breakout in this premium stock.
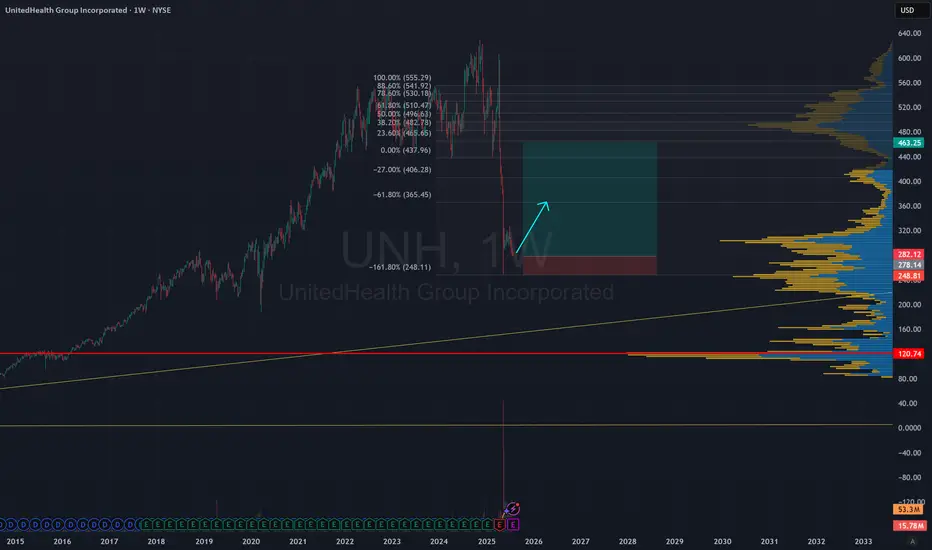
💊 NYSE:UNH (Down up to 60%)
The Analysts are generally positive on UnitedHealth Group , despite recent challenges like CEO changes and regulatory concerns. Most believe the company has strong fundamentals and expect it to recover over time. The average 12-month price target ranges from $380 to $400, which suggests a potential upside of over 60% from current levels . While a few firms have lowered their outlook, the majority still recommend buying the stock.
Technically speaking , the price dropped after breaking below its support zone (red).
It briefly paused in a first support area (blue), where some optimistic buyers stepped in, but eventually continued down to a more important zone.
The green area marks the main trading zone from before COVID , with high volume and strong interest, this is where many institutional investors are likely to see value and start buying this premium stock again .
Interestingly, analysts’ average price targets are below the previous support, suggesting a possible pullback to that area. If this happens, it could mean a 60% to 90% rally for UNH from current levels (though some further decline within the green zone is still possible and as we saw at the start, even more profits!).
💊 NYSE:NVO (Down up to 70%)
Analysts have a cautious but constructive outlook on Novo Nordisk, with an average 12‑month price target of around $80.
While some firms maintain buy ratings, many have recently lowered their views amid mounting competition from Eli Lilly and concerns over copycat semaglutide products depressing growth. A few stronger bulls still point to the long-term potential in obesity and diabetes markets as reasons for future upside. Others see significant headwinds, noting falling demand for legacy drugs and disappointing trial outcomes such as CagriSema setbacks. Overall, most analysts expect a recovery from current levels.
Technically speaking , the price dropped after breaking below a Head and Shoulders pattern , which led to a sharp decline in Novo Nordisk's stock.
The price has now reached a key previous support zone, where the Volume Profile (VRVP) shows significant activity, this often suggests institutional investors may start buying again, viewing the current levels as a bargain. While it's wise to be cautious ahead of tomorrow’s earnings report, the overall downside risk appears limited, given the company’s strong cash flow and solid product pipeline.
That said, investor expectations around obesity and diabetes treatments are no longer as optimistic as they were a few years ago, which could weigh on future growth. Still, from a technical and fundamental standpoint, this area may offer an attractive entry point to sell at $80 for a 70% profit!
Other well-known stocks that could present an amazing opportunity soon include NASDAQ:LULU , EURONEXT:ASML , NYSE:MRK , NASDAQ:PEP , SPOT NYSE:SPOT or $NYSE:PFE. Right now, I don’t see strong patterns in these charts , but they’re approaching interesting buy zones. I’ll be keeping a close eye on them, just in case a setup starts to form.
These tickers, as of August 2025, stand well below consensus price targets, so a recovery from current levels toward analyst consensus highs could deliver powerful returns.
⚠️ An example of previous opportunities
I like to understand the past before trying to predict the future , so it’s fair to show some previous examples of stocks that were "on sale."
The first example is NASDAQ:META
A well-known premium stock that experienced a massive crash during 2021 and 2022 due to the failure of its metaverse strategy. The stock lost more than 75% of its value , a truly astonishing drop. During this period, a falling wedge pattern formed on the chart , indicating that bearish sentiment was fading. After confirming the pattern, the stock went on to rally more than 700% , yes, you read that right, a 700% rally followed.
Later, another crisis, this time triggered by Trump, hit the stock, causing a sharp 35% drop in just a few weeks. Eventually, the price reached a strong buy zone (high VRVP and previous important supports), and in the weeks that followed, we’ve seen a 63% rally that is still unfolding.
During 2025 , we’ve also seen
NASDAQ:NVDA fall 35%, only to come back with a 110% rally .
NASDAQ:MSFT dropped 25% and then delivered an impressive 60% gain afterward.
NYSE:ORCL lost 40% in just a few months, and now we’re seeing a massive rally, up 120% , even outperforming NVDA. Simply amazing.
🚀 Finally, some previous published ideas based on the same principle:
⭐ Buying COINBASE:XRPUSD after a large decline (Yes, the methodology also work for other assets!)
⭐ Buying NASDAQ:DLTR at the bottom, after a 65% decline to enjoy a (for now) 90% rally.
⭐ Buying AMEX:GROY after doing two Double Bottoms and breaking the resistances for a 25% rally.
You can find more Ideas on my profile, always based on Chart patterns with low risk and high returns profile .
⏳ Entry Timing: Rely On Technical Patterns, Not Indicators
The key to entering these stocks efficiently isn’t about moving averages, RSI, or fundamentals. It’s about reading price action, volumes and technical chart patterns that reflect buyer behavior and sentiment shift.
Some famous examples:
- Double Bottom : Two clear lows near the same support zone, signaling sellers are losing strength and buyers may take control. The breakout above the intermediate high is usually a decisive signal of a trend reversal. I have published multiple ideas with double bottoms recently.
- Hammer Candle at Support : After a strong decline, a single candle with a short body and a long lower wick near a known support. This shows aggressive intraday buying, hinting that the sell-off momentum is vanishing.
- High Volume at Support: While volume isn’t a classic “indicator,” a surge in transactions as price holds support often marks institutional buying, confirming higher conviction in a potential bottom. Also the VRVP lateral indicator is a great help to know price levels with masive volume.
Spotting these technical structures on stocks deeply “on sale” lets you step in with a skewed risk/reward: your downside is defined (below support), your upside is open (toward recovery), and your edge comes from patient pattern recognition, not luck.
The TradingView screener is a great tool for finding “on-sale” stocks by filtering based on % Change. Pro Tip : The % Change is set to 1-day by default, but you can adjust it to show up to 1 month using the blue dropdown at the top.
After that, you have pattern recognition indicators like double bottoms or the VRVP for volume zones which are both AMAZING.
🔍 Visualize the Opportunity
Here’s your roadmap :
1. Scan for sharp declines in leading names, ideally those with price objectives far above current prices.
2. Strong technical pattern (double bottom, hammer on support, high-volume reversal days).
3. Wait for confirmation of pattern completion with renewed bullish price action or buy in the support, that is risky, but gives a unique risk reweard ratio when it works!
4. Act decisively when patterns confirm, your entry is efficient, your risk controlled, and your recovery math is in your favor.
> Remember : Technical patterns are your best ally for timing entries during periods of panic-driven price drops. Used well, they help you capture robust returns with clear risk management, making market sell-offs a trader’s opportunity, not a threat.
It seems that this August is a good month to start practicing finding bargains.
💬 Does this post helped you?
🚀 Hit the rocket if this helped you spot the opportunity and follow for more clean, educational Chart Patterns trade ideas!
UNH trade ideas

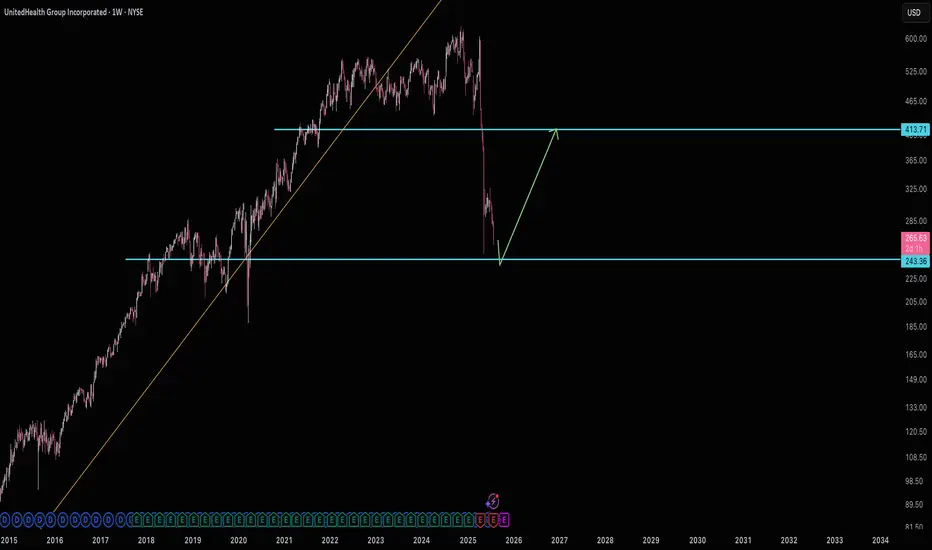
United Health - The perfect time to buy!⛑️United Health ( NYSE:UNH ) finished its massive drop:
🔎Analysis summary:
Over the past couple of months, United Health managed to drop an incredible -60%. This drop however was not unexpected and just the result of a retest of a massive resistance trendline. Considering the confluence of support though, a bullish reversal will emerge quite soon.
📝Levels to watch:
$250
SwingTraderPhil
SwingTrading.Simplified. | Investing.Simplified. | #LONGTERMVISION

Generational Buying Opportunity?UnitedHealth Group, a complete sh*t show of a company. The CEO gets murdered, public sentiment towards insurance companies remain at an all time low.
Is this business salvageable? Well, we now have the veteran CEO return to his former job, he was already on the board and understands the company and industry well.
Can the experienced CEO save this sinking ship? Or will all the rats on board sink, drowning investors along with it?
Nobody knows, that's the truth. And if they do know, no amount of insider buying will save the stock when the selling occurs. It could end up like Enron. I am watching the chart on this very closely. There is a potential huge reward from a return to normality for this business, that is only if you believe.
They will be able to repice their premiums later this year around September/October. Margins should improve over the long turn, this could be one big panic. It remains to be seen. For now we are in a brutal downtrend, any brave dip buyers may be rewarded only in the long term, at buying at any level between here down to $200 DCA.
Not financial advice, do what's best for you.

Waiting for $243 United HealthUNH has obviously taken a beating. It's managed to get so close to support many a few times now, yet hasn't hit yet. So if $243 does hit, then plan on targeting $410.
Good luck!
UNH: Monthly outlook UNH is an interesting case study, fundamentals vs technicals vs math.
If you were sleeping, here are the cliff notes on UNH:
UNH is alleged to have commited the following violations/criminal offences
Medicare Overbilling: The U.S. Department of Justice has accused UNH of overcharging Medicare by more than $2.1 billion, allegedly by manipulating diagnosis codes to inflate payments.
Securities Fraud: A class action lawsuit claims UNH misled investors by denying coverage to boost profits, which allegedly contributed to a sharp drop in stock value.
Undisclosed Payments: Reports suggest UNH made secret payments to nursing homes to reduce hospital transfers, potentially compromising patient care.
How did it come to light, you ask?
From whistleblowers, investigative journalists and a DOJ probe (department of justice).
While the investigation is ongoing, if they are found guilty of any or all of these allegations, the penalties could be:
Billions in fines
Civil damages
Criminal charges
Sanctions that can fundamentally interfere with how they do/conduct business
With that out of the way, ask yourself: Am I buying this while there is an ongoing criminal investigation that could very well result in the insolvency of an organization?
I know a lot of people think the charts tell the news, but something this serious unfortunately can't be foretold by a chart, in my opinion.
But let's humour the fallacy that these traders have, and entertain whether or not UNH could theoretically be a buy.
Technicals:
Oversold, obviously.
No clear bottom pattern.
No clear chart pattern at all.
Massive investor exodus, with the current selling volume being almost as much as the flash crash we had the beginning of this year and the third highest in UNH's long, long life on the NYSE.
Math:
While UNH is below is quadratic mean, it has not triggered a bullish mean reversion signal yet.
Forecast into next week is bullish with some upside bouncing expected.
Mid term forecast (over the next month) has it coming down to 220.
The math levels are posted in the chart and 220 is actually the second low target on the month, so that's interesting.
This will go lower obviously if guilt is found or damming evidence comes forth in the media over the next days. I say this because UNH popped up on my sweep alerts. Four (4) very large option orders have popped up on my order flow screener for UNH, totaling over 7 million in short premiums (puts).
First is the 480 put strike expiry 08-15 of this year with 4.2 million in premiums bought.
Second is the 530 put strike, expiry 09-19 of this year with 634 k in premiums bought.
Third is the 540 put strike, expiry 09-19 with 815 k of premiums bought.
Last is the 600 put strike, expiry 01-16-2026 with 554 k of premiums bought.
This obviously has me interested that someone knows something about stuff.
But this is not advice, just reporting what I see.
Safe trades everyone!

My UNH Thesis: Betting on a Healthcare Giant's Come BackThe healthcare sector has been in decline, which creates interesting opportunities. I recently talked about a few pharma plays - Eli Lilly, Novo Nordisk, and Pfizer.
Here's why I'm investing in NYSE:UNH :
UnitedHealth Group (UNH) has tanked ~50% in the past year, but the July 29 (VERY SOON) earnings could flip the script. As a historically dominant player, UNH is now undervalued amid sector weakness, offering massive upside if regulatory fears ease.
Here's my full bull case. 👇 FUNDAMENTAL ANALYSIS
Why the Sell-Off? A Perfect Storm of Bad News
UNH crushed the market for 15 straight years (2009-2023) with positive returns, predictable EPS growth, and 134% gains over the last decade.
But 2024 brought chaos:
Feb: Massive cyber attack caused a one-time EPS hit (non-recurring).
Ongoing: DOJ antitrust probe, criminal fraud investigation, rising Medicare costs, and Optum losses.
April: Disastrous Q1 earnings miss + lowered guidance.
Leadership drama: CEO death.
This erased gains (down 7% over 5 years), amplified by healthcare sector outflows—the biggest since 2020. But is this overblown? Signs point to yes. The markets almost always overreact to bad news.
Bullish Signals: Insiders Betting Big
The tide is turning:
Insider Buying Boom: $32M+ in 2024 (vs. $6.6M in 2019), including new CEO/CFO—highest in 15 years.
Congress Buying: Q2 2024 saw net purchases for the first time in 5 years (vs. historical selling).
DOJ Shift: Probe refocusing on pharmacy benefits (PBM) unit, dropping acquisition/monopoly scrutiny—implies no major findings. Great news!
Sector Tailwinds: Healthcare is one of 3 S&P sectors below historical valuations. Super investors (usually tech-obsessed) are piling in, despite the sector's -10% YTD vs. S&P's +13%.
Plus, UNH's dividend yield is at a record ~3% (vs. 1.5% avg), with 16%+ historical growth and 100%+ free cash flow conversion. Rare combo of yield + growth!
Valuation: Screaming Buy?
UNH trades at PE ~11.9 (vs. 10-year avg 23)—a steal.
Analysts project 16.7% EPS CAGR through 2029.
Conservative Scenario: 16.5% EPS growth + PE to 16.5 = $780/share by 2030 (173% total return, 18% CAGR ex-dividends).
Optimistic: PE back to 23 = $1,084/share (280% return).
Models confirm:
DCF (8% FCF growth): ~$484/share (70% upside).
DDM (7% div growth): ~$607/share (112% upside).
Blended Fair Value: ~$545/share (75-90% upside from ~$300). Buy below $436 for 20% safety margin.
Still, there is fear of DOJ uncertainty—investors hate unpredictability and that's why the stock is so low.
Key Catalyst: July 29 Earnings
This could be UNH's "most important report ever." Watch for:
Regulatory/legal updates (DOJ progress).
Full-year guidance revisions.
Metrics like medical loss ratio and PBM performance.
Positive news = potential rocket 🚀. Expectations are low (20 bearish EPS revisions vs. 0 bullish), so a beat could spark volatility... upward.
Risks: Not Without Bumps
Regulatory escalation (e.g., PBM issues) could tank it further.
Short-term headwinds: Medicare costs, sector selling.
Mitigants: DOJ de-risking, strong FCF buffer, insider confidence. Enter cautiously—size positions small.
TECHNICAL ANALYSIS
I also did a little technical analysis:
UNH price is at a resistance level
My EVaR indicator tells me we are in a low-risk area
RSI says the stock is oversold
I added the different price targets for better visualization
THE PLAN
My plan:
Later today, I will allocate 1% to 1.5% of my portfolio to the stock. If it drops, I will continue to DCA. The stock is already really beaten down, and I think a company this large cannot drop much more.
Quick note: I'm just sharing my journey - not financial advice! 😊

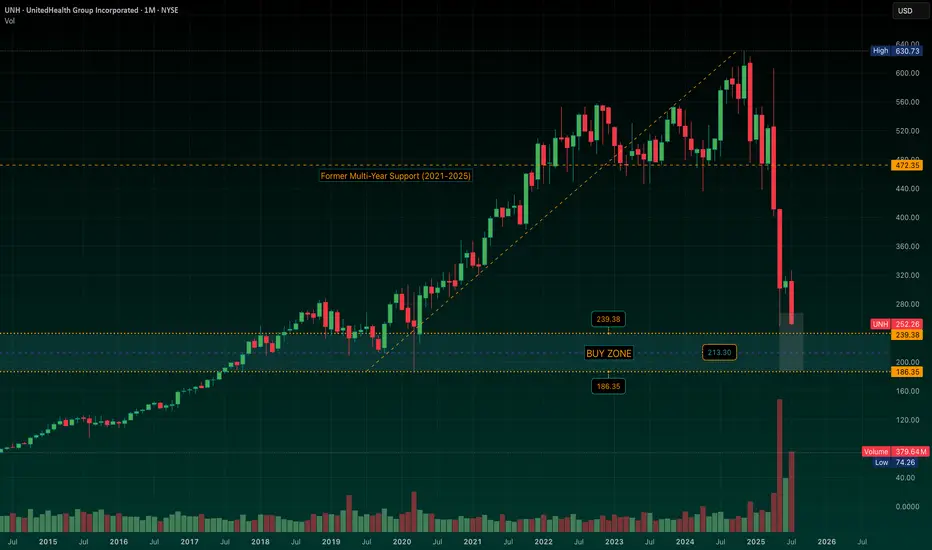
UNH: Mapping Out a Defined-Risk LEAPS Strategy in the "Buy Zone"UNH is approaching a broad structural support region I’ve been tracking -- a wide zone from $239 down to $186, where (for me) the stock begins to offer compelling risk/reward and long-term value. Momentum, IMO, is still decisively lower, but we’re nearing levels where I start preparing.
The midpoint of the “Buy Zone” near $213 reflects a potential average cost area I’d be very comfortable building from, depending on how price behaves as it enters the zone.
I’ll look to initiate exposure through long-dated call options (LEAPS) -- as I’ve started doing in NYSE:CNC -- once the setup begins to stabilize. From there, I’ll begin layering in short puts at ownership levels that align with the broader structure. If assigned, I’ll own where I intended. If not, I’m collecting premium to help finance the LEAPS.
I’m not in the business of calling exact bottoms… this is about building a position that respects time, structure, and flexibility -- anticipating a slow grind higher over the next 12–18 months. Stay tuned.
$UNH BEARISH SETUP – WEEK OF AUG 1
🔻 **\ NYSE:UNH BEARISH SETUP – WEEK OF AUG 1** 🔻
**UnitedHealth Group (UNH)** is showing classic breakdown signs. Here’s what the data says:
📉 **RSI Breakdown**
• Daily RSI: **20.6**
• Weekly RSI: **19.3**
→ Deeply oversold + no bounce = 🚨 momentum flush risk
📊 **Volume Surge**
• Weekly Volume: **145M** (1.9x avg)
→ Heavy **institutional selling**, NOT dip buying
🧠 **Options Insight**
• Call/Put Ratio: **1.17** = Slight bullish noise
• But... Expiry Gamma is 🚨HIGH = IV Crush incoming
• VIX: **20.7** = Volatility tailwinds intact
💣 **TRADE IDEA (PUT PLAY)**
• Direction: **BUY PUTS**
• Strike: **\$230**
• Expiry: **08/08/2025**
• Entry: **Monday Open**
• Target Premium: **\$0.10**
• 🎯 PT: \$0.30 | 🛑 SL: \$0.03
• Confidence: **70%**
📌 **Narrative**:
Oversold + High Volume Dump + No support bounce = Perfect storm for continuation dump. This is a high gamma play, time-sensitive, low-cost lotto setup. Risk small. Aim big.
---
💥 **Watchlist Tag**: ` NYSE:UNH AMEX:SPY AMEX:XLV `
🧠 **Strategy Tag**: #OversoldFlush #PutPlay #0DTETrap
🚀 Follow for more weekly earnings & options breakdowns!

UnitedHealth (UNH) Shares Plunge Following Earnings ReportUnitedHealth (UNH) Shares Plunge Following Earnings Report
Yesterday, prior to the opening of the main trading session, UnitedHealth released its quarterly results along with forward guidance. As a result, UNH shares dropped by over 7%, signalling deep disappointment among market participants. According to media reports:
→ Earnings per share came in at $4.08, missing analysts’ expectations of $4.48.
→ Revenue guidance was set at $445.5–448 billion, falling short of the anticipated $449.07 billion.
→ Concerns were further fuelled by rising costs and declining profitability, which the company attributed to the continued impact of Medicare funding cuts.
Consequently, the UNH share price dropped to its lowest level of 2025, last seen on 15 May.
Technical Analysis of UNH Stock Chart
In our end-of-May analysis, we updated the descending channel on the UNH stock chart and highlighted that following the recovery from the May low (marked by arrow 1), sellers could regain control. Since then:
→ Throughout June, the share price exhibited signs of supply-demand equilibrium around the psychological $300 level.
→ However, after an unsuccessful rally that formed peak A (which now resembles a bull trap), the balance shifted in favour of the bears. The price began to slide lower along the median line of the descending channel (illustrated by arrow 2).
This pattern was a red flag, particularly against the backdrop of a broadly rising equity market since the beginning of summer. Even if the bulls had hope, yesterday's candle could have completely extinguished it:
→ The session opened with a wide bearish gap.
→ During the day, bulls attempted a recovery, but failed — the candlestick closed at the daily low, leaving a long upper wick, a classic sign of selling pressure.
In this context, we could assume that:
→ Bears may seek to extend their advantage and test the year’s low;
→ The bearish gap area (highlighted in purple), reinforced by the descending channel’s median line, could act as resistance during any potential recovery.
At the same time, the $250 psychological level appears to be a strong support zone. This is backed by the 15 May bullish pin bar formed on record trading volumes — a potential sign of institutional interest in accumulating shares of this healthcare giant in anticipation of a long-term recovery.
This article represents the opinion of the Companies operating under the FXOpen brand only. It is not to be construed as an offer, solicitation, or recommendation with respect to products and services provided by the Companies operating under the FXOpen brand, nor is it to be considered financial advice.

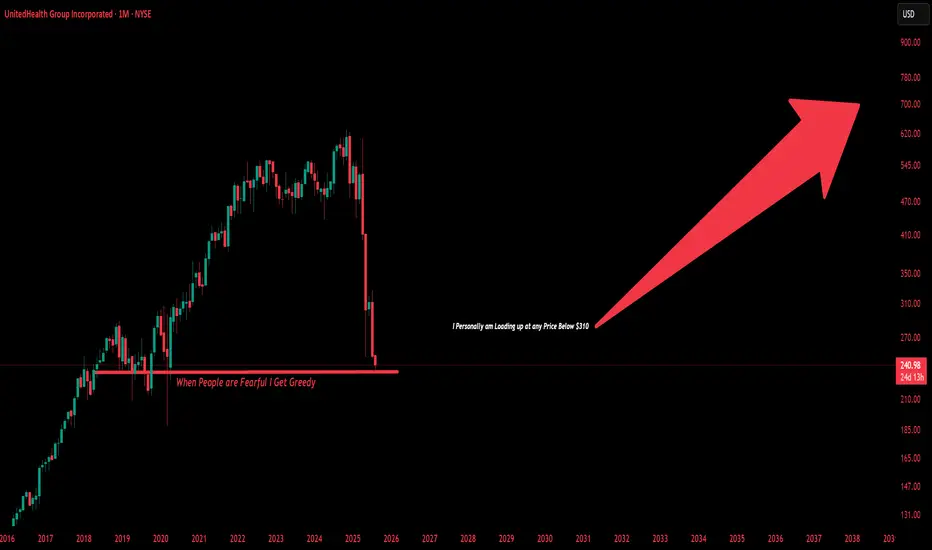
$UNH This Behemoth Is Not Going Anywhere and I am Loading Up United HealthGroup is extremely Appealing to me at these valuations. Health Insurance Is something all people need. I Don't See Medicaid/Medicare Cuts affecting NYSE:UNH To the extent People believe it will. Legislation can be temporary, This Company Produces 20B Plus in Free Cashflow Every single Year Let alone 420B in Revenue its a behemoth controlling more than 30% of American Health Insurance in terms of Market Share. The United States could never afford to socialize Healthcare the way Europe Or Canada does. Social Security/Health/Medicare already eat up 49% Of GDP. The United States is almost dependent on companies Like United Healthgroup to provide its services. This Could almost Give Companies like NYSE:UNH an opportunity to offer plans to gain more customers who before had Government assisted health insurance. While more downside is almost Guaranteed I see nothing more then even better discounts for the long-term. This is not a question of If UNH Can recover its only a question of how long will it take. We are back at Prices Pre Covid-19.
---------------------
Possible Reasons for the Major Drops:
The Big Beautiful Bill
DOJ Lawsuits
Rising Medicare Costs
Rising Expenses on Insurers
Swapped CEO Twice
Swapped CFO Once
Lawsuits
Scandals
---------------------
NYSE:UNH Fundamentals:
Price To Sales: 0.5x
Price To Earnings:10.3x
Price to Book: 2.2x
---------------------
Balance Sheet:
Cash: US$32.02b
Debt: US$104.78b
Total Liabilities: US$203.79b
Total Assets: US$308.57b
---------------------
Management Efficiency:
ROE: 21.1%
ROCE: 15.5%
ROA: 8.2%
---------------------
Dividend Safety:
Dividend Yield: 3.7%
Payout Ratio: 37% of Profits
---------------------
I recently Began Acquiring Shares around the $260 Mark and plan on continuing to load up for the long-term.
---------------------
This is not financial Advice, Just what I am doing on my own as an investor. I do not give Buy/Sell/Hold Signals.
Big Money Is Betting on UNH — Are You In Yet?## 🚀 UNH Weekly Trade Idea: Bullish Momentum Brewing at \$260! 📈💥
UnitedHealth Group (\ NYSE:UNH ) is flashing bullish signals across the board:
📊 **Call/Put Ratio: 3.12** → Heavy institutional bullish flow
📈 **Daily & Weekly RSI: Rising**
💰 **Volume Increasing** → Accumulation Mode?
⚠️ **Gamma Risk HIGH** → Perfect storm for explosive moves!
---
### 🔥 Trade Setup:
🟢 **Buy 260 Call** (Exp: 08/08)
💵 Entry: \$0.69
🎯 Profit Target: \$1.03 – \$1.38
🛑 Stop Loss: \$0.34
📈 Confidence: 65%
All models aligned on this: **Bullish Bounce Likely**
Range of strikes (\$255–\$260) show heavy interest = 🚨 breakout setup
💡 **Risk Management:** High gamma = fast moves. Lock profits or cut quick. Stay nimble!
---
### 📌 Suggested Hashtags/Tags:
```
#UNH #OptionsTrading #CallOptions #BullishSetup #RSI #GammaRisk #WeeklyTrade #StockSignals #MomentumPlay #HealthcareStocks

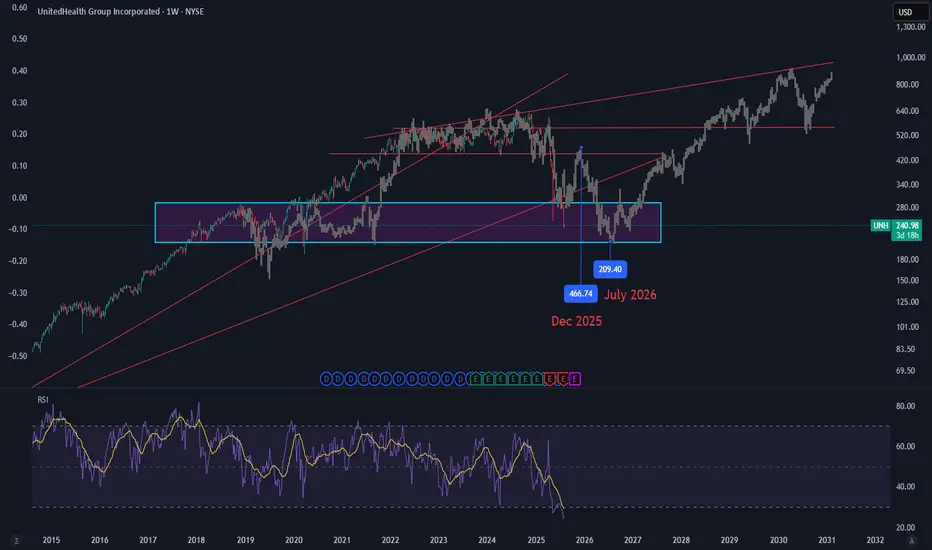
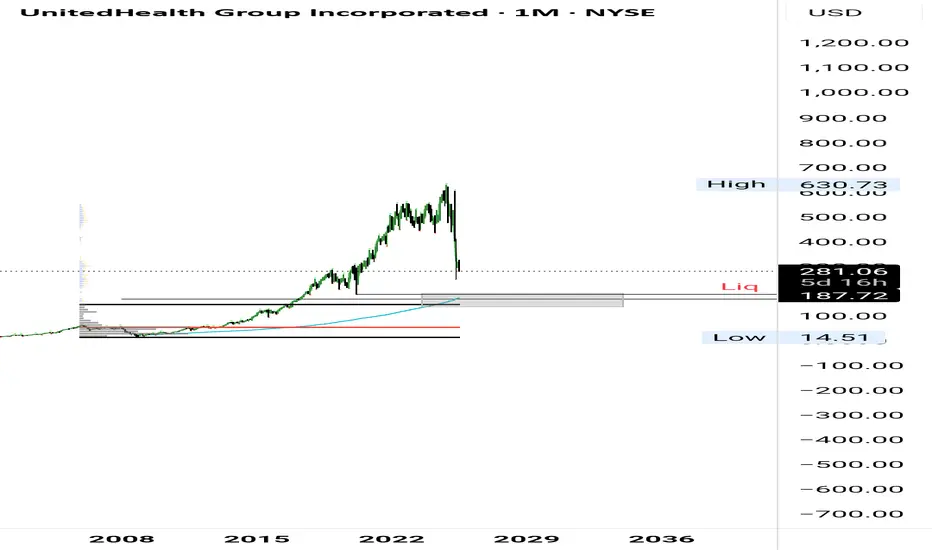
UNH: Possible pattern lasting years.Hello,
As soon as I saw this pattern on UNH, i remembered few years ago i have seen same pattern.
Mostly it matches the current pattern.
This is just a guess work.
Happy investing NYSE:UNH
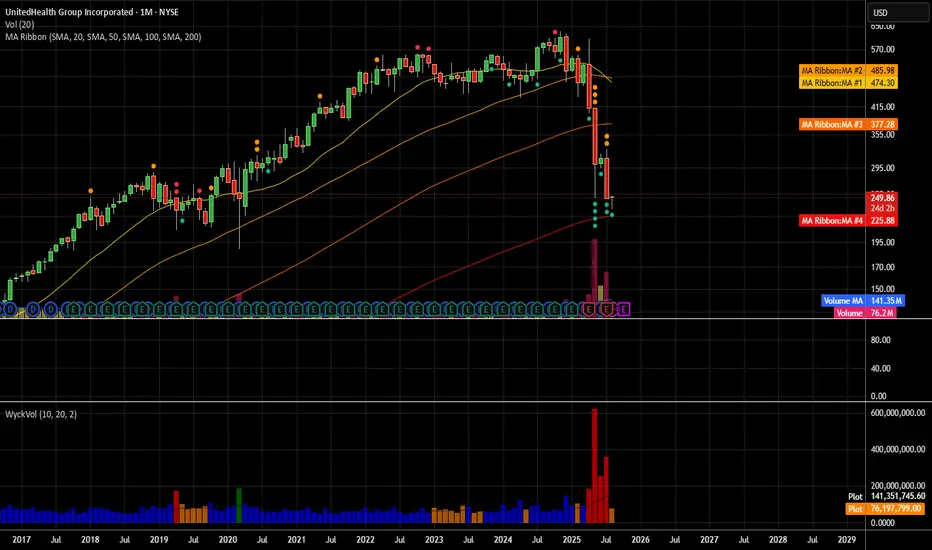
UNH Overview 1M candlesThe price is currently around $250.51, rebounding after a steep drop.
There’s strong volume spike on the recent candles, suggesting capitulation selling and potential reversal.
The price is sitting near the SMA 200 on the monthly chart which historically acts as major long-term support.
Overhead resistance MAs: SMA/EMA 20/50 around $267–$280.
📈 Bullish Target Zones
First target (T1): $267 – near the 20/50 EMA/SMA cluster, where initial resistance is likely.
Second target (T2): $280–$285 – prior consolidation zone before breakdown.
Stretch target (T3): $300 – 310 retest of breakdown highs.
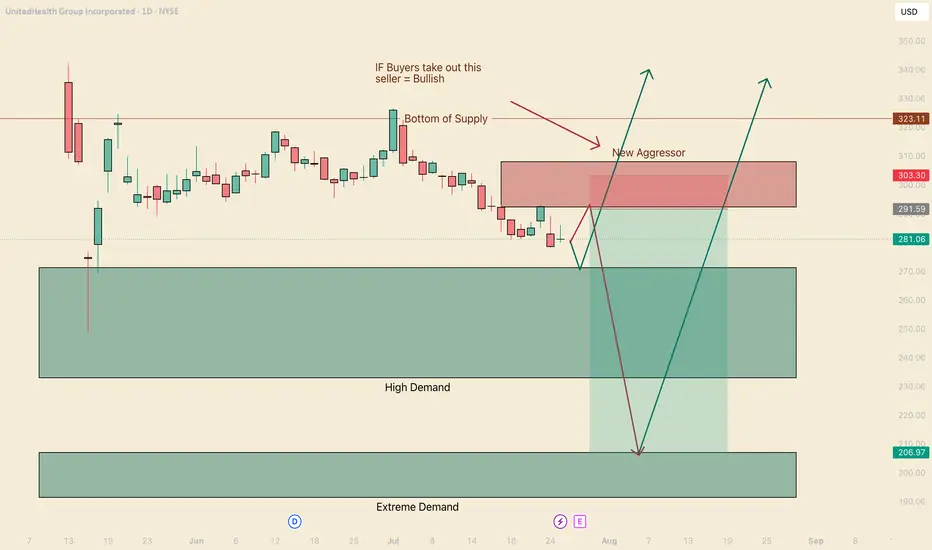
Bears are still in controlHello I am the Cafe Trader.
Today we are going to be taking a look at UNH. No doubt this has to have come across your feed or in the news recently. Why is every so Bullish? People are so bullish, that it spooks me... Everyone is pumping this emphatically, I feel like they are getting paid to pump it. This is a bold statement, but It's a gut feeling.
Tin Foil
If people get paid to pump, The huge seller isn't done selling, and needs you to keep buying to sell into you. Yes this should make you hesitant and weary. Does this mean you shouldn't buy? Not necessarily. Here are two scenarios to help you squeeze some juice out of this rock.
Bears are still in Control
A fresh new aggressive seller stepped in at $292.44. This is going to put some pressure on the high demand zone. May 25th, we sunk deep into the zone before recovering. This was an extremely hot reaction with passive buyers sitting at 271.30
11th of June aggressive buyers stepped in, but got crushed.
27th of June aggressive buyers stepped in, but as soon as they hit the real liquidity from the big seller (Tues jul 1st), you saw a huge follow through and more aggressive selling. This tells us that bears are still in control and I foresee two scenarios.
Green Scenario
Test off the liquidity at $271. Get a hot reaction from the buyers, putting tons of pressure on the new seller, ripping their faces and blasting off into never land.
Long
Entry 271
Stop 260
Partial TP 323
Final TP 425
Red Scenario
We test the New aggresor before the high demand Liquidity, get sold into heavily, and put so much pressure on buyers it blows pass the high demand and gets to the most probable bounce location at top of Extreme Demand $207.
Short
Entry 292
Stop 302.50
Partial TP 271
Final TP 207
Bonus Scenario
That 207 Area should attract massive buyers, even with the seller as heavy as he is. I think if there is going to be any big bounce strait off the cuff, this will be the spot.
Entry 207
Stop 185
TP 425 (play the long long game here)
Long Term
If you did your DD and you want a good price. The following will be measured by your personal sentiment.
Aggressive = 271
Fair price = 240
"Steal" = 191 - 207
That's all for UNH, Remember to follow/Boost.
Stay tuned for more market analysis. Happy Trading!
@thecafetrader
Buy when everyone is fearful UNH took a beating, earnings might surprise tomorrow. speculative pending positive earnings report. Target and stop loss on the chart.
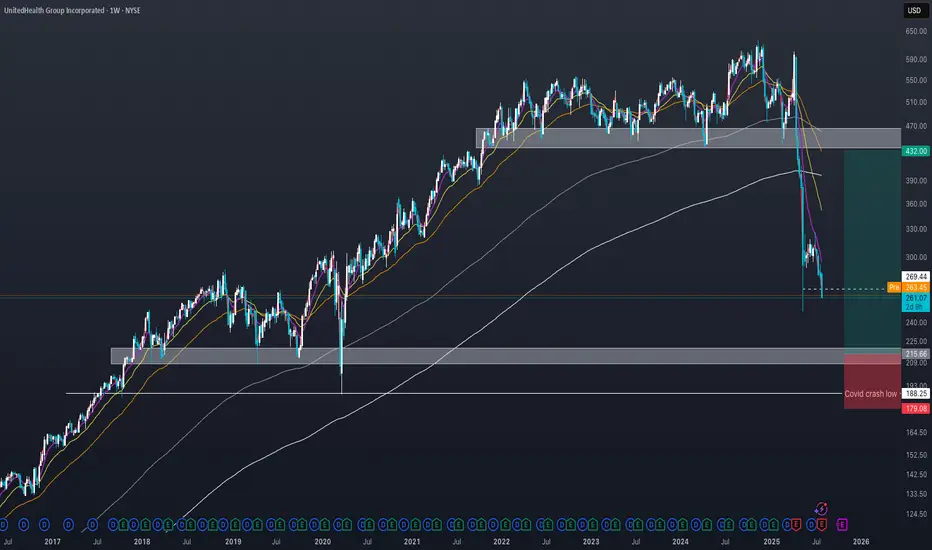
UNH in trouble? Key support at $250 before deeper dropDear traders and followers,
the UnitedHealth group chart has been in a clear downtrend since mid-April, with a potential bottom forming around $250. If this level breaks, the next strong support lies in the $200–220 zone. This is my preferred entry zone
A stop-loss below the COVID crash low is advisable to manage risk. The stop-loss should be mental and only triggered if a weekly candle closes below the low.
Fundamentally the stock faces uncertainty due to ongoing lawsuits and potential policy changes under a Trump administration.
While UNH remains a strong long-term investment, the road back to the $400 level will likely be slow and challenging, requiring patience and resilience from investors.
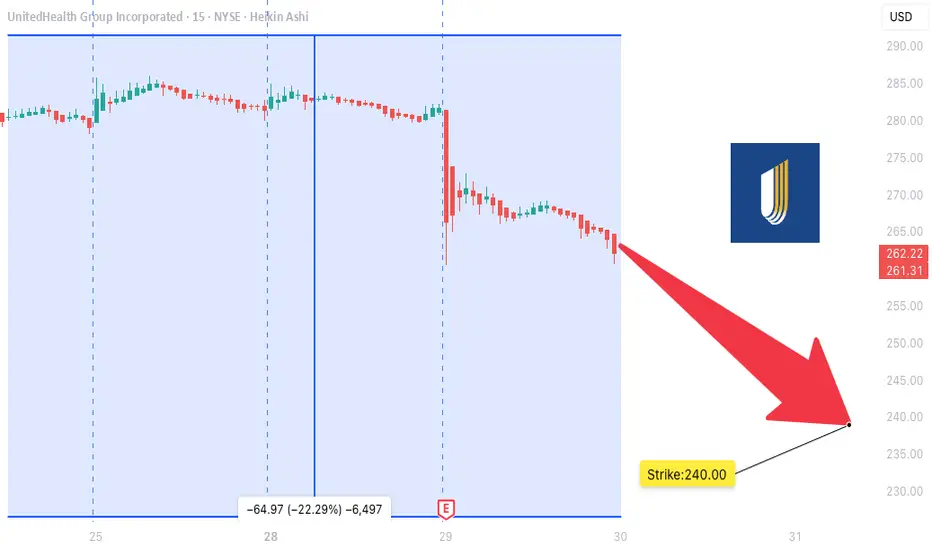
NH SWING TRADE IDEA (2025-07-29)
### 🩻 UNH SWING TRADE IDEA (2025-07-29)
**UnitedHealth Group – Bearish Setup**
📉 **Sentiment:** Moderately Bearish
📊 **Daily RSI:** 28.9 (Oversold!)
📉 **Momentum:** 5D/10D bearish
🔇 **Volume:** Weak (1.0x avg = low conviction)
💬 **Options Flow:** Neutral (C/P = 1.00)
🌬️ **VIX:** 15.71 — calm, tradable
---
### 🔻 Trade Setup
* **Play Type:** Naked PUT
* **Strike:** \$240.00
* **Expiry:** 2025-08-15
* **Entry:** \$0.85
* **Target:** \$1.35
* **Stop:** \$0.60
* **Risk Size:** 1 contract
* **Entry Timing:** Market Open
* **Confidence:** 75% 📉
---
### 🤖 Model Consensus (5 Models)
✅ All agree: **Bearish RSI + Downward Momentum**
⚠️ Disagree on *strength* of the trend: moderate vs strong
💡 Models: Claude, Grok, Gemini, LLaMA, DeepSeek
---
### ⚠️ Key Risks
* Neutral options flow = no crowd confirmation
* Weak volume = price may stall or fake out
* Watch for VIX spikes — could flip sentiment fast
---
### 🔎 Summary for Swing Traders
**UNH \$240P → \$0.85 → \$1.35**
🧠 RSI confirms downside
⛔ Low volume = trade light, manage risk
📅 Target expiry: Aug 15
🧲 Key level: \$247.13 — if broken, ride lower
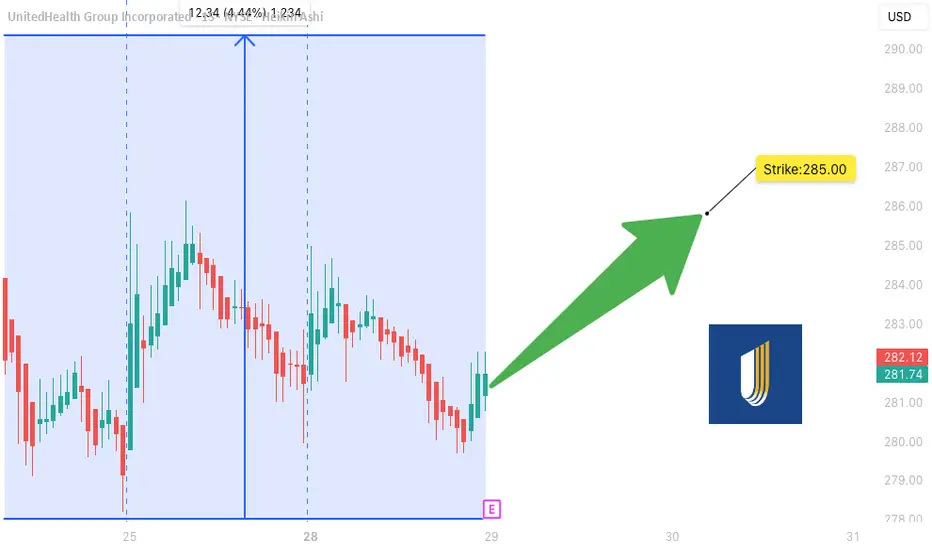
UNH Earnings Lotto Setup** (2025-07-28)
📊 **UNH Earnings Lotto Setup** (2025-07-28)
🎯 **Targeting a 2x return on post-earnings upside move**
---
### 💡 Trade Thesis:
**UnitedHealth (UNH)** is primed for a potential bounce on earnings:
* ✅ **Revenue Growth**: +9.8% YoY
* 🔥 **EPS Beat Rate**: 88% over last 8 quarters
* ⚠️ Margin compression risk from increased utilization
* 🧠 **Analyst Upgrades** trending positive
* 📉 RSI = **30.06** → Oversold territory
---
### 🔎 Options Flow & Technicals
* 🧲 Max Pain: **\$290**
* 🟢 Bullish call OI stacking at **\$285**
* ⚖️ IV Rank: **0.75** → Still has juice
* 🔻 Trading below 20D/50D MAs → Room for reversal
---
### 💰 Trade Setup
```json
{
"Instrument": "UNH",
"Direction": "Call (Long)",
"Strike": "$285",
"Entry Price": "$10.30",
"Profit Target": "$20.60 (2x)",
"Stop Loss": "$5.15 (50%)",
"Size": "1 contract",
"Expiry": "2025-08-01",
"Entry Timing": "Pre-Earnings Close (July 28)",
"Earnings Date": "2025-07-29 BMO",
"Expected Move": "±5%",
"Confidence": "70%"
}
```
---
### ⚖️ Risk/Reward
* Max Risk: 💸 \$1,030
* Max Gain: 🚀 \$1,030
* R/R Ratio: **1:2**
* Lotto-style with tight SL post-ER
---
### 🧭 Execution Plan
* 📅 Buy before close on **July 28**
* ⏰ Close same-day post ER **if target or SL hits**
* ❌ Exit manually if theta crush hits hard
---
### 🗣️ Final Note:
> “Oversold + Strong fundamentals + Positive consensus = Earnings bounce in the making.”
---
📌 Tag your UNH trades
💬 Drop your lotto setups
❤️ Like & repost if you're playing UNH this week!
\#UNH #EarningsPlay #OptionsTrading #TradingView #UNHEarnings #LottoTrade #CallOptions #HealthcareStocks #SwingTrade #RSI #IVRank #MaxPain
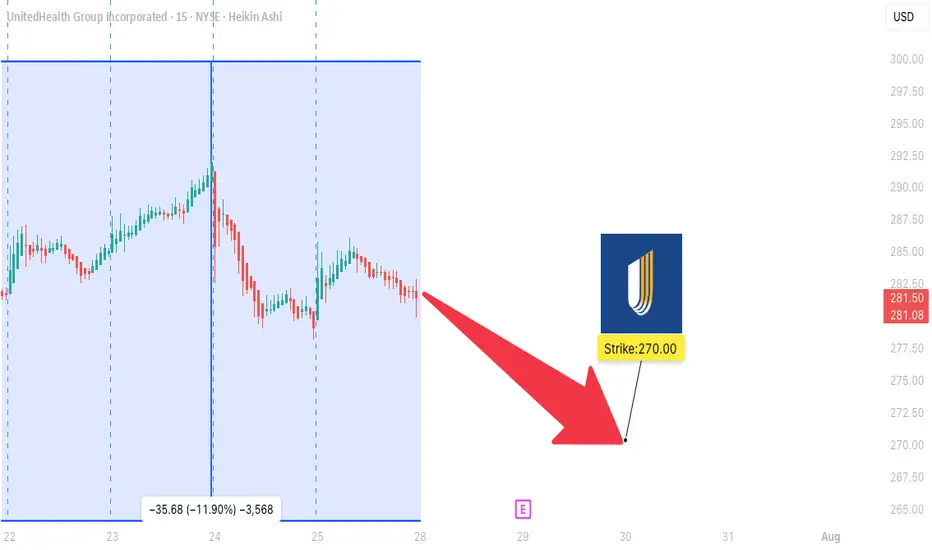
UNH WEEKLY TRADE IDEA (07/27/2025)
**🚨 UNH WEEKLY TRADE IDEA (07/27/2025) 🚨**
**Trend: Bearish Bias with Contrarian Options Flow**
🟥 **Technical Breakdown** + 🟩 **Bullish Flow Confusion** = Strategic Put Play
---
📊 **Key Technicals**
🧭 **Daily RSI:** 37.0 ⬇️
📉 **Weekly RSI:** 27.9 ⬇️ = *EXTREME BEARISH MOMENTUM*
📊 **Volume:** 1.2x prior week = *Institutional activity confirmed*
---
📈 **Options Flow Snapshot**
🟢 **Call/Put Ratio:** 1.64 → Normally bullish…
❗BUT in a falling market = **Contrarian noise** (per Gemini & Claude)
---
🔍 **Model Consensus Recap**
✅ All 5 models confirm BEARISH MOMENTUM
📉 Volume confirms downward pressure
❗ Disagreement only on *interpretation* of bullish call flow
📌 **Conclusion:** Put trade favored, but watch for surprise reversals
---
💥 **RECOMMENDED TRADE SETUP (Confidence: 65%)**
🎯 **Play:** Buy-to-Open PUT
* **Strike**: \$270
* **Expiry**: Aug 1, 2025
* **Entry Price**: \~6.10
* **Profit Target**: \$12.00 (🔁 2x Gain)
* **Stop Loss**: \$3.00 (🔻\~50%)
📆 **Entry Timing:** Market Open Monday
📦 **Size:** 1 Contract
---
⚠️ **Key Risks to Monitor:**
* 📈 If UNH moves above \$290 (Max Pain), bearish thesis invalidates
* ⚡ Gamma risk increases mid-week — *manage actively!*
* 📉 Unexpected volume dry-up could stall momentum
---
📌 **JSON FORMAT TRADE DETAILS (For Scripts/Alerts):**
```json
{
"instrument": "UNH",
"direction": "put",
"strike": 270.0,
"expiry": "2025-08-01",
"confidence": 0.65,
"profit_target": 12.00,
"stop_loss": 3.00,
"size": 1,
"entry_price": 6.10,
"entry_timing": "open",
"signal_publish_time": "2025-07-27 20:30:45 EDT"
}
```
---
💡 Summary:
Bearish momentum confirmed across models.
Flow confusion ≠ fade setup — it’s a **calculated put play**.
Trade smart, stay sharp.
🎯 Watch \$290.
💬 Tag fellow traders → \ NYSE:UNH bears unite!
\#UNH #OptionsTrading #BearishSetup #UnusualOptions #GammaRisk #MaxPain #TradingView #StockMarket
UNH Long Setup BuildingStill expecting more downside. Area of interest isn't far—anchored VWAP, VAH, 0.75 fib, and a possible liquidity sweep all line up there.
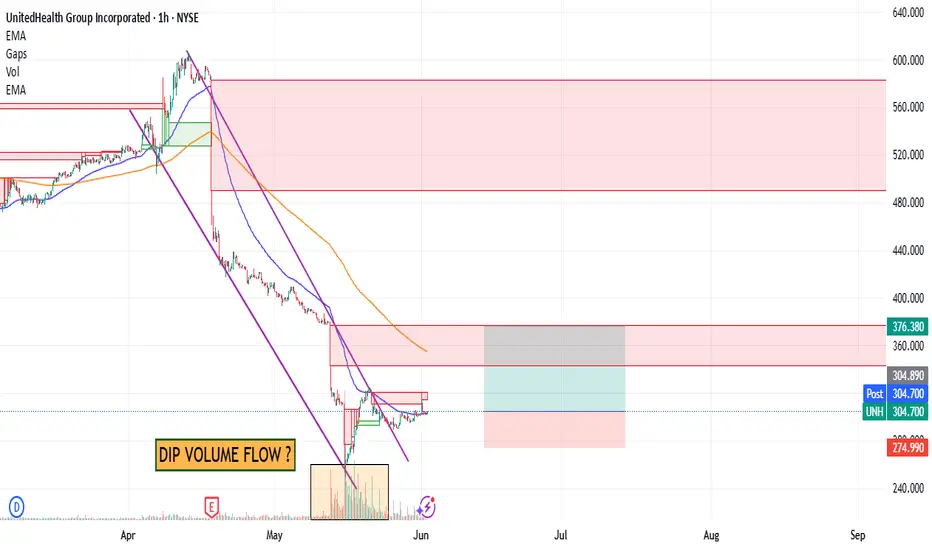
UNH : Are Bad Days Over ? (Cautious)UNH shares have moved above the 50-period moving average but are trading below the 200-period moving average.
For now, since the 200-period moving average is very high, a small trade can be tried by keeping the stop-loss level a little tight.
A few weak movements may pull the average down and the price may break the average.
Therefore, small position sizes are ideal.
NOTE : If we can maintain persistence on 376(Which will take a few days),
then we will look at the other gaps.
Risk/Reward Ratio : 2.39
Stop-Loss : 274.99
Take- Profit Level : 376.38
Regards.
UNH Weekly Options Play – Bearish Setup (7/21/2025)
📉 UNH Weekly Options Play – Bearish Setup (7/21/2025)
RSI Breakdown 📊 | Institutional Hedging? 🤔 | Bearish Trend Confirmed 🚨
⸻
🧠 Multi-Model Analysis Summary
🔻 RSI Trends: Falling daily + weekly RSI → strong bearish momentum
📉 Volume: Consistently negative across models → confirms selling pressure
🧠 Options Flow: High Call/Put ratio (3.01) — debated as bullish hedge vs short cover
📌 Outcome: Consensus bearish, with minor short-term upside risk due to calls
⸻
🎯 TRADE IDEA – UNH $280 PUT
💥 Direction: Bearish
🧾 Strike: $280 Put
📆 Expiry: July 25, 2025
💵 Entry: $2.35
🛑 Stop: $1.18 (≈50% loss cap)
🎯 Target: $4.70 (≈100% gain)
📈 Confidence: 70%
⏰ Entry Time: Market Open
⸻
📎 Why Take This Trade?
✅ RSI + volume = bearish momentum confirmed
✅ Volatility is favorable for option premium expansion
❗️ Watch for gamma near expiry & unexpected institutional sentiment shifts
⸻
📊 TRADE_DETAILS JSON
{
"instrument": "UNH",
"direction": "put",
"strike": 280.0,
"expiry": "2025-07-25",
"confidence": 0.70,
"profit_target": 4.70,
"stop_loss": 1.18,
"size": 1,
"entry_price": 2.35,
"entry_timing": "open",
"signal_publish_time": "2025-07-21 12:49:28 EDT"
}
⸻
🔥 #UNH #OptionsTrade #BearishSetup #WeeklyTrade #PutOptions #InstitutionalFlow #MarketMomentum #VolatilityPlay

Buying when others are fearful! - Technical breakdown looks ugly but biting the bullet with a strong conviction that bad news are priced in.
- Risk is to the upside. Even if it goes down, I'm mentally ready to buy more of NYSE:UNH and let it compound for years to come.
- I believe that we should close the gap above @ $376 so we have around 35-40% upside by the year end.
