BNBUSD – Break or Burn OutBNB ran explosively into the $666–$668 zone, but was quickly met with heavy distribution. A selloff followed, driving price back to $654 before forming a rounded base. Price has now recovered into the $662–$664 area but is consolidating in a tight range. Bulls must clear $665 to regain momentum. Oth
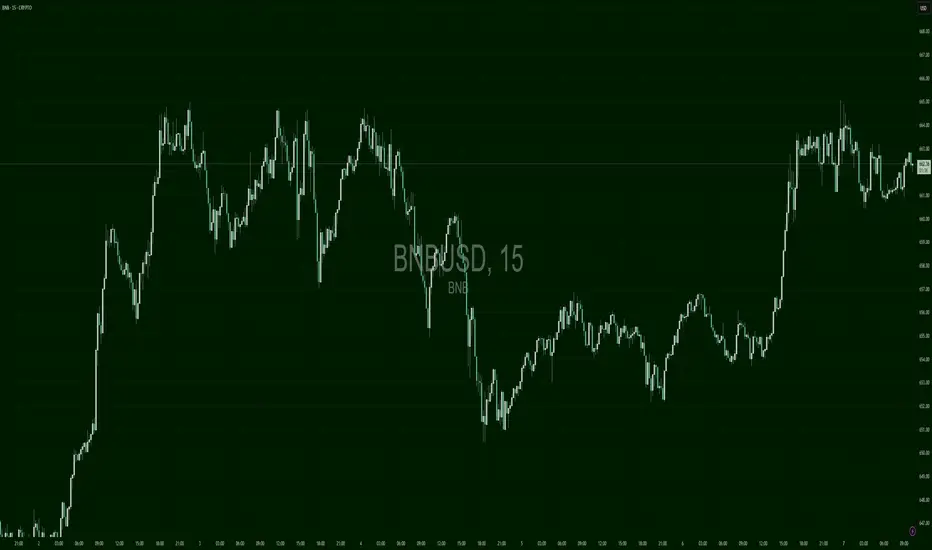
BNBUSD – Squeeze or StallBNB ripped into $668 and formed a tight double top before dropping into $653. It then coiled between $656–$664 for hours. The recent spike shows a breakout attempt, but needs to hold above $662 for bulls to confirm control. Otherwise, this is just another pop to sell.
BNB/USD Trend Summary
1. Recent Price Action & History
BNB is consolidating around $660–$690, recently hitting a 52‑week high near $793 in May, with a 24‑hour range between $668–$687
Nasdaq
+14
TradingView
+14
CoinDCX
+14
.
Over the past month, it’s gained ~2–3%, with an uptick of ~4% in late June
CoinLore
+3
Tradin
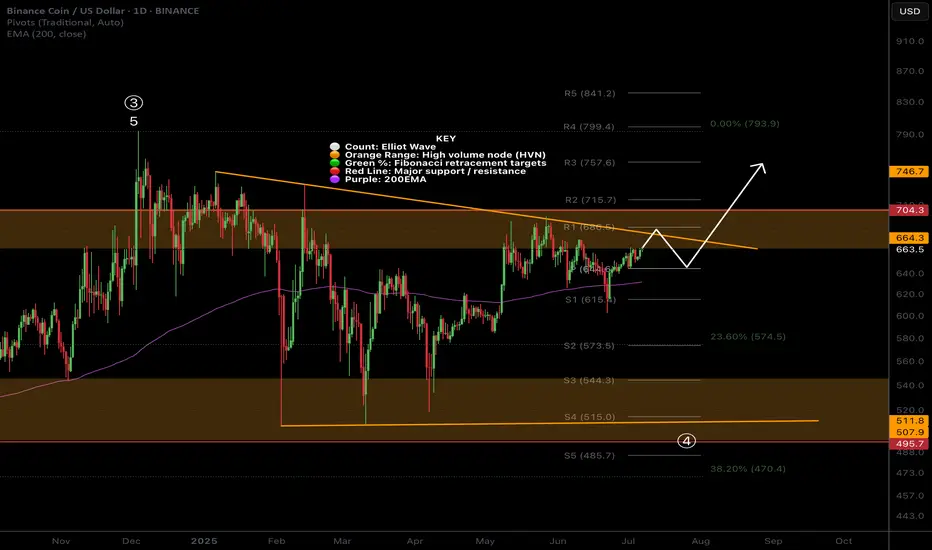
BNB Stuck in Barrier Triangle?CRYPTOCAP:BNB appears to be in a macro wave 4 barrier triangle, and for some time.
It has held up particularly well during the alt coin massacre, not even reaching the .382 Fibonacci retracement.
Price is testing the upper boundary for the 4th time, that starts to give us the higher probability b
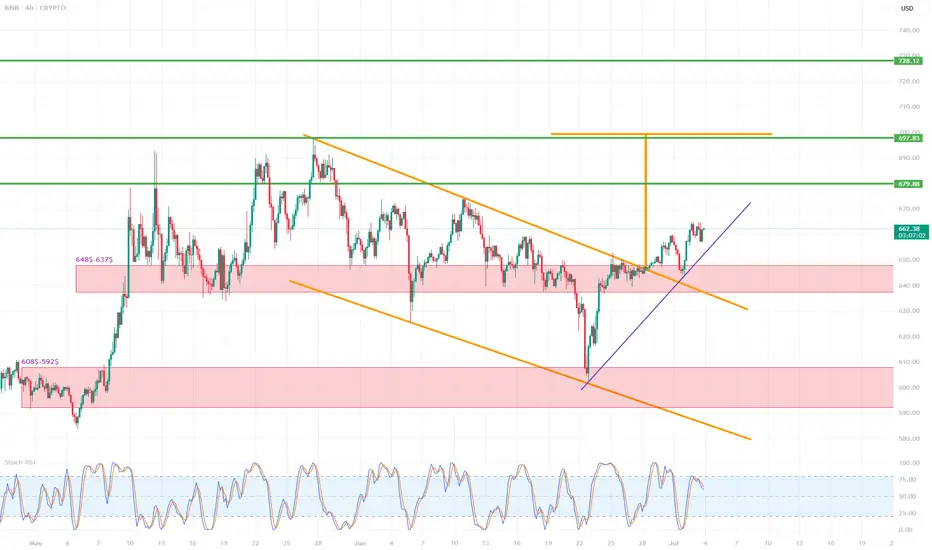
BNB/USD (4h interval)🔍 1. Chart structure
Instrument: Binance Coin / USD (BNB/USD)
Interval: 4 hours
📐 2. Technical formations
🔸 Breakout from the descending wedge formation
The descending wedge (orange lines) is a bullish formation - it suggests a potential breakout upwards.
The breakout occurred dynamically, with a
BNBUSD Bullish BNBUSD Analysis Update
Price has already mitigated the Fair Value Gap (FVG), and we are now anticipating a potential mitigation of the nearby Order Block (OB). On the Daily Chart, a bullish flag pattern is clearly in play, with the structure showing a confirmed third touch. We’re currently testing
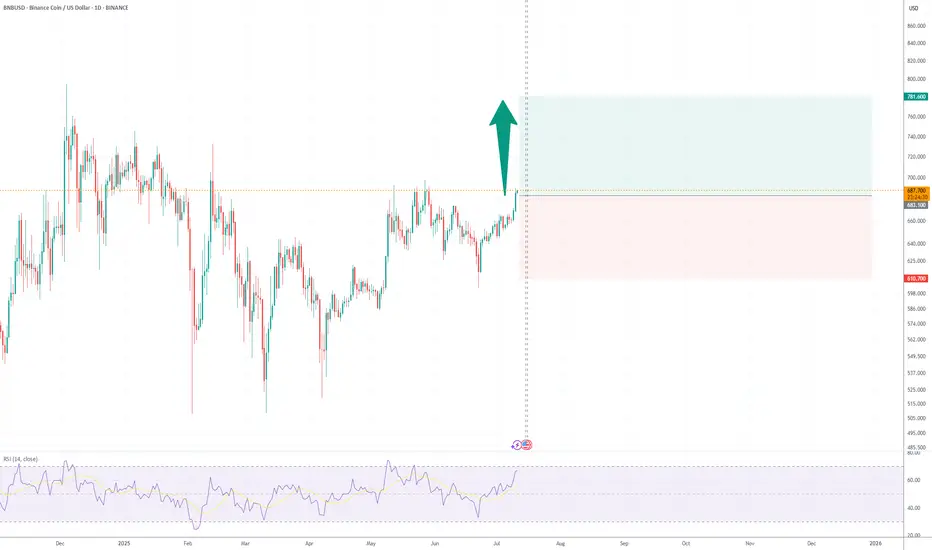
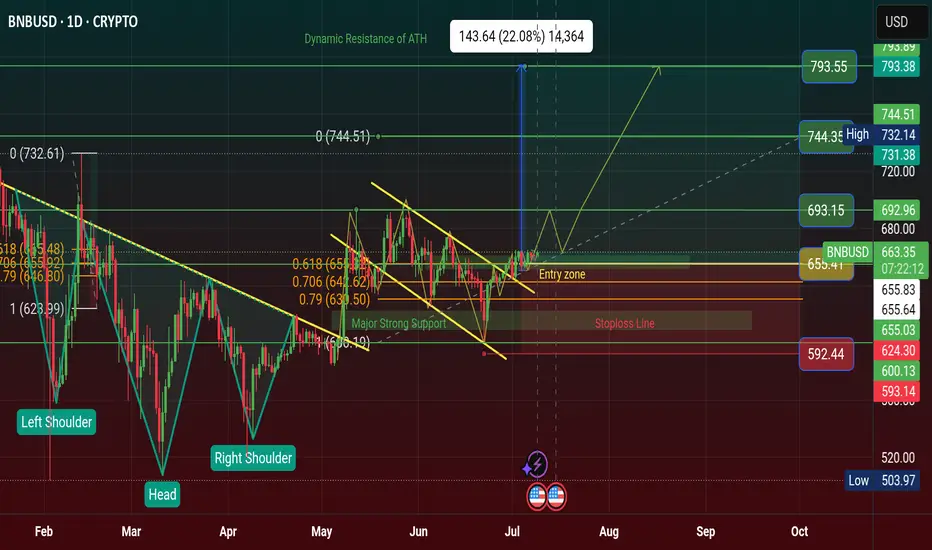
$BNB Chart Showing Bullish Flag Pattern and Price Will Hit +$750CRYPTOCAP:BNB Previously Chart showing Bullish Inverse Head and Shoulder Pattern and Gain Profit of Range. It's a Reversal Pattern .
Now Chart Showing a Bullish Flag Pattern and it's Continuation Pattern. Time to Bullish for BNB Coin for FOMC 10th July Thursday 2025.
The upsloping 20-day EMA and
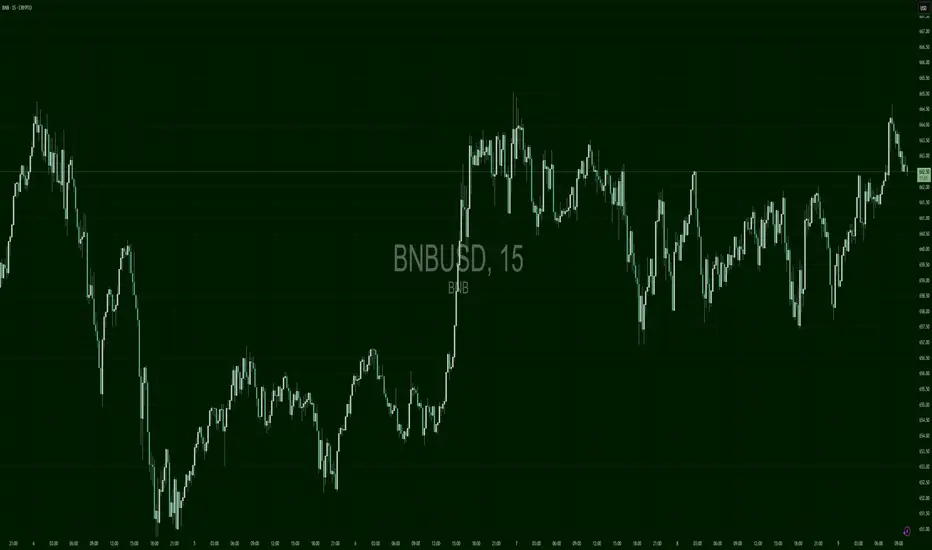
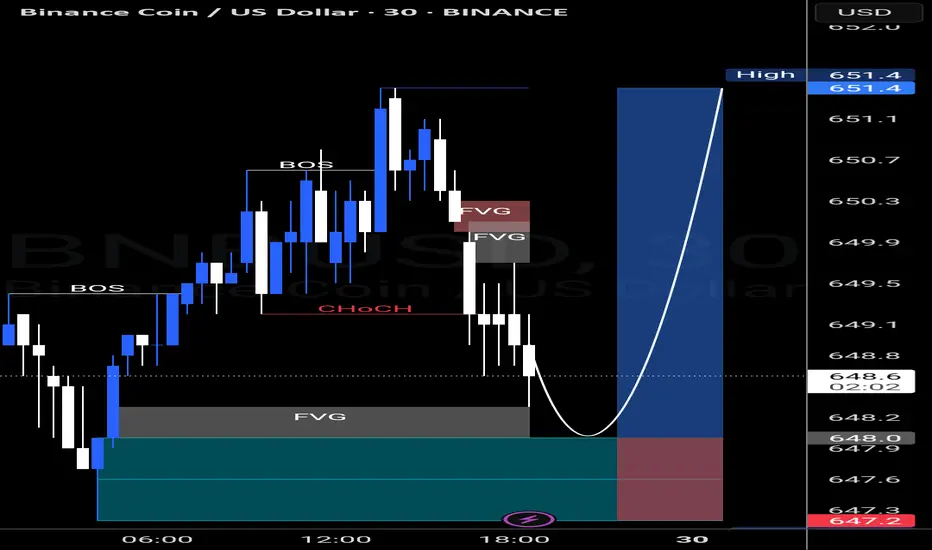
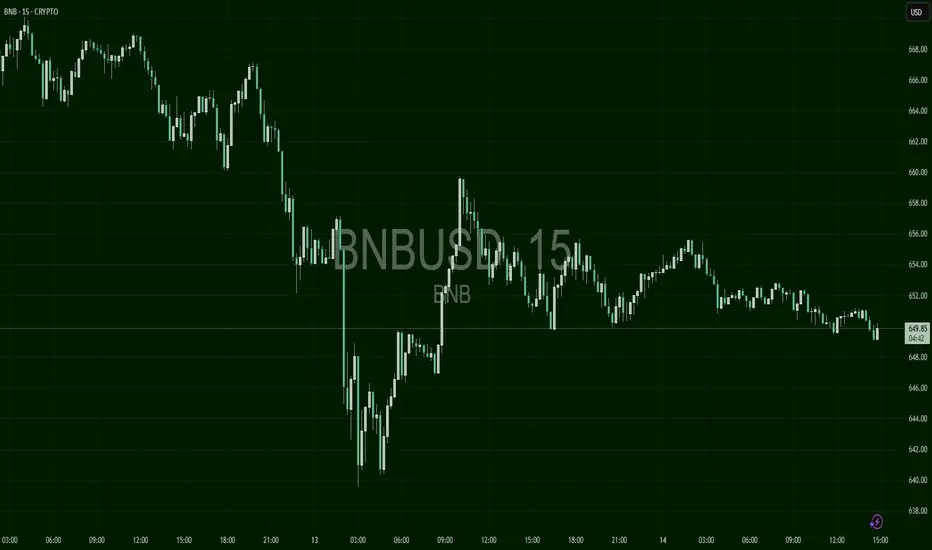
BNBUSD – Inverse Head & Shoulders PlayBNB formed a messy inverse head-and-shoulders structure with neckline at $649. After multiple rejections, it finally broke through and is holding above. Now consolidating just under $651, preparing for the next leg. Entry above $651 confirms continuation, while falling below $648 invalidates the bul
BNB Double Correction Hits Extreme ZoneBINANCE:BNBUSD has now entered the Blue Box buying area, signaling the final phase of the correction. A weekly reversal confirmation is the next key step — once that’s in place, the bounce phase is expected to begin.

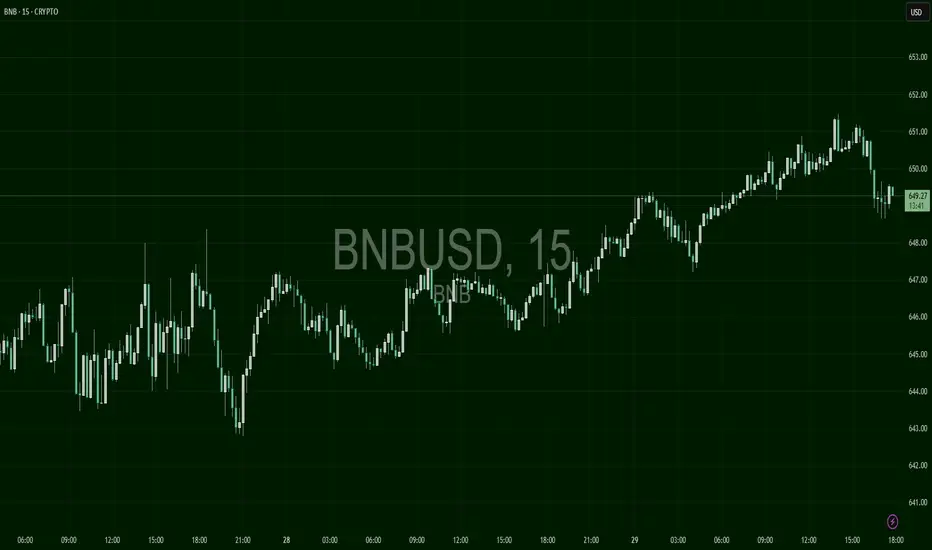
BNB Holds $649 Floor, but Momentum FadesBNB is attempting to hold above $649 after a volatile recovery. Despite a solid bounce from sub-$645, price has flattened, indicating consolidation or fading interest at current levels.
See all ideas
Summarizing what the indicators are suggesting.
Oscillators
Neutral
SellBuy
Strong sellStrong buy
Strong sellSellNeutralBuyStrong buy
Oscillators
Neutral
SellBuy
Strong sellStrong buy
Strong sellSellNeutralBuyStrong buy
Summary
Neutral
SellBuy
Strong sellStrong buy
Strong sellSellNeutralBuyStrong buy
Summary
Neutral
SellBuy
Strong sellStrong buy
Strong sellSellNeutralBuyStrong buy
Summary
Neutral
SellBuy
Strong sellStrong buy
Strong sellSellNeutralBuyStrong buy
Moving Averages
Neutral
SellBuy
Strong sellStrong buy
Strong sellSellNeutralBuyStrong buy
Moving Averages
Neutral
SellBuy
Strong sellStrong buy
Strong sellSellNeutralBuyStrong buy
Displays a symbol's price movements over previous years to identify recurring trends.
Curated watchlists where BNBUSD.P is featured.
Centralized exchange tokens: Stuck in the middle with you
7 No. of Symbols
Crypto tokens: Chips and dips
24 No. of Symbols
Staking Coins: Pick up a stake
18 No. of Symbols

Top altcoins: Choose your alternatives carefully
28 No. of Symbols
See all sparks