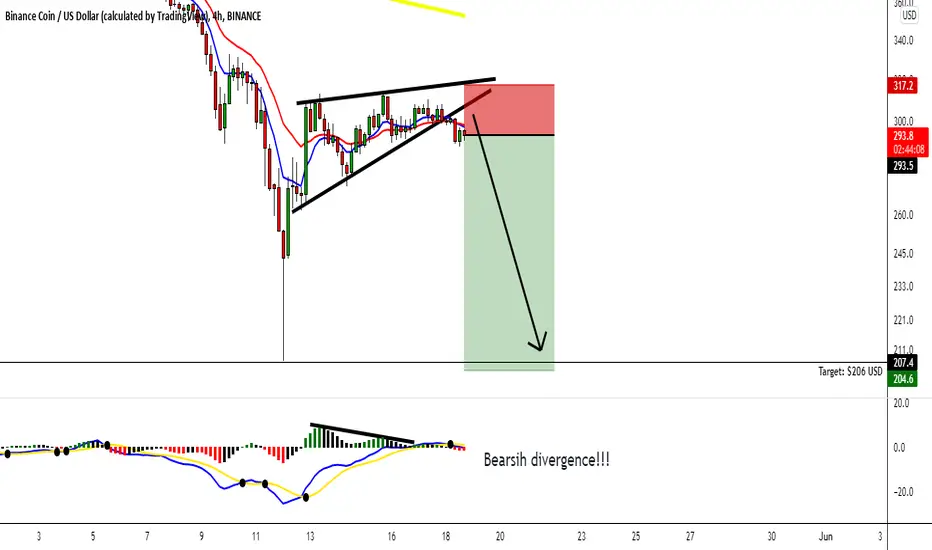
BNB/USD: short positionI see a short position in Binance coin right now in H4 timeframe.
Also, I will keep this trade until $206 USD, that will be my psychology target profit for this cryptocurrency. Also to share in my analysis, I see that MACD indicator make in the bar chart a higher low in the indicator indicating weakness in the market and also, continue the bearish trend.
Depending how the Daily candlestick closed up today, if closed up bearish signal, it's a good potential to short BNB in this timeframe and follow the trend toward $206 USD.
I will replace this rade for Oil price that drop and got some loss in my trade and swing trade, for that, I decide to closed up as I know that Oil will crash to $100 USD.
Good luck!!!
BNBUSD.P trade ideas
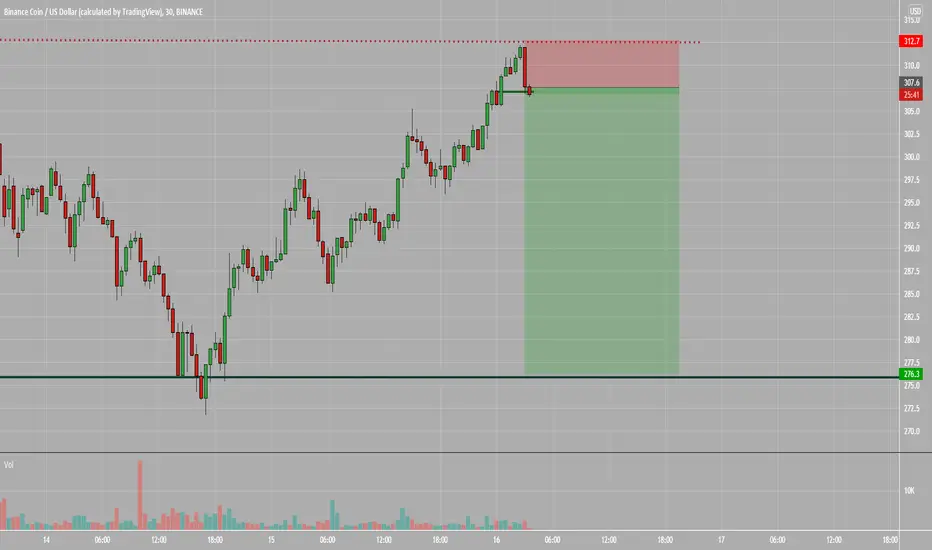
BNBUSD ❕ keep fallingBNB was unable to gain a fix above the 100MA on the 30m Timeframe.
The price is under the liquidity zone.
I expect that the price may retest the liquidity zone, but after fixing it will continue to fall.

$BNBBinance coin looking crisp, expect to see a nice steady rally from here. Do bears have FOMO yet?

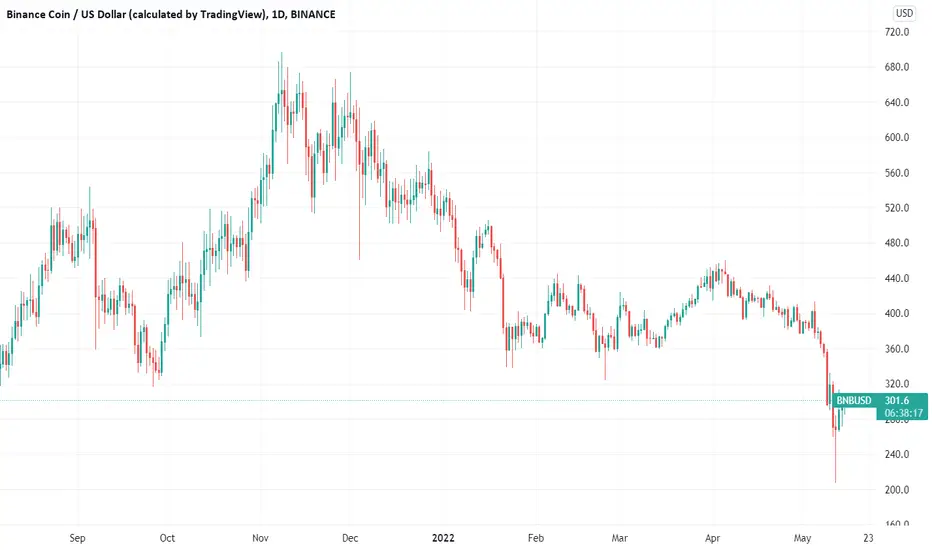
Binance Coin: on a road of challenging reversal? BNB was following general market sentiment during the previous week, so the price was pushed to the downside and to the current level of $290 where BNB is finishing the week. However, it was interesting to see that the lowest level during the week was at $209, within one single move. This indicates that there is part of the market which perceives much lower prices for this coin, at $200, a major support line. Still, the majority of the market is pricing BNB at current levels. Dip buyers occurred as of the weekend, but still, selling orders were dominating the last trading day of the week.
RSI reached the oversold market during the week, but finished the week around 33, which might be an indication that the market started a short term reversal. With latest moves MA50 started modest divergence from its MA200 counterpart, indicating that a golden cross is currently not in store for this coin.
During the last trading day of the week BNB was testing the support line at $250, but without strength to break it to the downside. Coin started its reversal, which adds to the probability that $300 resistance might be tested in the coming days. At this moment, there is no clear indication that the next resistance line at $350 might be tested in the following few days.
$btc to 32500 Based on volume and some Trend analysis i opened a long position for a quick sell at 32514 on btc, enjoy. use your stop loss:)
BNB TECHNICAL ANALYSISprice retracing to supply zone. Markets plummeted two days ago and go traders to panic but the markets have been seen to be recovering.
BNBUSD ❕ buying off the price in the channelBinance coin broke through all the major moving averages on the 4H Timeframe.
The price reached the upper boundary of the descending channel.
During the retest of the channel, one could see the growth of volumes, but the price failed to fix itself in the channel.
I expect that in case of fixing above the channel we may see a small bounce.

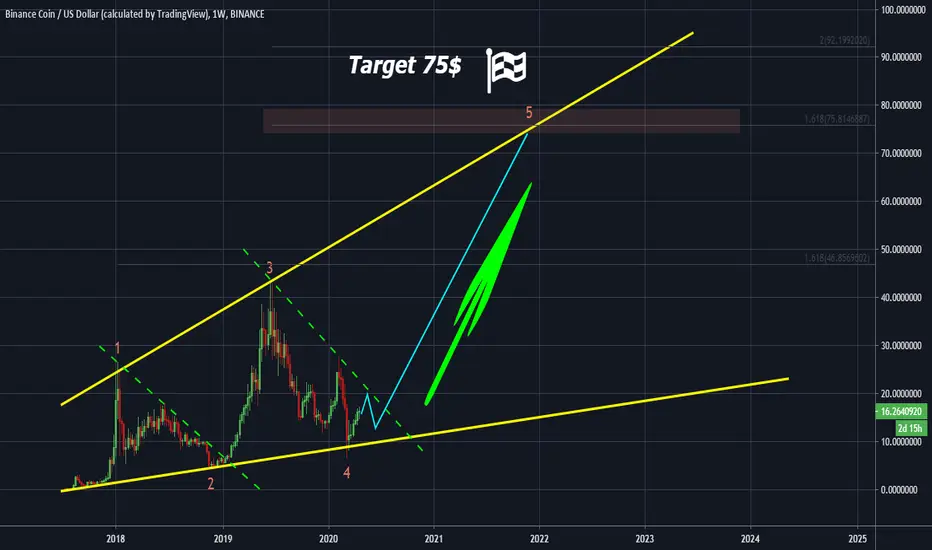
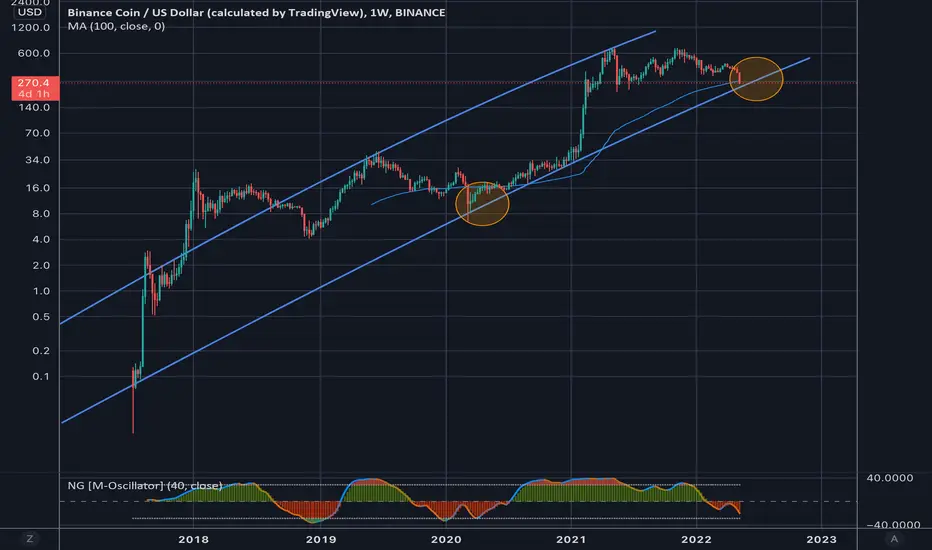
BNB looking for a bounceWeekly chart, Log scale
Let's see if it rebounds once it touches the trendline
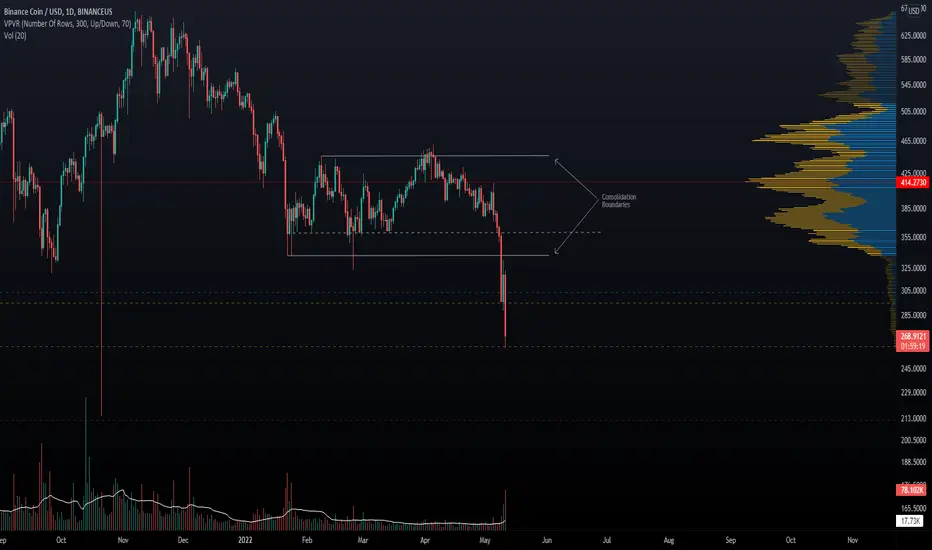
BNB lost $300 support!Today BNB lost the crucial support zone between $303 -295. If this level had been held BNB would have had many chances to return in the consolidation area within a few days.
$300 support breakout occurred in relatively high volume.
Two & a half hours before the daily candle close and BNB is already fighting the next essential support at $300.
Unfortunately for the bulls, the probabilities are with the bears. (If this candle close near $260).
Next support and the most essential of all is at $212.
If you are still holding BNB it’s unwise to sell the dip. Even if the dip is at $212.
If you are looking for a good entry for short position, it’s not the good time. Wait for the $260 breakdown and the retest as resistance before making your moves.
This break occurred due to LUNA/UST events. Nothing more. (In the short term of course)
Crypto maker is in extreme fear and that’s more bullish than bearish.
Remember investing is a probability game.
Not a financial advice. Always do your own research.
Elliott Wave Analysis: BNBUSD Has An Unfinished Wave CHello Crypto traders!
Today we will talk about Binance Coin - BNBUSD, its price action from technical point of view and wave structure from Elliott Wave perspective.
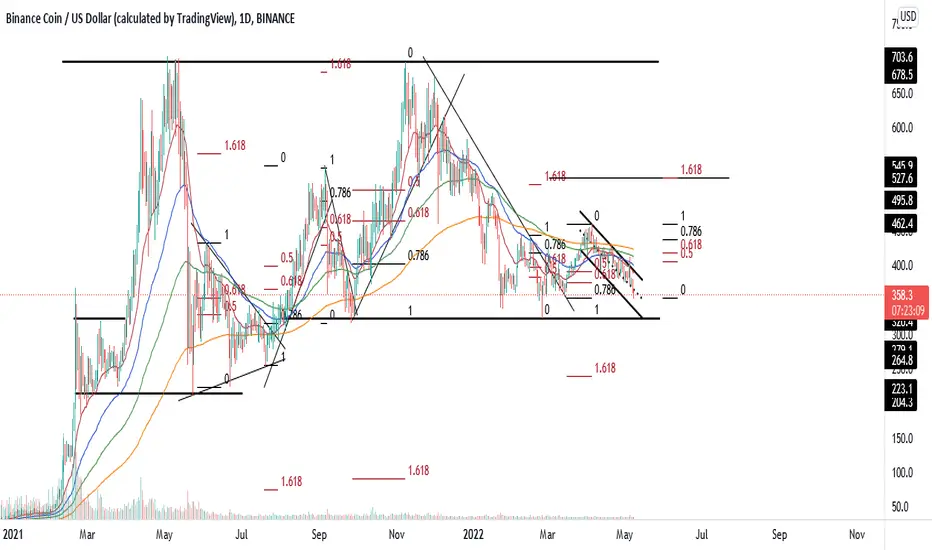
BNBUSD is trading in a big A-B-C zig-zag correction from May 2021 highs and it looks to be unfinished. In May 2021 we saw sharp and impulsive decline, which should be labeled as a first leg A. From May till November 2021 we have seen a three-wave corrective rally in wave B and since November 2021 it's trading now in wave C.
Wave C is a motive wave and it should be completed by a five-wave cycle. If we consider that May 2021 lows is still open, then current sideways consolidation could be easily just as part of subwave (4) correction before we will see another sell-off for the final wave (5) of C towards 250-200 strong support zone.
Trade well!
If you like what we do, then please like and share our idea.
Disclosure: Please be informed that information we provide is NOT a trading recommendation or investment advice. All of our work is for educational purposes only.

BNDUSDT ANALYSISThe markets have been shaky as a result of the Ukrainian war which has effected many markets especially the US stocks. It is obvious that the fundamentals play a role in the markets, but I choose to remain technical because I believe that the fundamentals still play into the market cycle that can be technically read.
BTC seems to be respecting its $34k support and this could be a blueprint for other alts like BNB.
BNBUSD ON TRACK BNBUSD good idea for long, BNBUSD was moving out from the downtrend major. and rightnow in sideways area. watch if break in minor TF.
Thank you.
BNBUSD - HEAD AND SHOULDER PATTERNHello traders, here is another opportunity with Binance. Currently printing a falling wedge pattern on the 4hr timeframe but on the weekly and daily is a confusing but amazing structure, A Double Top and Head and Shoulder, will Binance fall to all time low if the Head and Shoulder pattern is respected or still fall to all time low if the Double Top is respected?
Watch and trade with caution
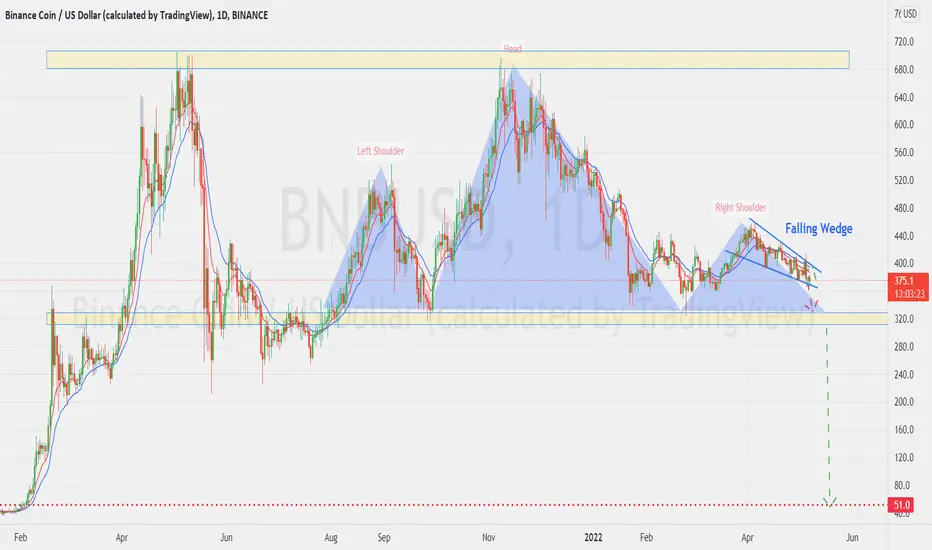
BNBUSD -Falling WedgeWill Price continue in the wedge and maybe a possible breakout to the upside for trend continuation or break out to the downside towards the weekly support?
This is another trading opportunity for crypto and Binance traders.
Binance has been in a falling wedge on the 4hr after printing a head and shoulder pattern on the weekly timeframe...
If going in for a Buy, Trade with caution, Stoploss below the Support and profit target at resistance....

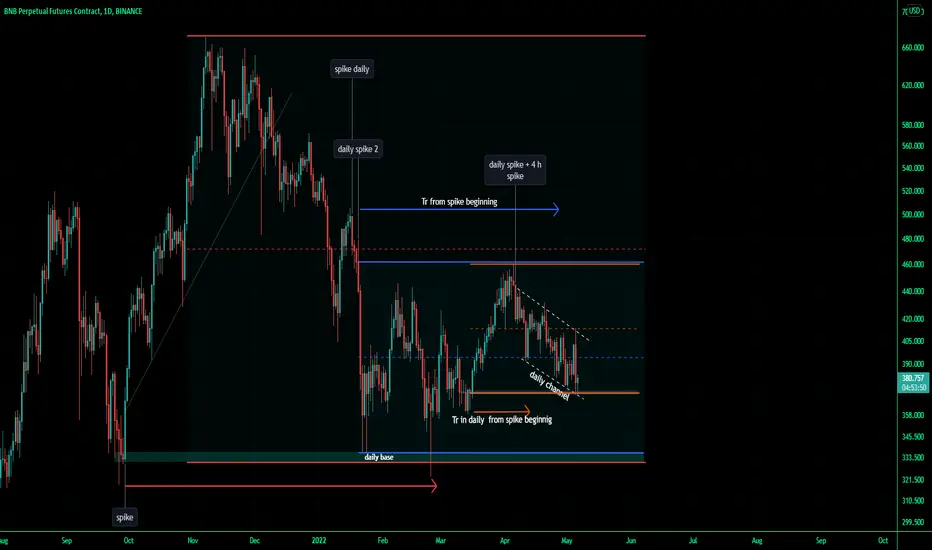
bnb short waiting for another spike for a mark down first demand zone I draw with green is first station in mark down move
BNB TO THE MOON!!Hi my friends. As I studied different Cryptos, I figure it out that something is different for BNB !
The diversion is completely obvious in its chart.
Two different things will happen. First, BNB will have a great pivot and highest high, next suggestion is many red candles in 4H trading after each other and we will see lowest low.
Let's see what's going to happen.

BNB/Tether 1DDue to the recent decline of Bitcoin, if the market is bullish, it is possible for the trend to return and achieve the desired profit.

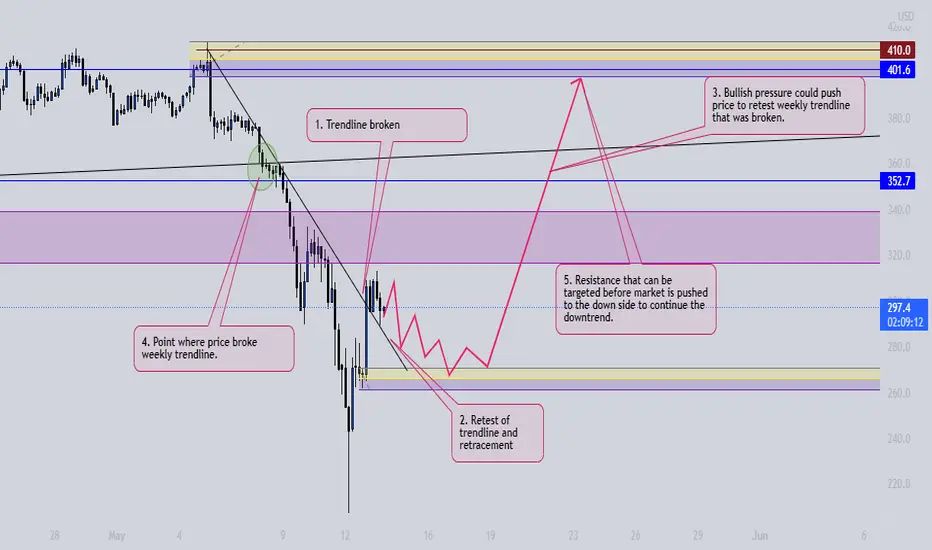
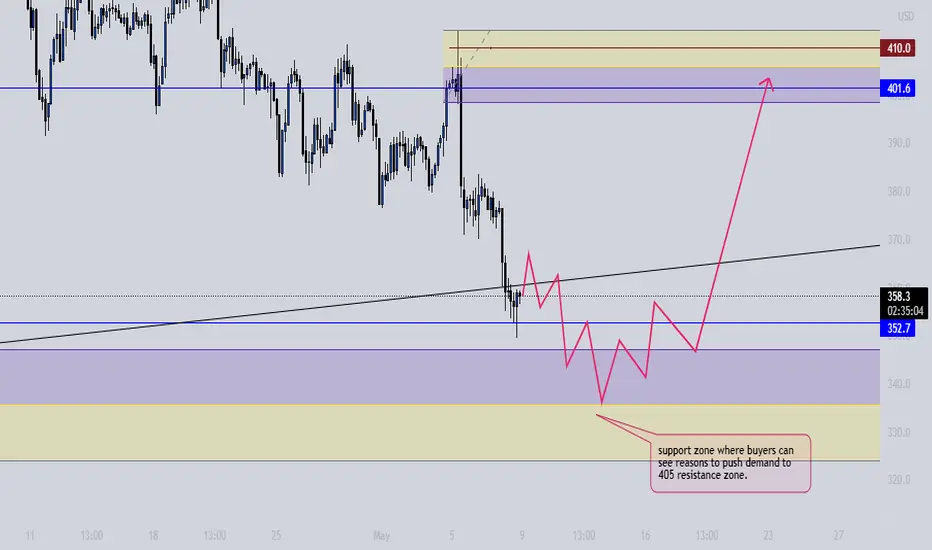
Binance Coin Price Analysis — May 6Binance Coin has had nothing short of a roller-coaster price action over the past 48 hours. Following the US Fed rate decision on Wednesday, the market recorded a sharp rally, peaking at the $413 top.
However, the market took an unexpected dive in the following hours, sponsored by the stock market. The crash recorded yesterday set BNB on course to its lowest point since March 16, as the cryptocurrency tapped the $370 low.
As we head into the weekend, we can anticipate more volatile moves for the fourth-largest cryptocurrency, with a possibility of tapping the $350 low.
Meanwhile, my resistance levels are $380, $400, and $410, and my support levels are $365, $350, and $340.
Total Market Capitalization: $1.65 trillion
Binance Coin Market Capitalization: $61.6 billion
Binance Coin Dominance: 3.73%
Market Rank: #4

BNB - BINANCE - Ready for a rally!! BINANCE:BNBUSD is looking for one more low down to the 365-375 area before the next leg up of this correction that will see us head back down below 300.
First we are looking for a rally into the 50-61.8% area between 500-530 followed by more selling.
A quick look at where we are with this one.
I hope this helps. Enjoy the day!!👍👍

BNBUSDTrading Financial assets/ Futures , Crypto,CFDs and Stocks/ Involves a high risk of loss. Specially Trading foreign exchange /Forex/ on margin carries THE HIGHEST cannot afford to lose.
Please consider carefullu if such trading os appropriate for you. Past performance is not indicative of future result.Articles and content on this Tradingview channel is for educational and
entertainment purposes only. Please do not constitute investment recommendations or advice.
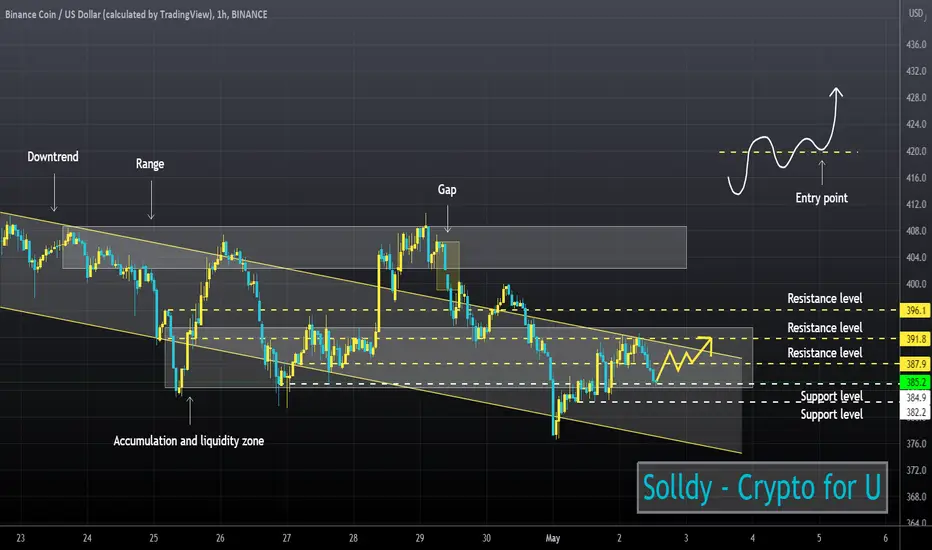
BNBUSD ❕ golden cross100MA and 200MA on the 1H Timeframe could form a golden cross in the near future.
Earlier the price formed a gap on the 1H Timeframe.
Now the range of price movement extends during the trading in the liquidity zone.
I expect fixing above the resistance level before further growth.