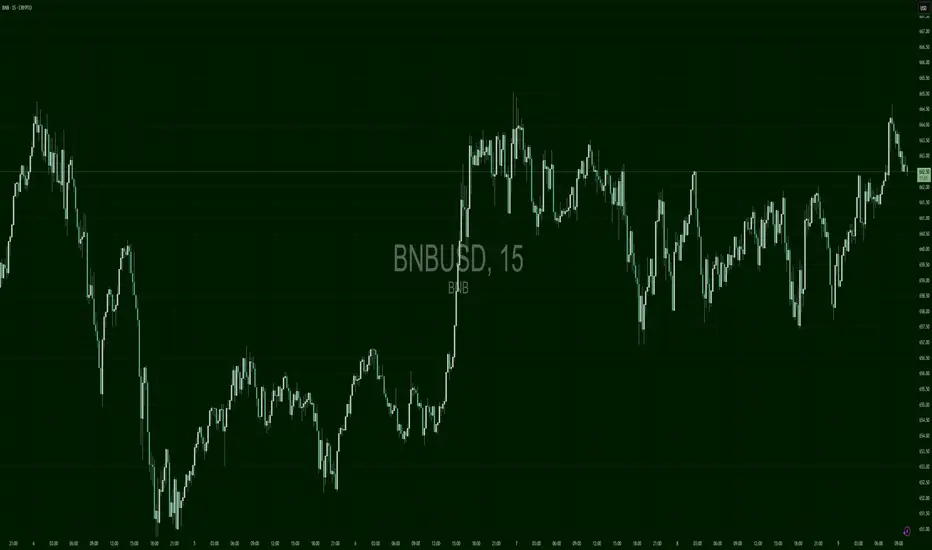
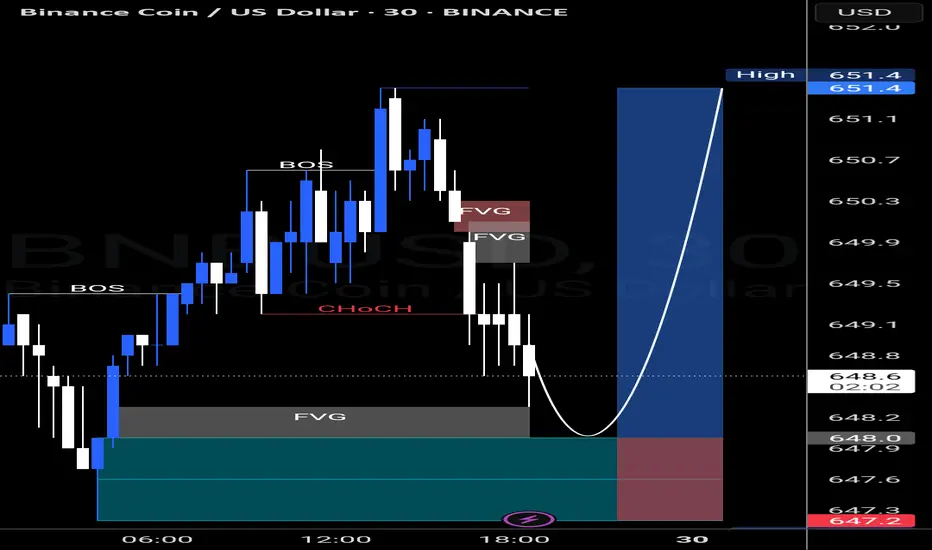
BNBUSD – Squeeze or StallBNB ripped into $668 and formed a tight double top before dropping into $653. It then coiled between $656–$664 for hours. The recent spike shows a breakout attempt, but needs to hold above $662 for bulls to confirm control. Otherwise, this is just another pop to sell.
Key stats
About BNB
Previously named Binance Smart Chain, BNB Smart Chain is unsurprisingly the blockchain network developed by crypto exchange giant Binance. The ecosystem is host to dApps, DEXes, GameFi platforms and an NFT community, with its BNB token now counted amongst the top 5 cryptocurrencies by market cap. ‘BNB’ is an abbreviation for ‘Build n’ Build’, with building very much at the core of the platform’s ethos. BNB Smart Chain has certainly been a catalyst for Binance’s move into market dominance.
Related coins
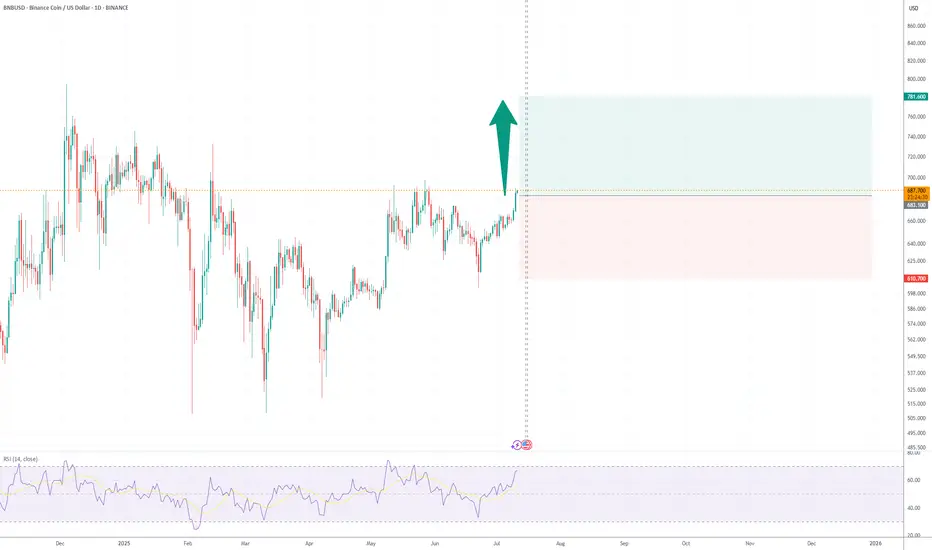
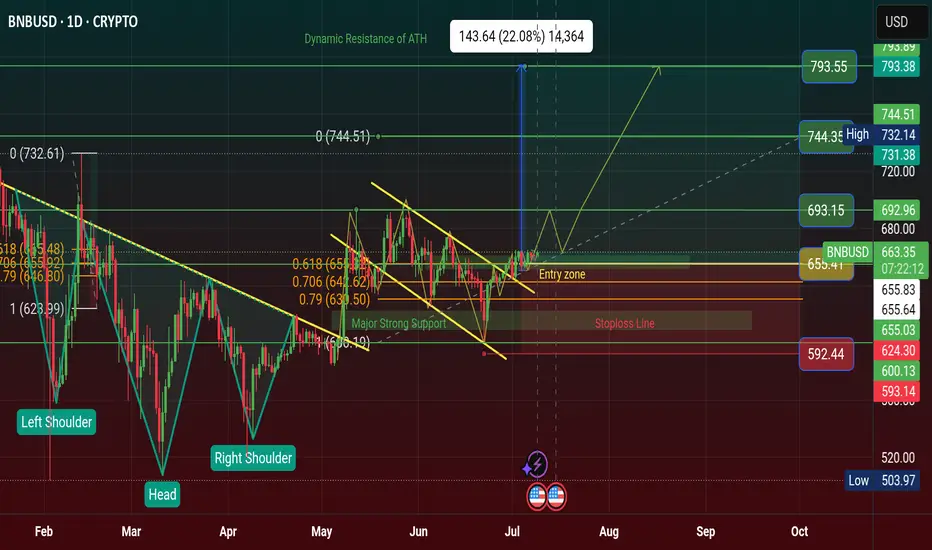
BNB Aiming for New All-Time Highs📈 After breaking above the May peak, CRYPTOCAP:BNB has activated a bullish sequence, with the equal legs target zone projected at $782–$824. This aligns with Elliott Wave extensions and confirms strong momentum from the June lows.

BNBUSD – Bull Lost the GripBNB printed a lower high near $705, then broke trend support near $695. A slow grind lower followed with minor bounces failing to reclaim key levels. Price now sits near $675 and shows bearish lower highs and descending structure. Watch $672–675 for bounce or breakdown — reclaim of $685 needed to tu

BNB/USD Trend Summary
1. Recent Price Action & History
BNB is consolidating around $660–$690, recently hitting a 52‑week high near $793 in May, with a 24‑hour range between $668–$687
Nasdaq
+14
TradingView
+14
CoinDCX
+14
.
Over the past month, it’s gained ~2–3%, with an uptick of ~4% in late June
CoinLore
+3
Tradin
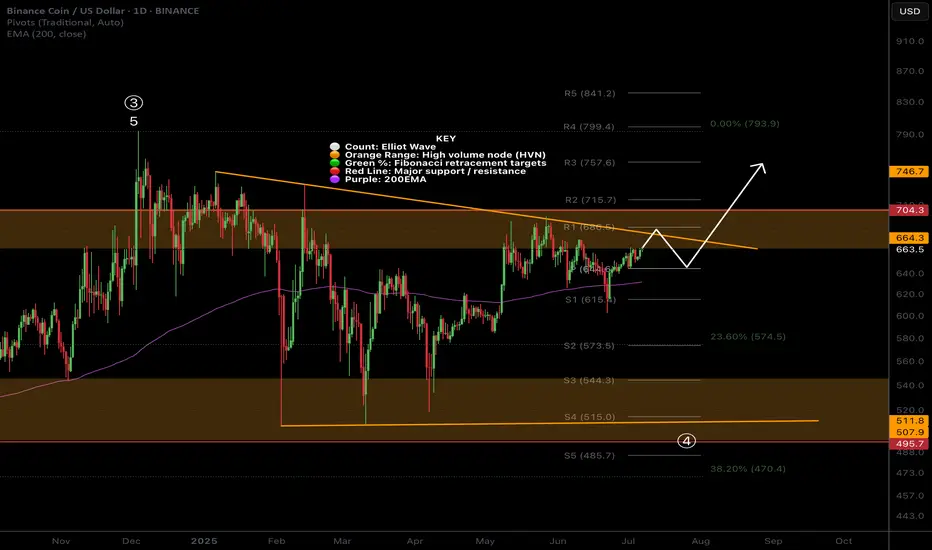
BNB Stuck in Barrier Triangle?CRYPTOCAP:BNB appears to be in a macro wave 4 barrier triangle, and for some time.
It has held up particularly well during the alt coin massacre, not even reaching the .382 Fibonacci retracement.
Price is testing the upper boundary for the 4th time, that starts to give us the higher probability b
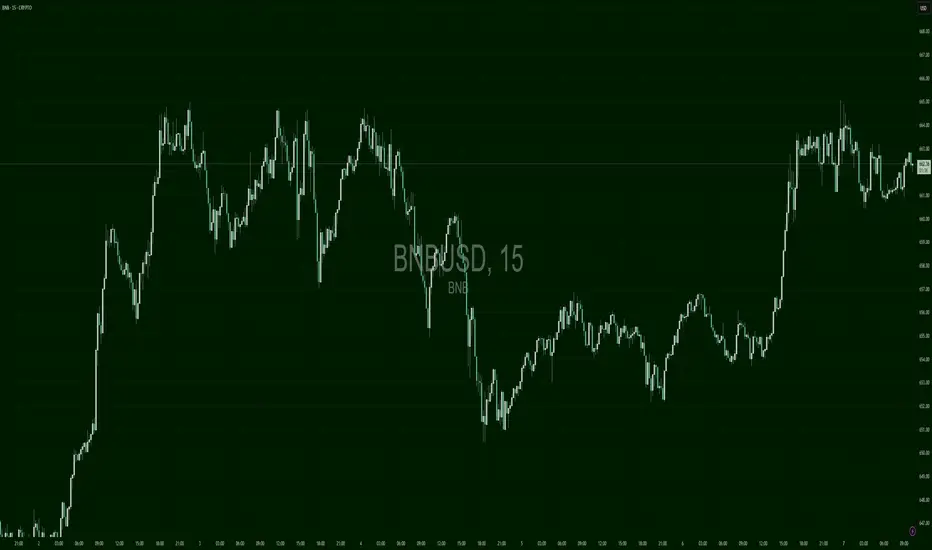
BNBUSD – Break or Burn OutBNB ran explosively into the $666–$668 zone, but was quickly met with heavy distribution. A selloff followed, driving price back to $654 before forming a rounded base. Price has now recovered into the $662–$664 area but is consolidating in a tight range. Bulls must clear $665 to regain momentum. Oth
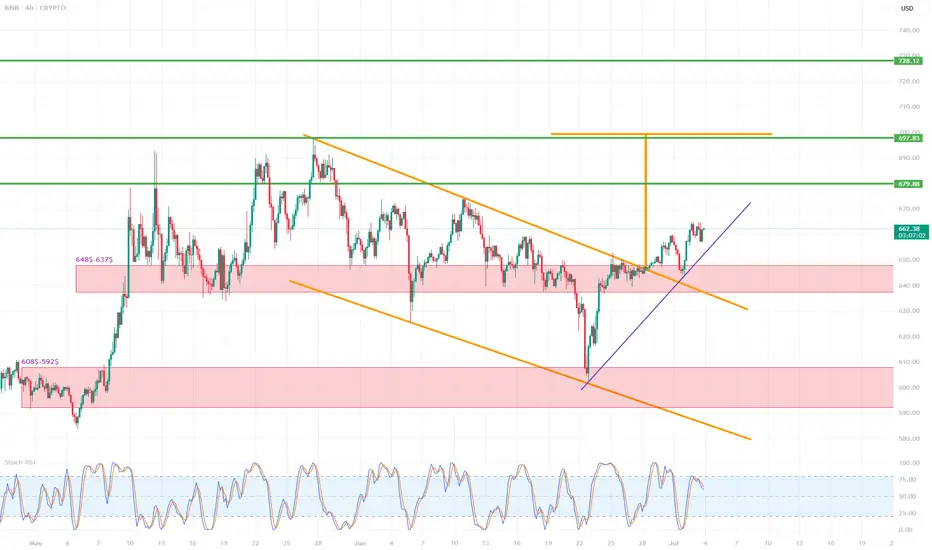
BNB/USD (4h interval)🔍 1. Chart structure
Instrument: Binance Coin / USD (BNB/USD)
Interval: 4 hours
📐 2. Technical formations
🔸 Breakout from the descending wedge formation
The descending wedge (orange lines) is a bullish formation - it suggests a potential breakout upwards.
The breakout occurred dynamically, with a
$BNB Chart Showing Bullish Flag Pattern and Price Will Hit +$750CRYPTOCAP:BNB Previously Chart showing Bullish Inverse Head and Shoulder Pattern and Gain Profit of Range. It's a Reversal Pattern .
Now Chart Showing a Bullish Flag Pattern and it's Continuation Pattern. Time to Bullish for BNB Coin for FOMC 10th July Thursday 2025.
The upsloping 20-day EMA and
BNBUSD Bullish BNBUSD Analysis Update
Price has already mitigated the Fair Value Gap (FVG), and we are now anticipating a potential mitigation of the nearby Order Block (OB). On the Daily Chart, a bullish flag pattern is clearly in play, with the structure showing a confirmed third touch. We’re currently testing
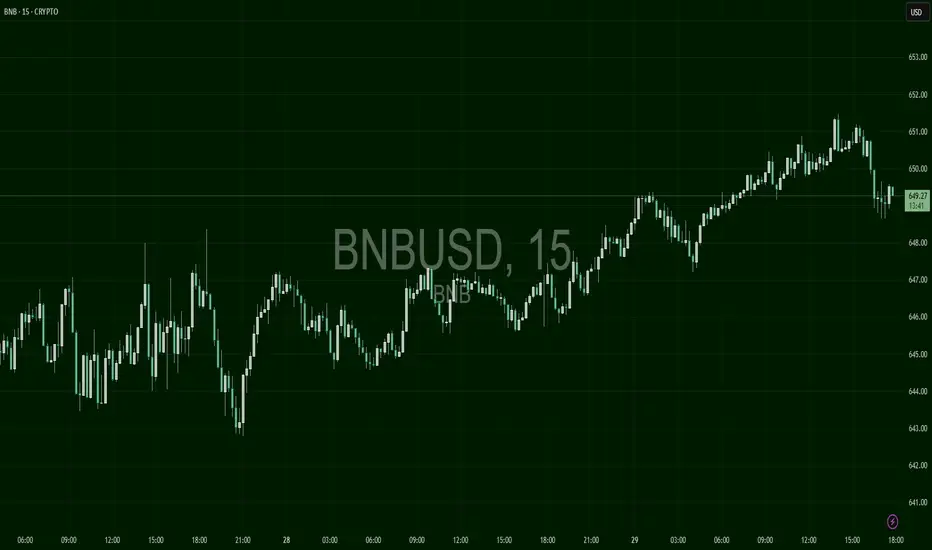
BNBUSD – Inverse Head & Shoulders PlayBNB formed a messy inverse head-and-shoulders structure with neckline at $649. After multiple rejections, it finally broke through and is holding above. Now consolidating just under $651, preparing for the next leg. Entry above $651 confirms continuation, while falling below $648 invalidates the bul
See all ideas
Summarizing what the indicators are suggesting.
Oscillators
Neutral
SellBuy
Strong sellStrong buy
Strong sellSellNeutralBuyStrong buy
Oscillators
Neutral
SellBuy
Strong sellStrong buy
Strong sellSellNeutralBuyStrong buy
Summary
Neutral
SellBuy
Strong sellStrong buy
Strong sellSellNeutralBuyStrong buy
Summary
Neutral
SellBuy
Strong sellStrong buy
Strong sellSellNeutralBuyStrong buy
Summary
Neutral
SellBuy
Strong sellStrong buy
Strong sellSellNeutralBuyStrong buy
Moving Averages
Neutral
SellBuy
Strong sellStrong buy
Strong sellSellNeutralBuyStrong buy
Moving Averages
Neutral
SellBuy
Strong sellStrong buy
Strong sellSellNeutralBuyStrong buy
Curated watchlists where BNBUSD is featured.

Centralized exchange tokens: Stuck in the middle with you
7 No. of Symbols

Crypto tokens: Chips and dips
24 No. of Symbols
Staking Coins: Pick up a stake
18 No. of Symbols

Top altcoins: Choose your alternatives carefully
28 No. of Symbols
See all sparks
Frequently Asked Questions
The current price of BNB (BNB) is 688.89 USD — it has fallen −0.17% in the past 24 hours. Try placing this info into the context by checking out what coins are also gaining and losing at the moment and seeing BNB price chart.
The current market capitalization of BNB (BNB) is 95.95 B USD. To see this number in a context check out our list of crypto coins ranked by their market caps or see crypto market cap charts.
BNB (BNB) trading volume in 24 hours is 1.97 B USD. See how often other coins are traded in this list.
BNB price has risen by 4.25% over the last week, its month performance shows a 6.27% increase, and as for the last year, BNB has increased by 13.30%. See more dynamics on BNB price chart.
Keep track of coins' changes with our Crypto Coins Heatmap.
Keep track of coins' changes with our Crypto Coins Heatmap.
BNB (BNB) reached its highest price on May 21, 2025 — it amounted to 777.00 USD. Find more insights on the BNB price chart.
See the list of crypto gainers and choose what best fits your strategy.
See the list of crypto gainers and choose what best fits your strategy.
BNB (BNB) reached the lowest price of 585.47 USD on May 5, 2025. View more BNB dynamics on the price chart.
See the list of crypto losers to find unexpected opportunities.
See the list of crypto losers to find unexpected opportunities.
The current circulating supply of BNB (BNB) is 139.29 M USD. To get a wider picture you can check out our list of coins with the highest circulating supply, as well as the ones with the lowest number of tokens in circulation.
The safest choice when buying BNB is to go to a well-known crypto exchange. Some of the popular names are Binance, Coinbase, Kraken. But you'll have to find a reliable broker and create an account first. You can trade BNB right from TradingView charts — just choose a broker and connect to your account.
BNB (BNB) is just as reliable as any other crypto asset — this corner of the world market is highly volatile. Today, for instance, BNB is estimated as 1.09% volatile. The only thing it means is that you must prepare and examine all available information before making a decision. And if you're not sure about BNB, you can find more inspiration in our curated watchlists.
You can discuss BNB (BNB) with other users in our public chats, Minds or in the comments to Ideas.