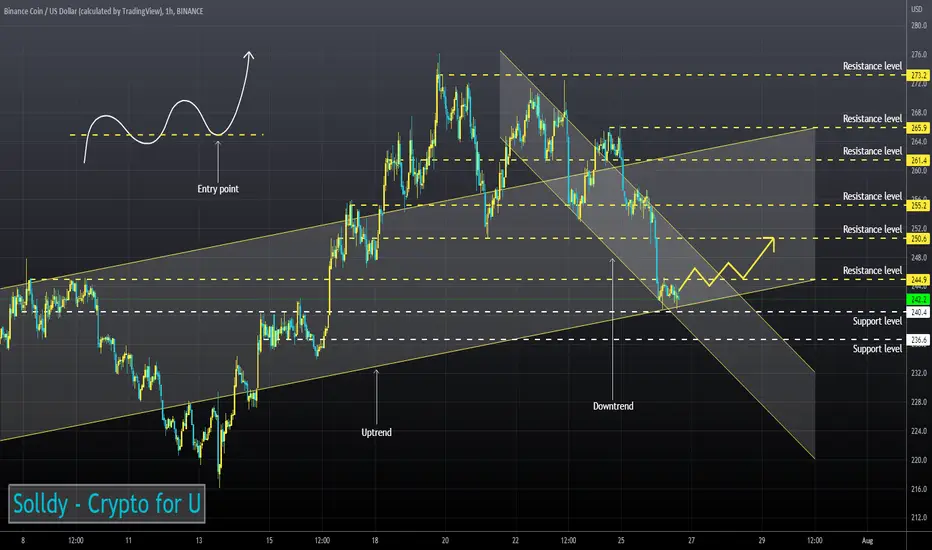
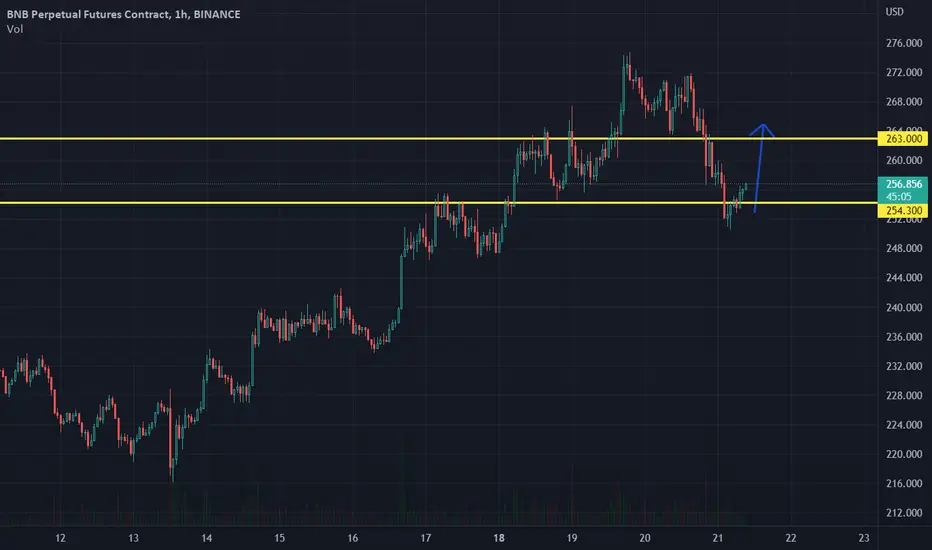
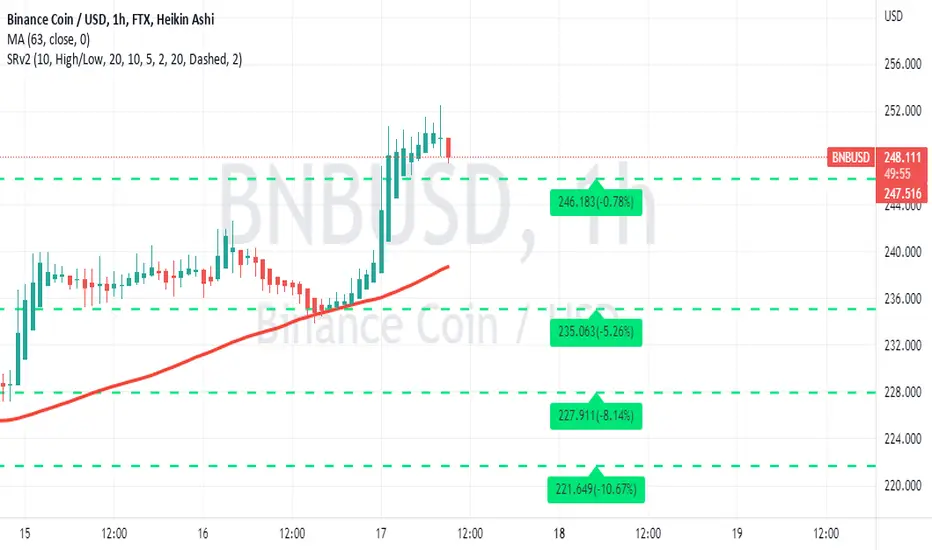
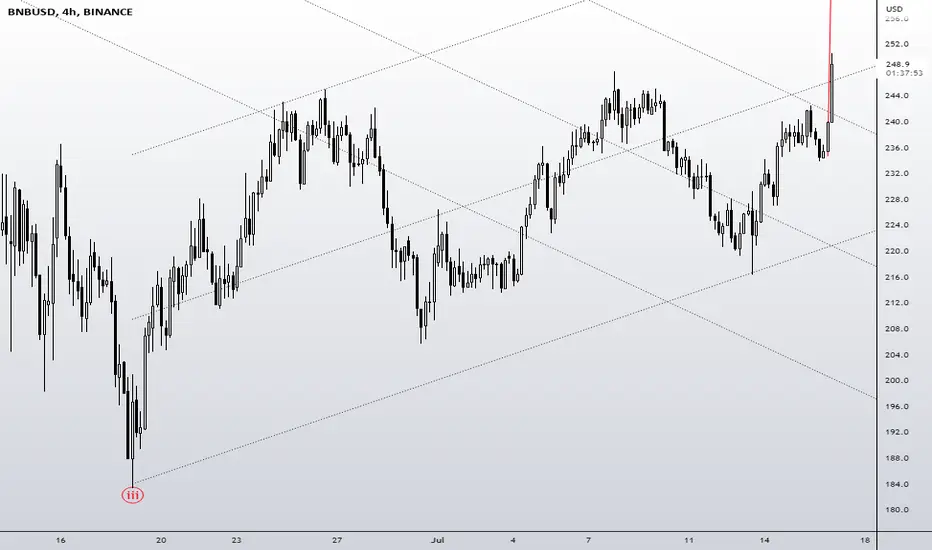
BNBUSD ❕ channel crossingBNB is above a strong support level and at the lower boundary of two channels.
Volatility has become low.
TD Sequential has formed an up reversal signal (4H and 1H TFs)
Price has moved out of the oversold RSI zone (1H TFs)
I expect that the asset may start to rise after exiting the descending channel and fixing above the resistance level.
BNBUSD trade ideas
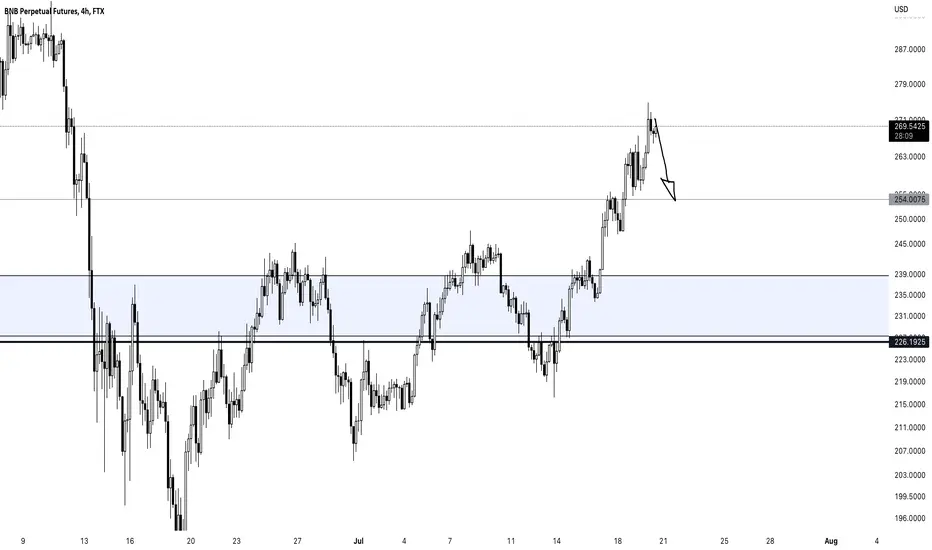
SHORT BNB/USDLe prix a dessiné un triangle descendant. Nous avons une vente long terme qui s'annonce.

BNBUSDchunk as pennanty thing
but its already broken down
looks weak tbh would want to see some overall market strength before taking a position
however as the structures sitting at the lows
technically we could play the higherlow as the stoploss if we think another elliot drive is possible here
fundamentally 28th of july is fomc data so prolly should be looking for shorts here more than anything...
also august is mtgox final btc unlock could be incredibly bearish if everyone whos returned their btc sells
however these are the people who were investing in 2015 well before mass market psycology kicked into full gear so they should be fully aware of the strong fundamentals and understand that leavinng their investment for a few more years would be worth their while
my guess is on initial fud downmove then bullish unlock actual event ie btc is returned and not sold
this would time up well with speculative eth2 merge and us govmnt stock pump cycle
so makes enough sense to me...
bnb is an exchange but, considering they hold alot of liquidity its almost like a bank, biggest crypto bank will one day parity with biggest tradfi bank given there are no boarders ie its global.
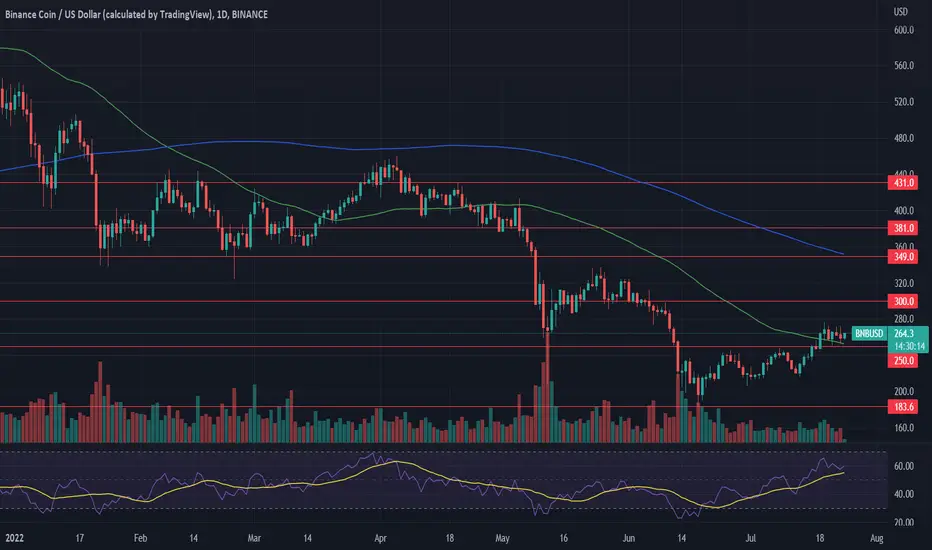
Binance Coin: $300 is the next target?Binance Coin started the previous week by testing the support line at $250. Soon the coin managed to revert to the upside, reaching the weekly highest level at $276. Next resistance line at $300 has not been tested on this occasion, but with its latest moves, the coin opened a path to this level. RSI was pushed to the level of 65, but a clear overbought market has not been reached. This move indicates that the market will certainly watch this line in the coming period. Moving averages of 50 and 200 days are moving as two parallel lines for the second week in a row, however, convergence has still not started.
Technical analysis is pointing that the path toward $300 resistance is currently open. However, in order to reach this level, some short reversal might lay ahead. There is a higher probability that BNB will revert to the support line at $250 in order to test it one more time, before it reverts back to next resistance.
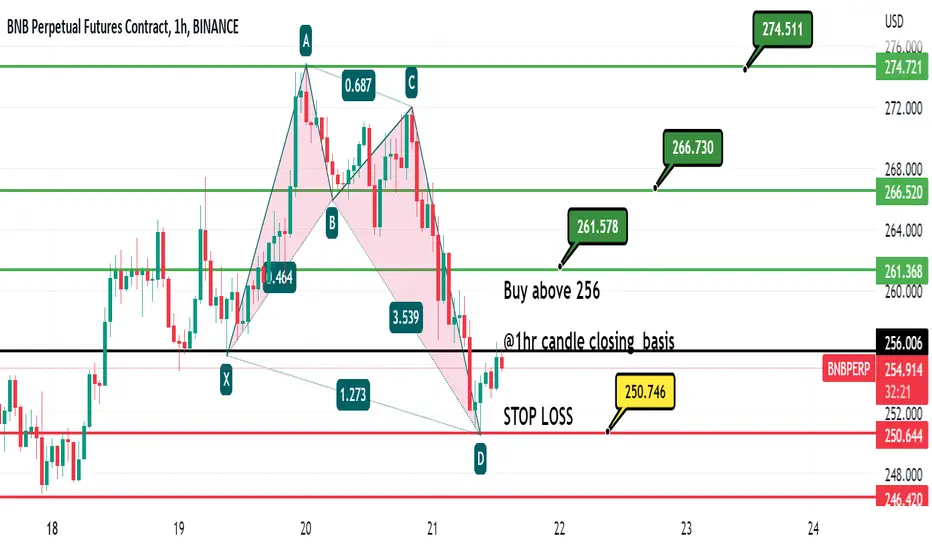
BNBUSDT LEVELS 21.07.2022 (1HR Candle)BNBUSDT now form the crab harmonic pattern ,once its conformed then will expect 265-270 in short term
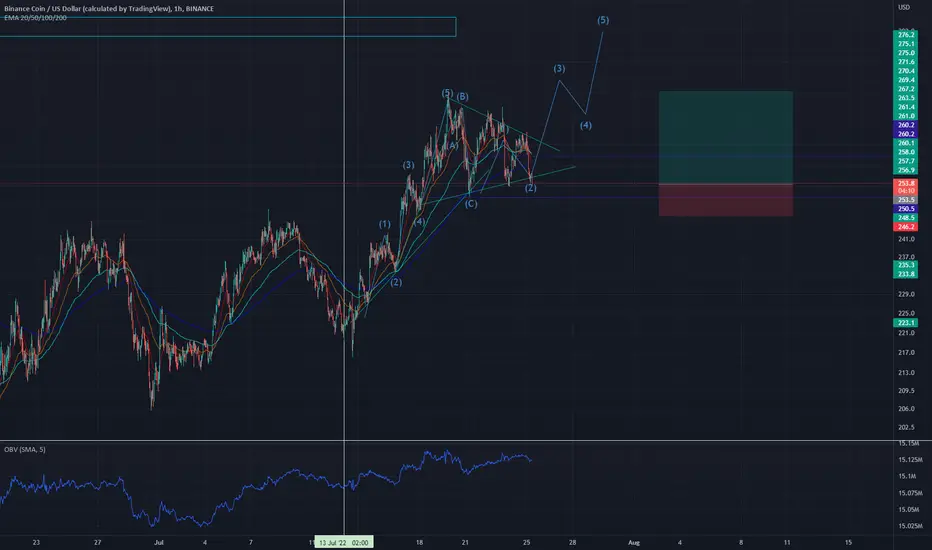
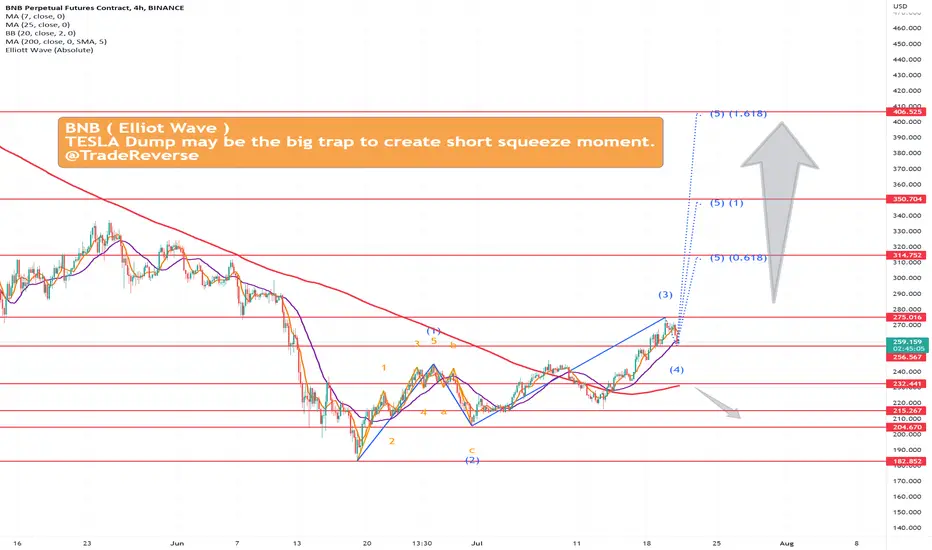
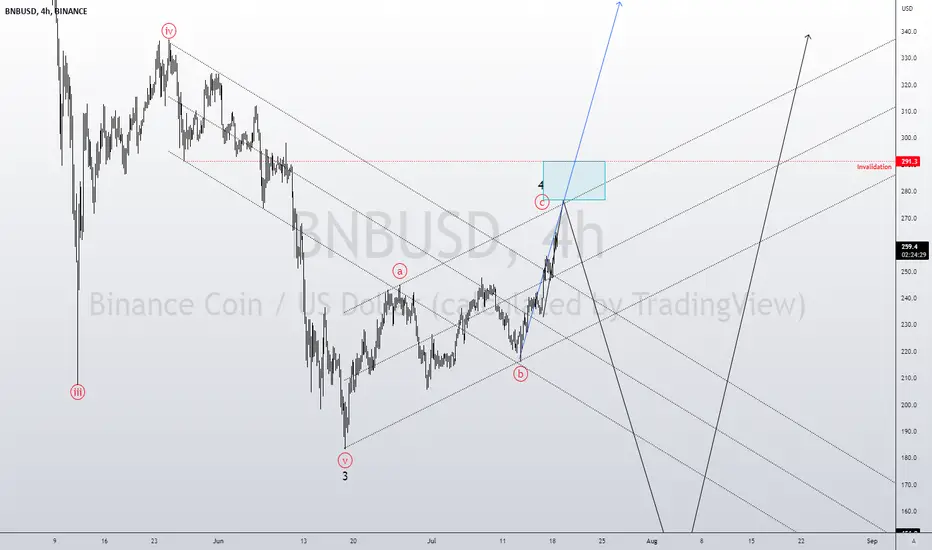
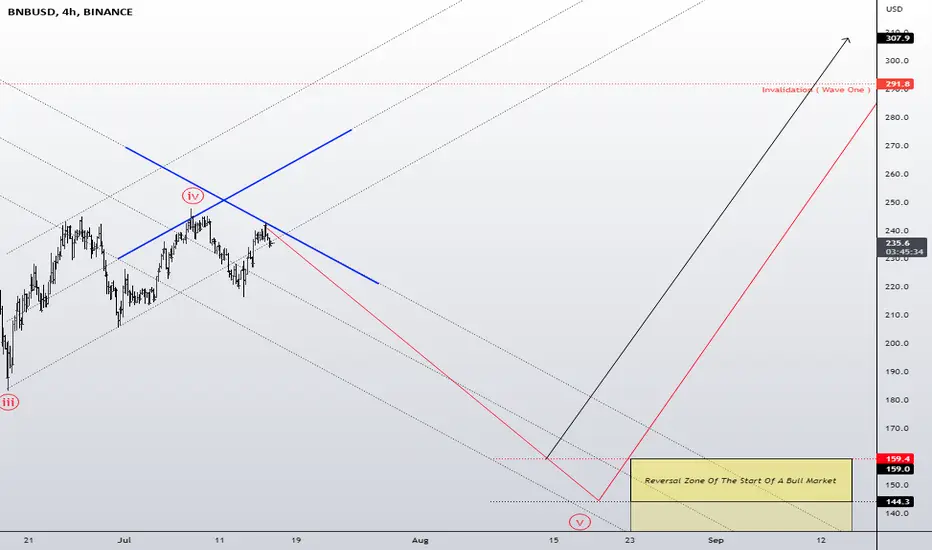
BNB - Binance Coin - Elliot Wave - Wave5 is Pending BNBUSDTBNB - Binance Coin - Elliot Wave - Wave5 is Pending BNBUSDT BNBBTC
exit below 230
BNBSubscribe to my TradingView profile❤️
Classic technical analysis, nothing more...
I expect a test of the support line and a reversal...
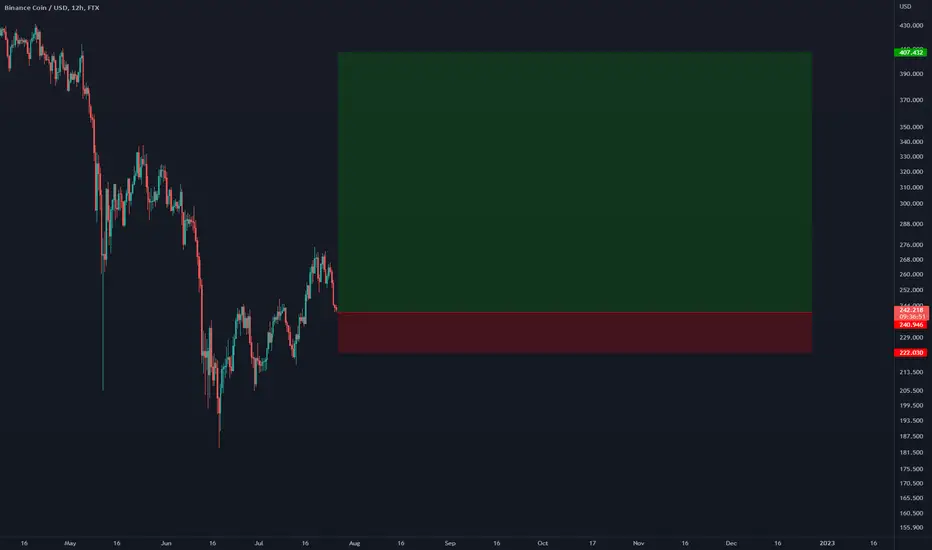
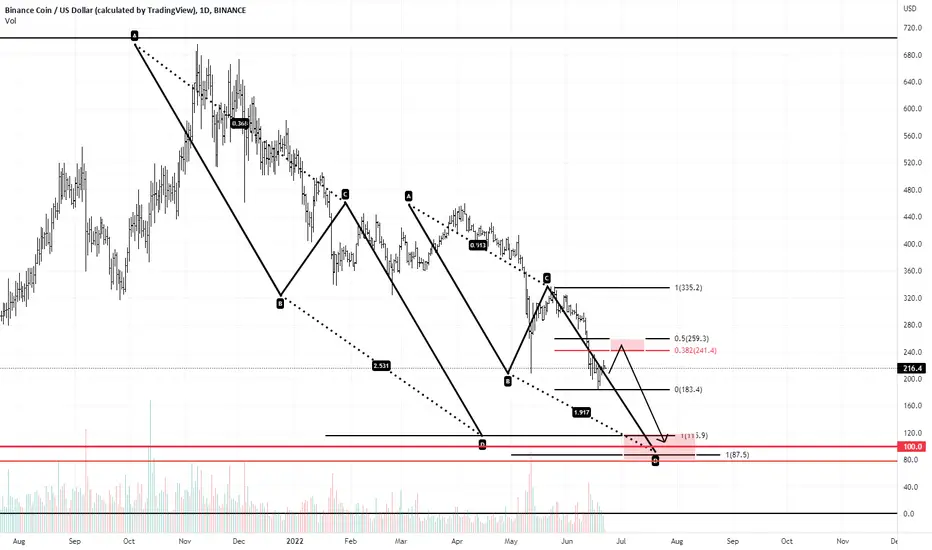
BNB - BACK BELOW 100??More downside in Binance to come.
Simple AB=CD Patterns repeating here.
If it rallies to around 250 then that would set up a 3rd ABCD pattern down to the 100 area.
Not quite time to Buy the Dip.. 🤔🤔
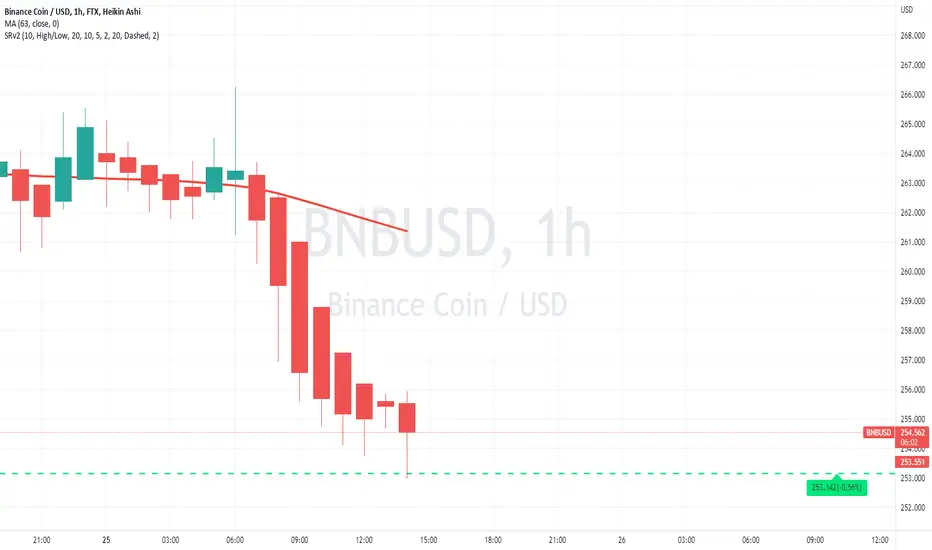
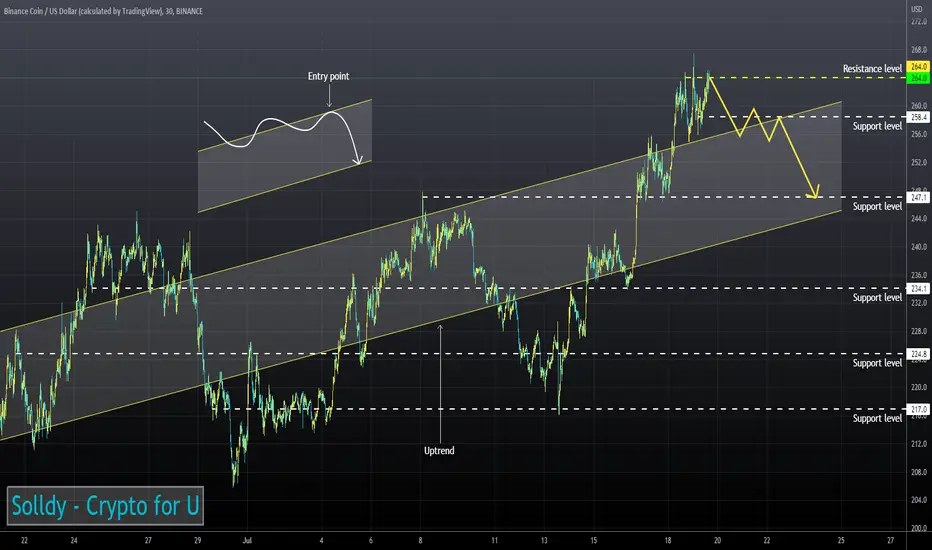
BNBUSD ❕ bnb at the tipping pointBNB is under liquidity.
Volatility has declined.
RSI and price have formed a bearish divergence (1H TF)
Trading volumes and price formed a bearish divergence (30m TF)
TD Sequential formed a downward reversal signal (30m TF)
I expect that the price may change the trend when fixing in the channel.
The possibility of digital currencies falling or rising againstHello traders, good night. There are two possibilities: if the dollar continues its upward trend, we will see a decrease in digital currencies, which is more likely; otherwise, the upward trend of digital currencies has begun. Good luck and trade responsibly.( Reason: Digital currencies are linked to the US dollar #correlation# )
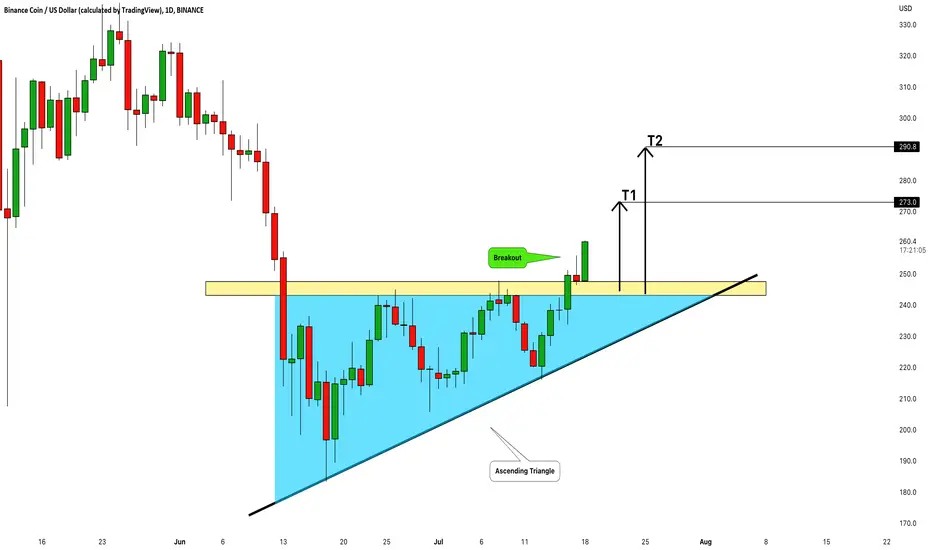
Binance Coin (BNBUSD): Looks Bullish! Here is Why:
Binance coin broke and closed above a resistance line of an ascending triangle formation on a daily.
Being a very bullish pattern, that formation signifies a dominance of bulls on the market.
I expect a growth to 273.0 / 290.0
❤️If you have any questions, please, ask me in the comment section.
Please, support my work with like, thank you!❤️
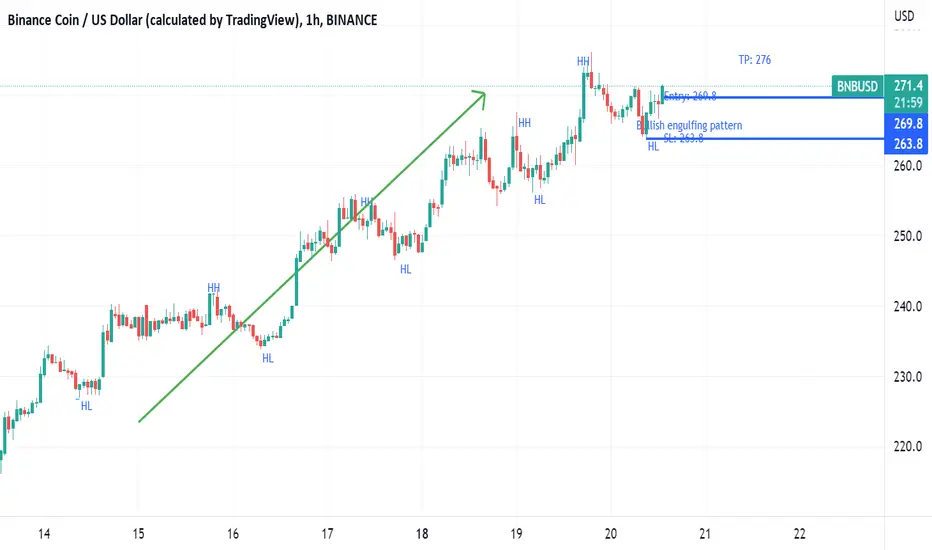
BNB/USDTBNB broke the resistance on higher time frames, looking healthy as bitcoin dominance is also dropping. If you like the idea, give a thumbs up and follow for more.
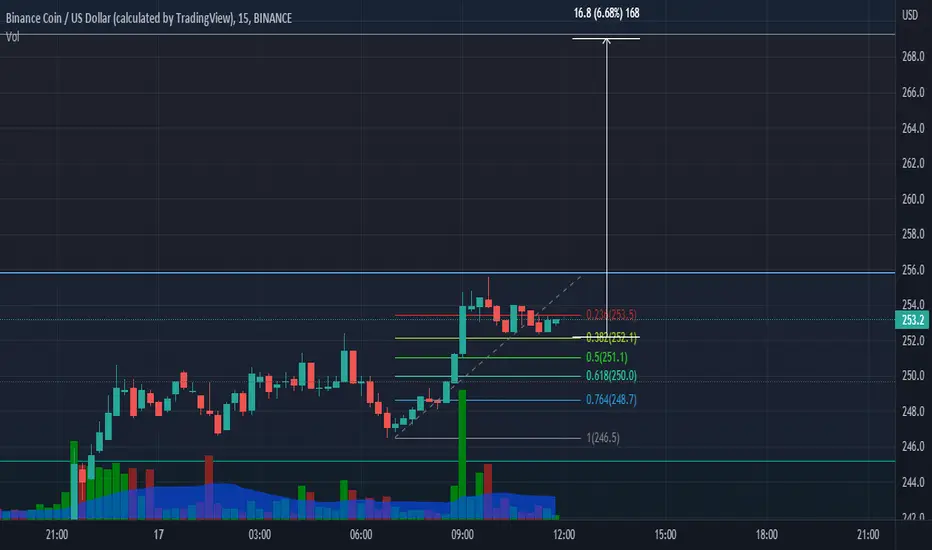
BNBUSDBNBUSD has taken good support at 252. Retracement is almost over on 15 min TF. It will try to touch 270.
Binance Coin: opening path to $300?Under the sentiment of the bearish market, BNB, like many other coins on the crypto market, was pushed to the lower grounds without an obvious reason. Based on its latest moves, it seems like that the market started to look at actual value of the coin, and not only toward macro economics, which would certainly be positive for BNB in the future period, considering Binance`s latest significant business expansion.
Although BNB started the previous week at lower grounds, above the support line at $200, the rest of the week the coin was heading toward the resistance line at $250. This line has been clearly tested, and the coin also finishes this week around this level. Buying orders were dominant on the market during the whole week. RSI was pushed above the level of 50, reaching 57 as of the weekend. This implies that the coin might soon reach overbought territory, which certainly opens the path toward the next resistance line at $300. For the last two weeks, moving averages of 50 and 200 days slowed down their divergence from each other and are still moving as two parallel lines. Cross is still not in prospectus.
Current charts show that BNB will start a week ahead by testing the resistance line at $250. There is increased probability for this line to be broken to the upside, when the coin will head toward the next resistance line at $300. However, on this road, there could be short stops around the $270 level. On the opposite side, there is some probability for $200 support to be tested for one more time.

BNB Cash to hit $236BNB Cash to hit $236
***
BNB Cash is a token built on Binance Smart Chain. Binance Smart Chain is virtually fast, secure, and very low in transaction fees. The utility behind this token is promising, boosting a real-world integration that will start from 2021 through 2023
Binance is correcting and the bear market continuesHello traders. Binance is forming a zigzag pattern and will continue its downward trend. Good luck
Binance is in correction, but the bear market is not over yetHello and greetings to all. Binance is in a corrective structure. There are two scenarios, the continuation of the downward trend or the continuation of the corrective movement, but the downward trend has not yet been completed. Good luck.
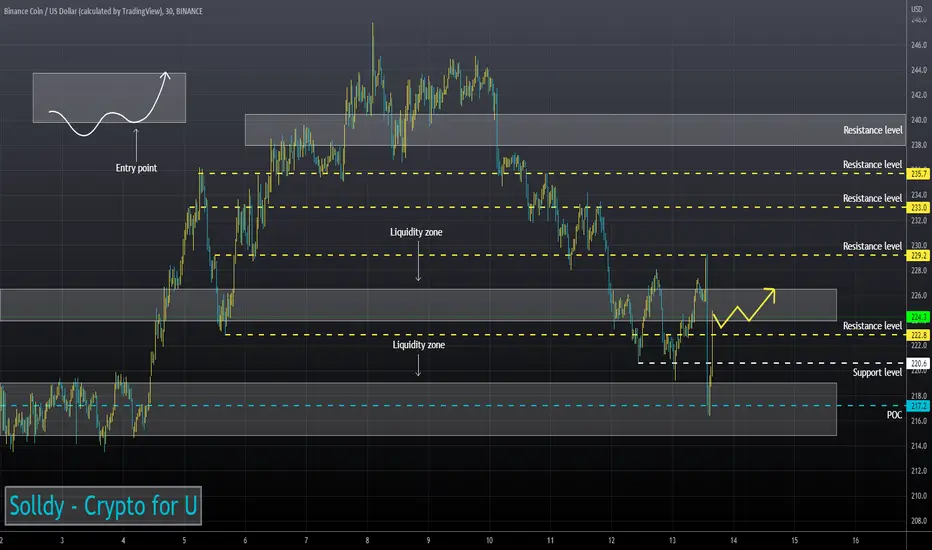
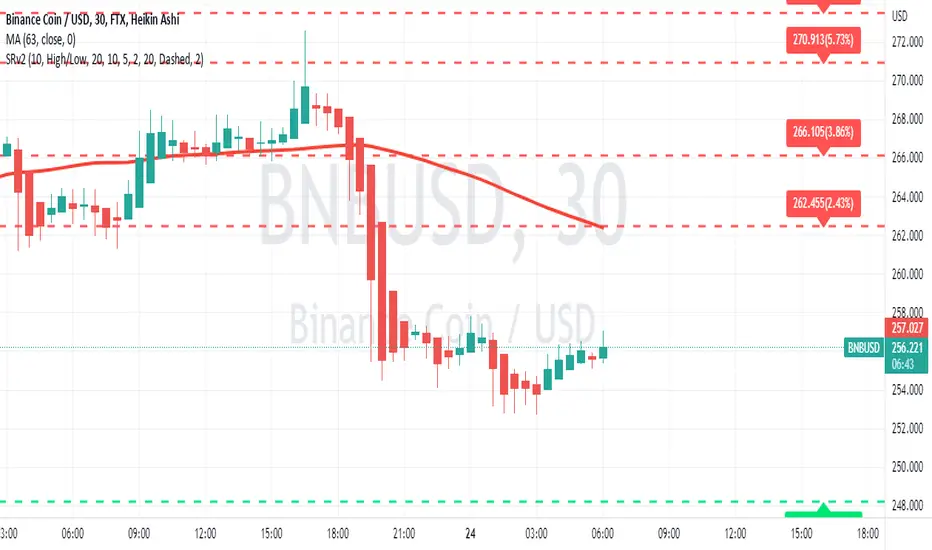
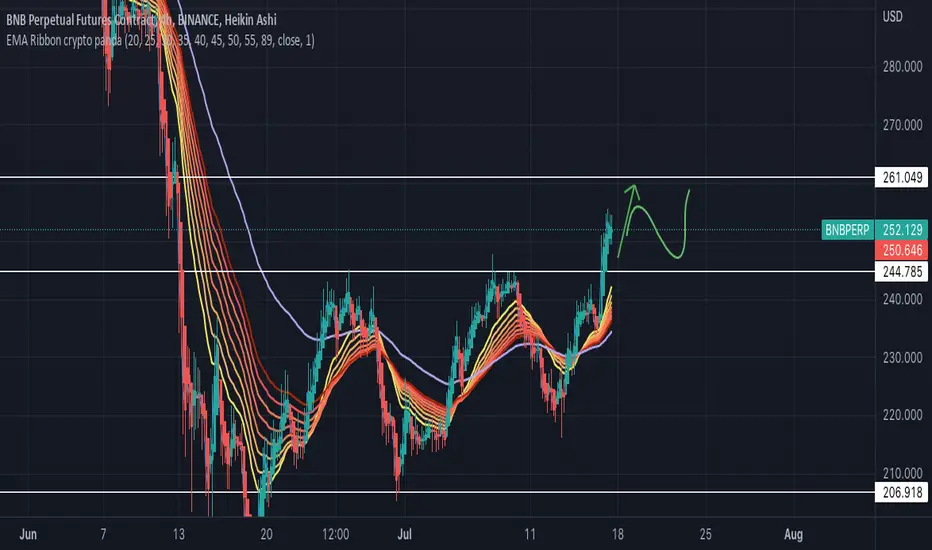
BNBUSD ❕ the price is above the point of contolBNB is performing better than the market.
Price is above liquidity.
Price and RSI have formed a bullish divergence (4H and 1H TFs)
I expect BNB to continue rising after fixing in the liquidity zone.