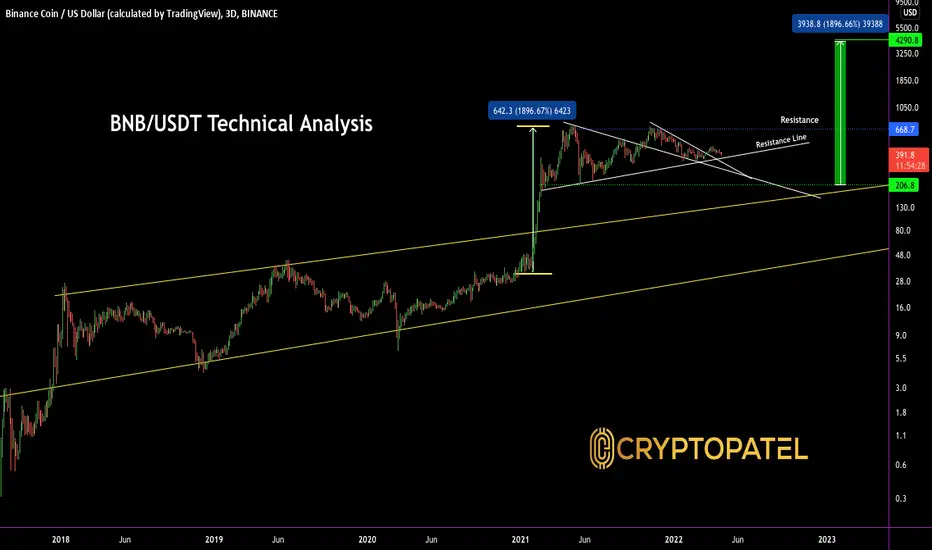
BNB/USDT Sky Rocket After this Big Dip?#BNB/USDT TA Update:1
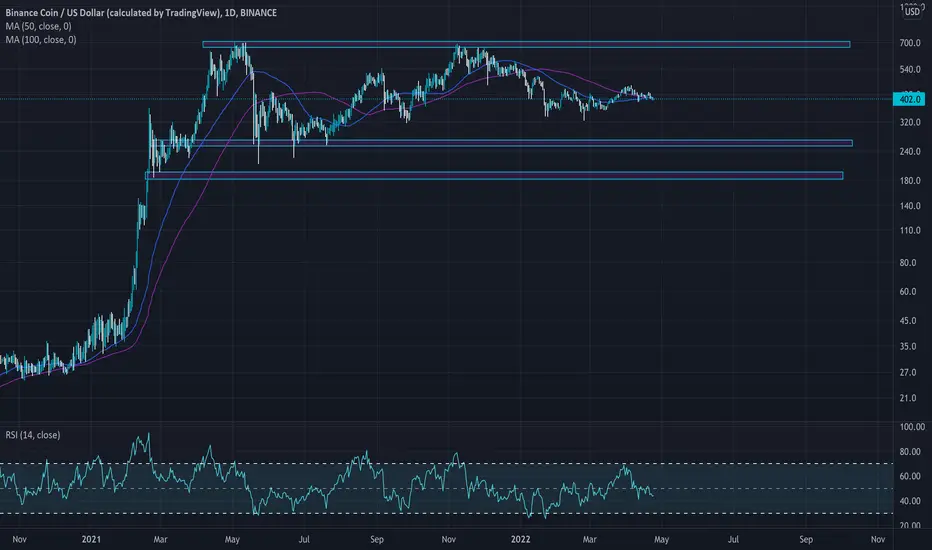
$BNB currently trading at $391
#BNB almost -47% from All time High.
In simple Long term BNB is very Potential.
So You can buy at every big Dip.
I can expect another -47% down also possible.
Let’s see If hold $370 support then BNB bullish till $668
And After breakout $668 then BNB will sky Rocket.
But If not managed to hold $370 level then we can see $200 level range.
If failed to hold this level then September and October will be best time to Buy at big dip.
So Important level is $370
Keep an eye on this level.
BNBUSD trade ideas
BNBBNB
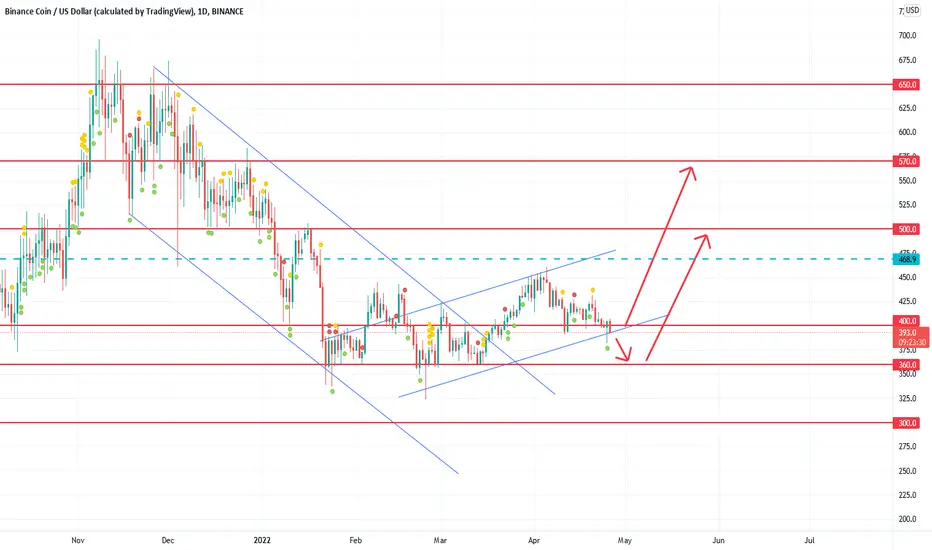
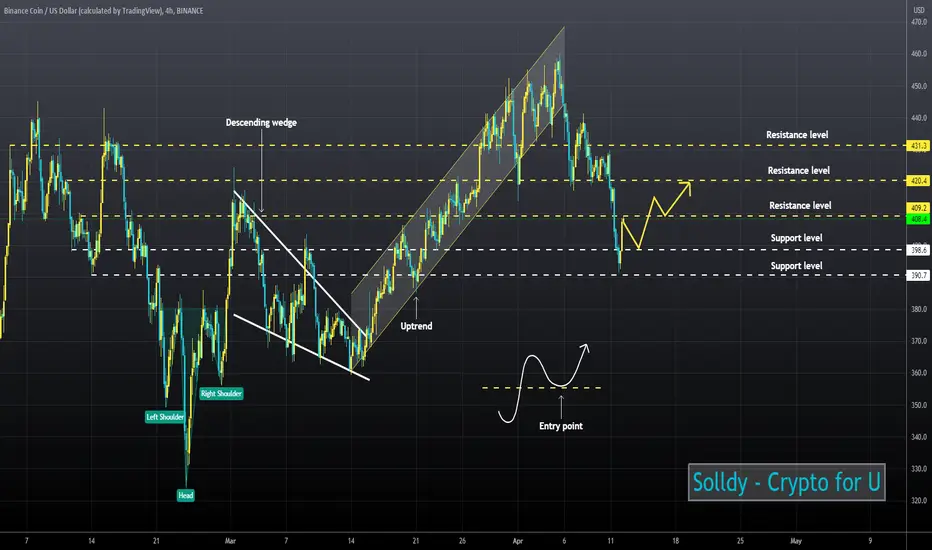
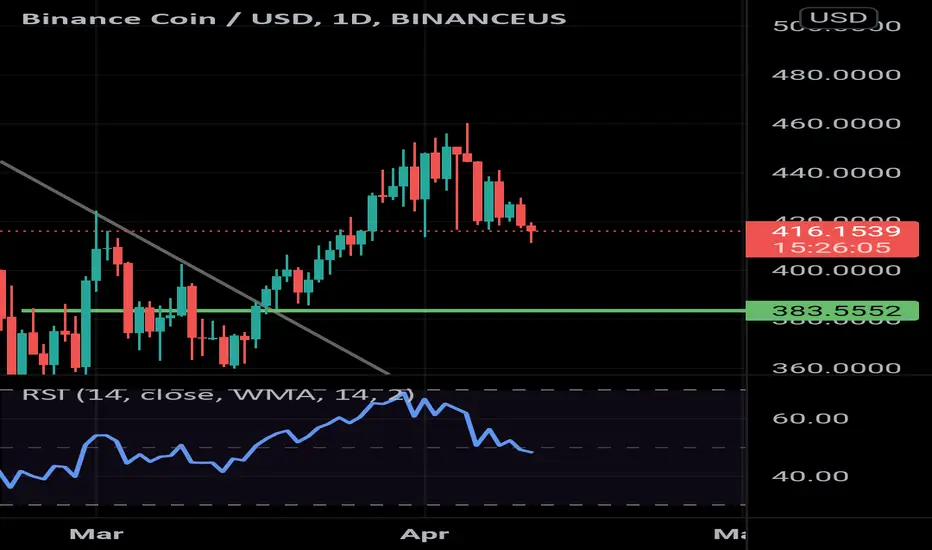
The potential of the BNB coin and whether the breakdown of the $400 support level is false!
The last trading week of April opened with a re-test of the breakdown of the $400 support level, which is the point of intersection of the trend line of the current ascending channel. It is possible that during the current trading week, the price will test the local support of $360, which will contribute to the formation of a "double bottom" reversal technical figure with a further potential reversal and the subsequent formation of a long-term upward channel. This is indirectly confirmed by the large accumulation of pent-up demand at this level of the BNB cryptocurrency.
The breakdown of the $360 local support opens up an opportunity for deeper downward dynamics and a test of the $300 level.
BNBUSD ❕ the correction is comingThe price of BNB has returned to the descending channel.
When the border was broken, the volumes increased.
I expect fixation in the channel before a drop to the 390 area.
15 minute BNB 14 hour trend recordingthe supertrend indicators are at 500 dollars
dont think we will see that happen-
recording this for a alpha trend in the future- hopefully depending....or I delete this post. lol

BINANCE COIN... JUST BUY, STAKE AND HODL.$BNB is such a good investment for real investors, Binance still has alot of potential for long term!
Don't worry my friend, all you have to do is Buy $BNB every week/month (DCA), stake $BNB and HODL!
See you next years at $1k each BNB.
EASY PEASY
8I would like this idea on my public profile only, I don't mind if it's not in the trading view ideas section.
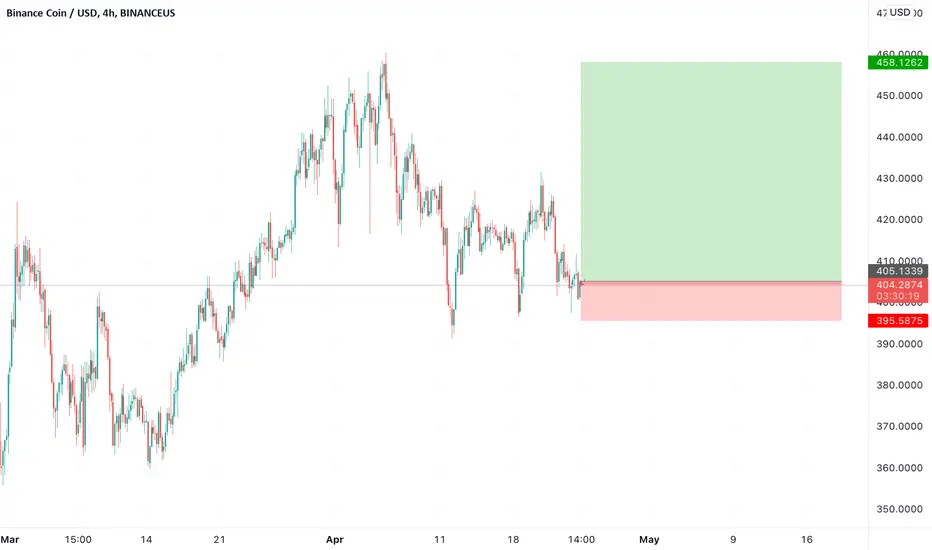
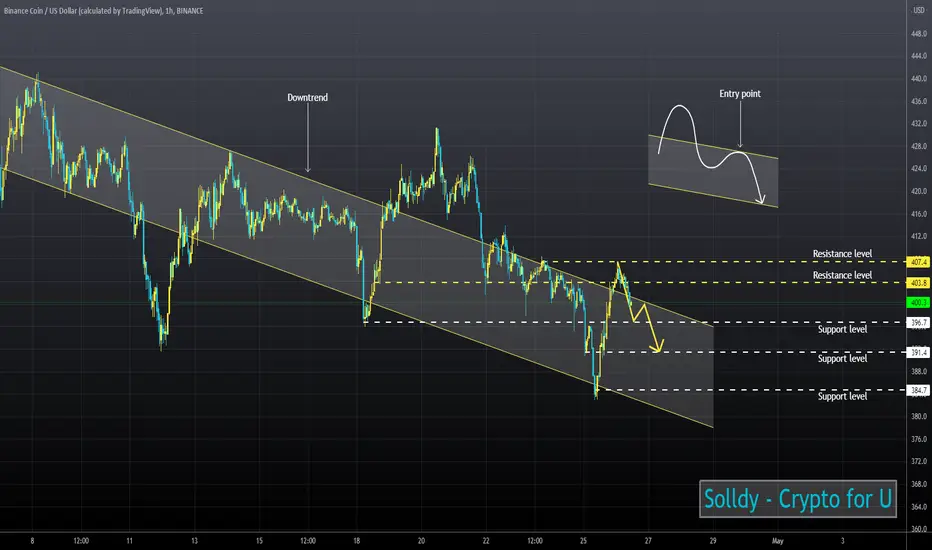
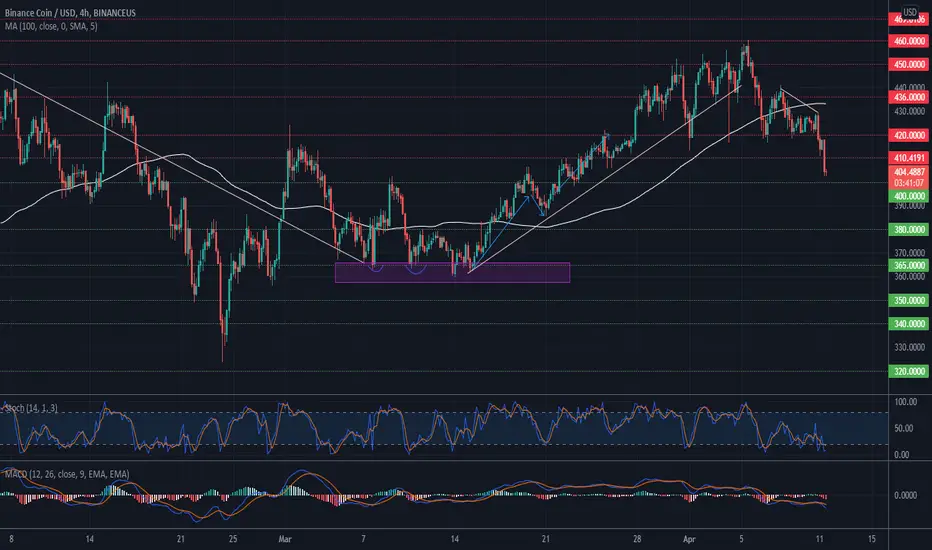
Binance Coin Price Anlaysis — April 22Binance Coin (BNB) tumbled towards the $400 support on Thursday as the broader market lost its bullish momentum. The fourth-largest cryptocurrency dropped to the $401.45 mark yesterday night before rebounding to the $410 resistance. However, BNB appeared to lack the bullish composure to sustain a push to the $420 mark, where the 4-hour 100 EMA resides.
That said, a fall to the $400 round figure over the coming hours is likely and necessary to complete the newly-formed trading cycle. A retrace to the $400 level should trigger a rebound towards $436 over the coming day.
Meanwhile, my resistance levels are $420, $436, and $450, and my support levels are $400, $380, and $365.
Total Market Capitalization: $1.85 trillion
Binance Coin Market Capitalization: $66.5 billion
Binance Coin Dominance: 3.58%
Market Rank: #4
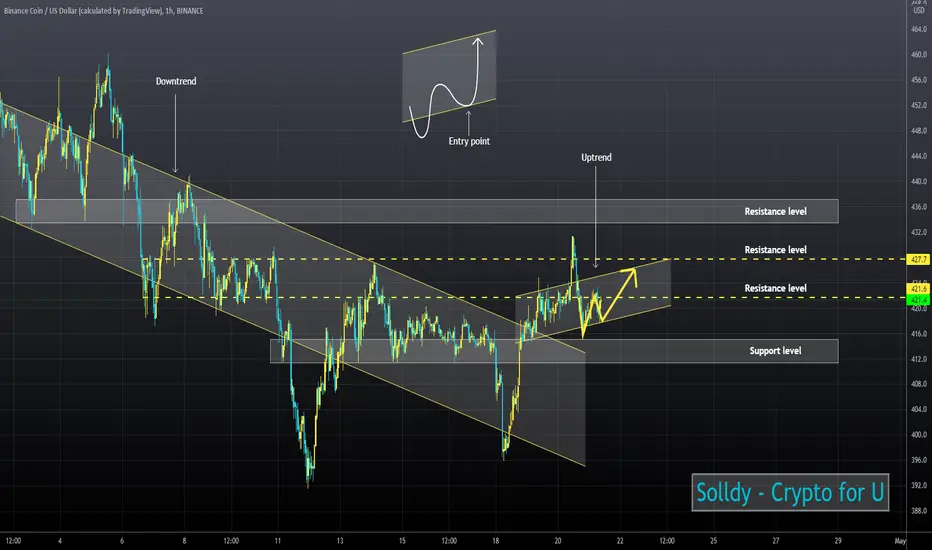
BNBUSD ❕ uptrend channelPrevious targets have been reached. The 50MA has now broken up the 200MA 1H Timeframe. The price is currently above liquidity, and the trading volumes were declining on the correction. During these moves, price formed an uptrend channel and tested its lower boundary. Now there was a fixing above the lower boundary, so I expect growth to the upper boundary of the channel.
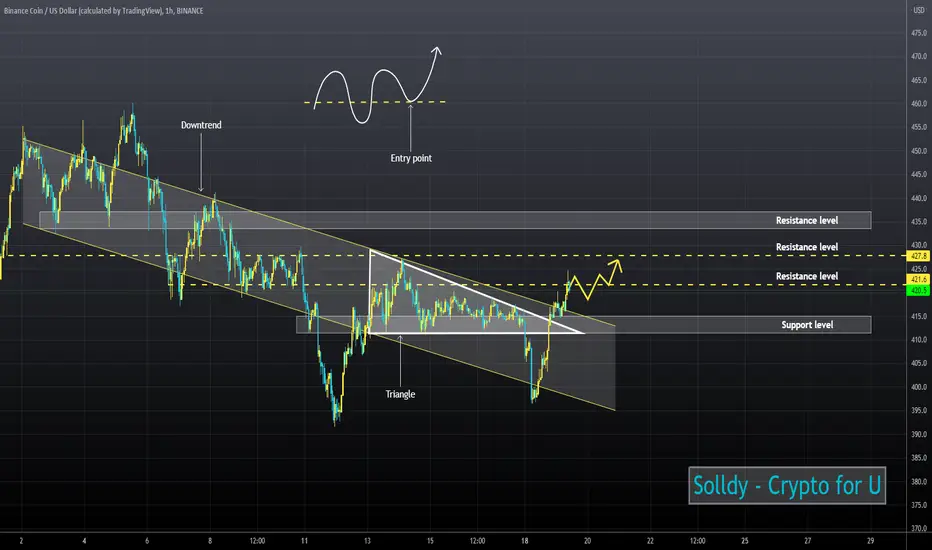
BNBUSD ❕ triangle breakoutBNB has held within the channel and is now above the liquidity level. The price broke through the downtrend and the Triangle pattern. I expect a retest of the resistance level and fixing above it, and then reaching the target indicated on the chart.
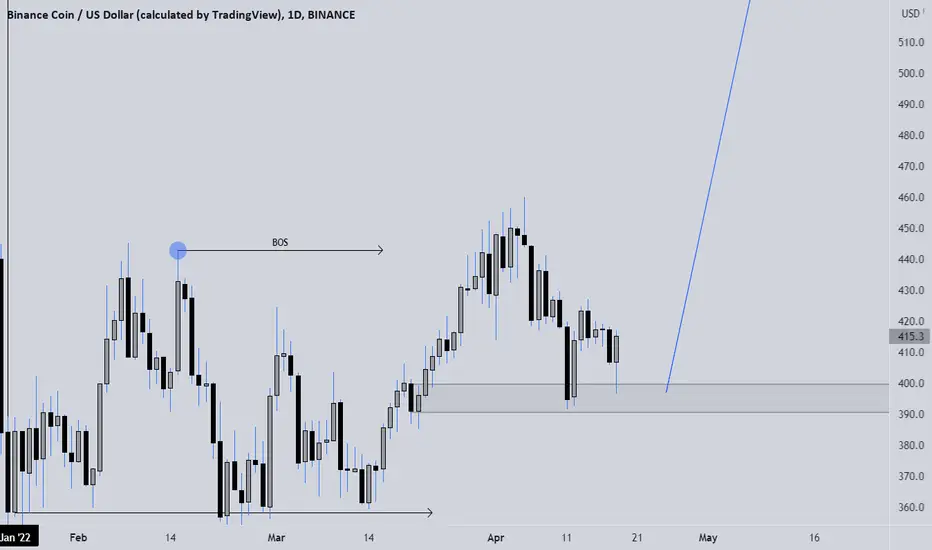
BNB Bearish Setup just like other Major CoinsShowing me the same setup as the other major coins. Don't fight Wyckoff. The best of the best follows Wyckoff. Should you?

BINANCE LONGS ACTIVE 📉📉📉Expecting bullish price action on BINANCE COIN as price is rejecting a bullish orderblock area on the H4, price shifted the market structure from bearish into bullish. For now i see only higher price action on this coin everything alligned with the fear/greed index that is in extreme fear.
What do you think ? Comment below..
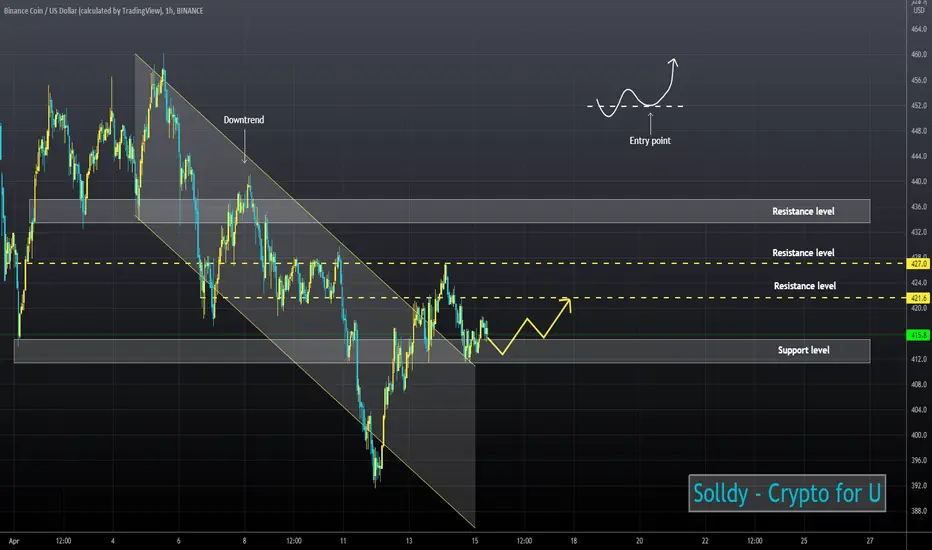
BNBUSD ❕ breakout downtrendThe last idea was successful and now the price has returned to the mirror support level. After breaking through the descending channel, the price is testing the 100MA on the 1H Timeframe. I expect a fixing above the support level and growth to the resistance level.
BINANCE LONGS ACTIVE 📉📉📉📉 Expecting bullish price action on BINANCE COIN as price shifted the market strucutre from bearish into bullish. Price retraced back after the market structur shift move into a bullish orderblock area that could act as a valuable area of ,,support,, if you will 410$ price area.
FEAR/GREED Index tells us that market is in a FEAR market sentiment meaning there is a buy opportunity.
What do you think ? Comment below..

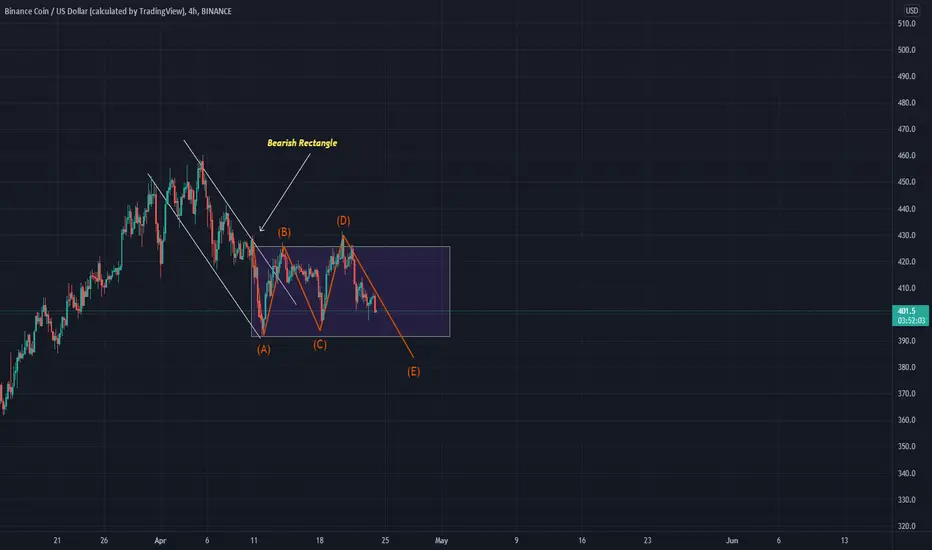
BNBUSD WAVE And Pattern Analysis The correctional structure, especially the three waves, whether in descending or ascending and pulse correction, indicates the formation of a diametric pattern.
This post is just a personal idea and analysis should not be the criterion for buying or selling
The last specified pattern is currently in a flat pattern. The structure is in high time and the whole chart is in the form of a diametric pattern. You can see the ascent from this area, but lower levels can be achieved

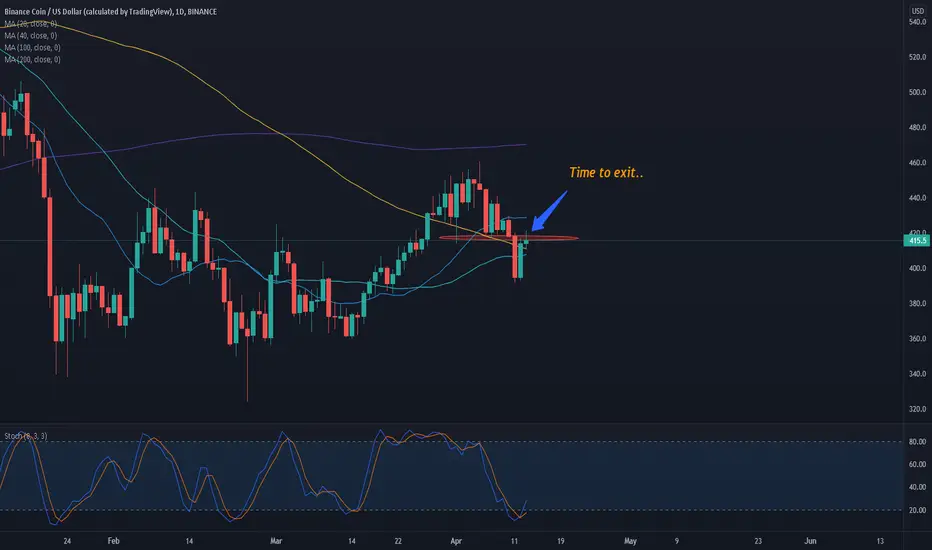
BNBUSD Exit ZoneIf you Took BNB long on my previous analysis.. It really is time to exit.
This is because we are hitting some early resistance. Remember, take gains over time and you will be profitable.. NO need to keep guessing.
Short lightly if confident enough.
BNBUSD Long ZonesBNB holds a current Long setup feeding right into the Pro Traders Plan..
We like to take LONG trades in uptrend. It really does help out..
Trade lightly and use DCA where necessary..

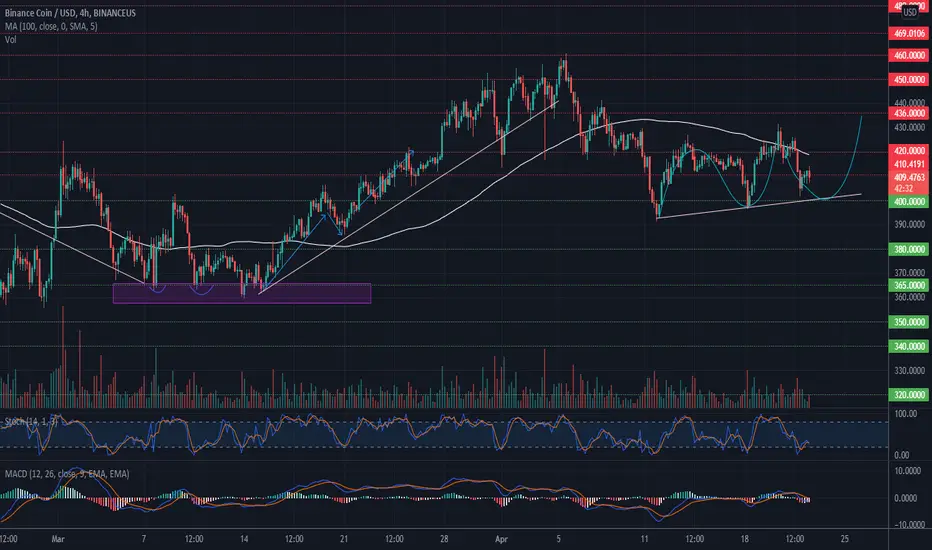
BNBUSD ❕ support at the $400 levelThe previous patterns worked out successfully, after which the price entered the channel and then corrected to an important support level. In the current situation there is no need to rush. There are no serious arguments for decrease, but also growth can be not soon. I expect fixing above the resistance level and reach of the first target on the chart.
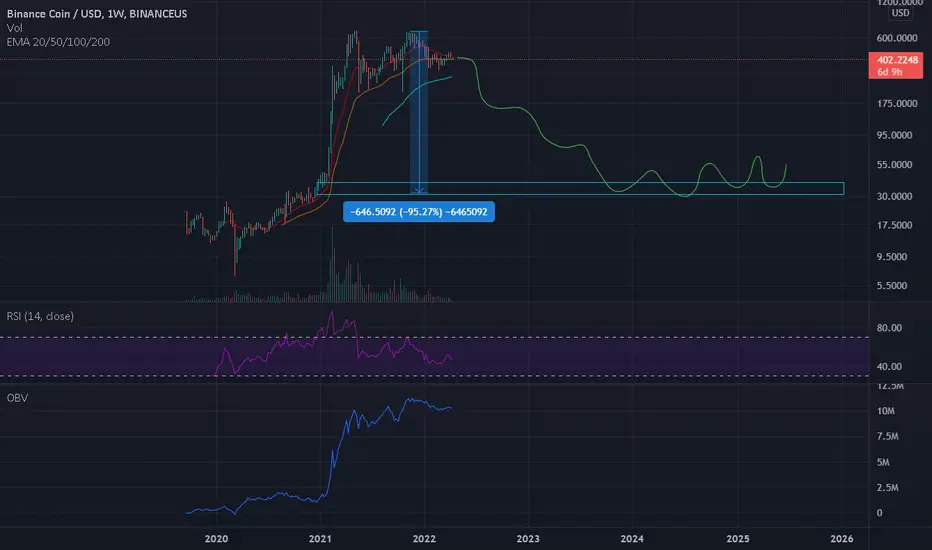
BNB-95% scenario
would be a painful run if we did the 3yr bearmarket
but would come with incredible opportunity as always if we recapitulate like the last cycles
Binance Coin Price Analysis — April 11Binance Coin (BNB) has come under intense bearish pressure as the cryptocurrency nears the $400 critical support amid a pronounced bearish tone in the broader market.
After defending the $420 support for over two days, BNB bulls threw in the towel at the opening of Asian markets on Sunday, which flooded the market with fresh bears. The fourth-largest cryptocurrency currently trades around the $402 level, its lowest point in three weeks, as bears aim for lower.
That said, the $400 support line will play a crucial role for BNB bulls, as it is the last defense before the $370 region.
Meanwhile, my resistance levels are $410, $420, and $436, and my support levels are $400, $380, and $370.
Total Market Capitalization: $1.89 trillion
Binance Coin Market Capitalization: $66.8 billion
Binance Coin Dominance: 3.5%
Market Rank: #4
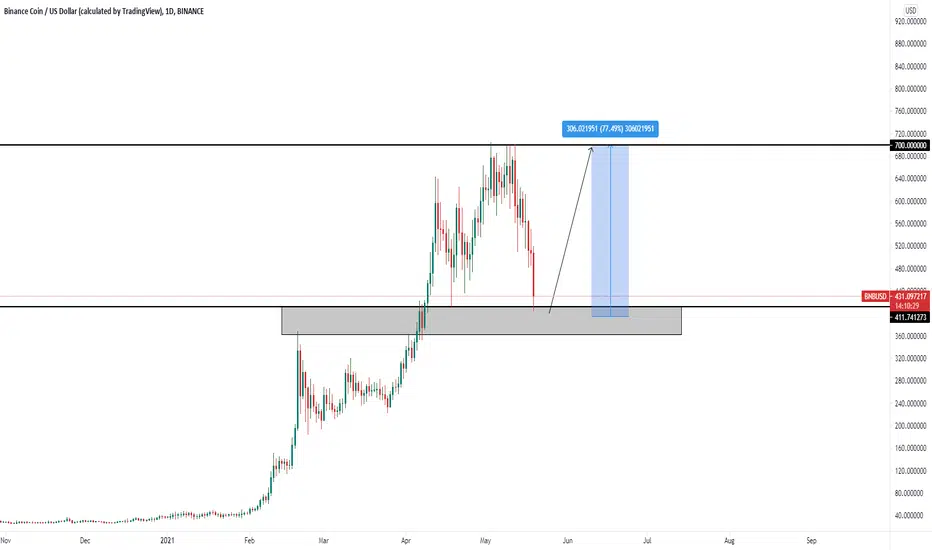
BNB/USDT 103,134,742 BUSD (103,134,742 USD) burned at Binance.BE careful.after every BNB burning processe short term bearish and long term bullish.
This could be the next long term bullish market
After long time.This time BNB will go to new ATH.this only my opinion.trade with your own
Analytics.
$BNB - Hints At Bullish Reversal - Shapes mean nothing *Smart $"*SMT = Smart Money Theory = everything you think that is not retail related to trading. First, SMT does not believe that triangles, wedges, trendlines, channels, harmonics, etc. has any effect on how price reacts. I'm Sorry but you won't convince me that Bitcoin knows it has created a triangle and that it knows how to react from that? Nah, it remembers price levels, that's it. The second is to recognize that the price is not random, it is set by an algorithm controlled by those that control the asset. The Third thing to remember is price will move toward attacking where there is Liquidity (Equal Highs, Equasl Lows, phantom Trendlines etc.) and Balance (Fair Value Gaps, Liquidity Voids.) That's the basics. The rest is very unique in the vocabulary you need to have and the concepts that wrap around these ideas.
As for the BNBUSD chart, It seems as if the current state of the chart has fulfilled a 4-hour fair value gap. It has created sell-side liquidity to attack which is why I believe it will go lower towards equal lows. Additionally, if y9u put a Fib on it, The "Discounted" area doesn't begin until gets below the equal lows. I personally have an entry at the median of hourly Bullish Order Block which is about 358-359. However, it could easily get into and fill the 4 hour fair value gap which is the yellow rectangle area between 345 and 354. After that I see more consolidation and eventually the run-ups to fill gaps and voids like the area near 378-385 up to a bearish order block at 454. Just my two cents, we shall see what the chart pushers want to do with that chart.
I personally shorted it at 374 and currently at 371.42. Crossing my fingers it goes as planned
Good luck traders :)
