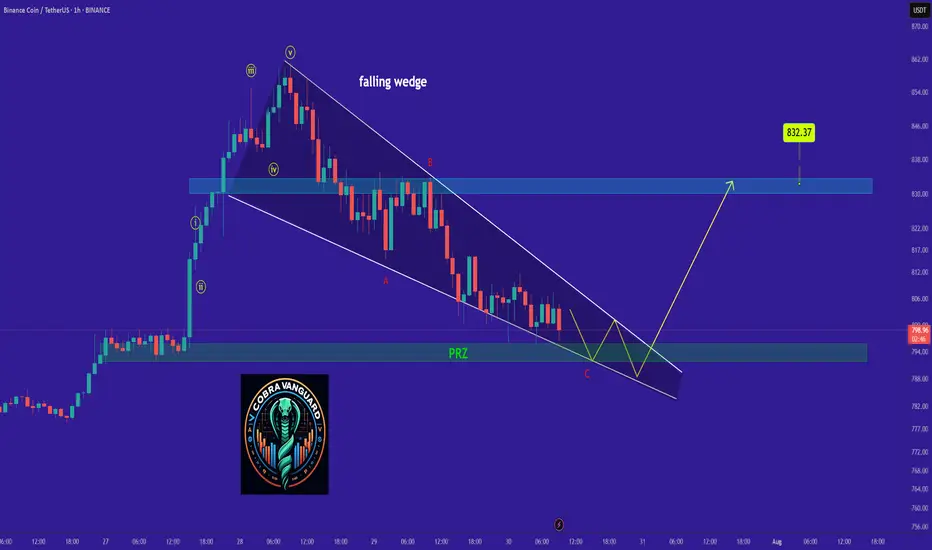
BNB's Situation (1h) !!!The BNB is in a Bullish phase by a Falling Wedge Pattern.
A falling wedge indicates the potential for price to reach to $830.
Note if the PRZ ZONE is broken downwards with the strength of Bearish candles , this analysis of ours will be failed.
Best regards CobraVanguard.💚
Related pairs
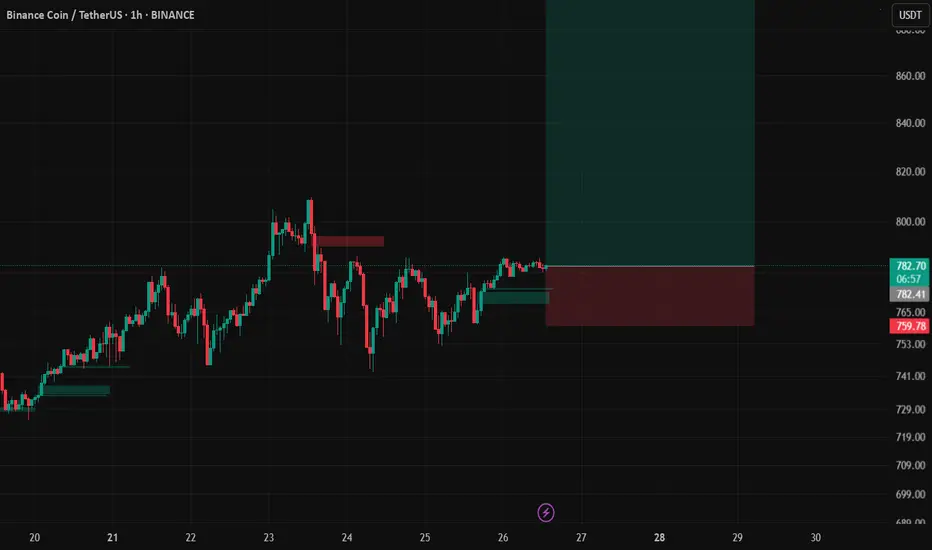
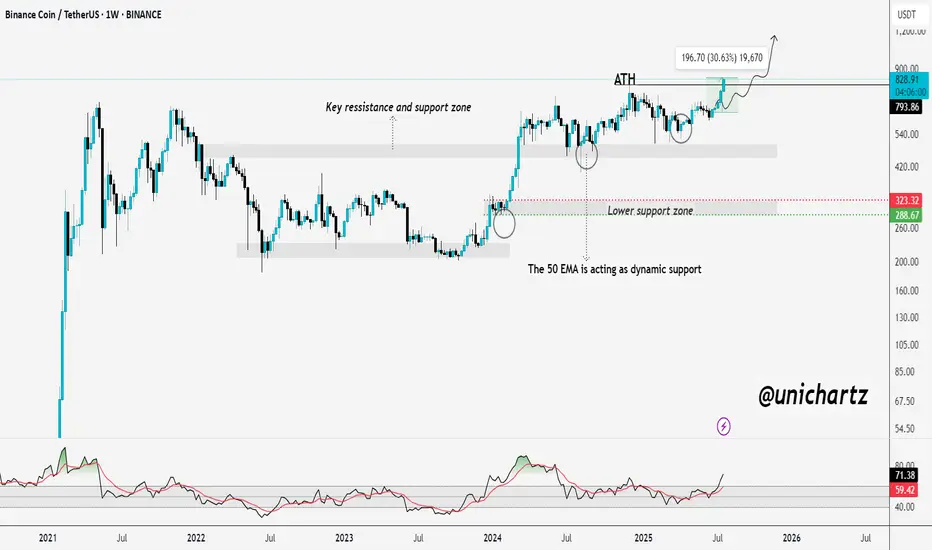
BNBUSDT - New ATH!"The strongest resistance level on the chart has just been broken — which was represented by the previous ATH — after nearly four attempts.
This exact pattern occurred before in 2021, and what followed was a parabolic rally.
The same scenario is unfolding now!
You’ll soon see BNB trading in four

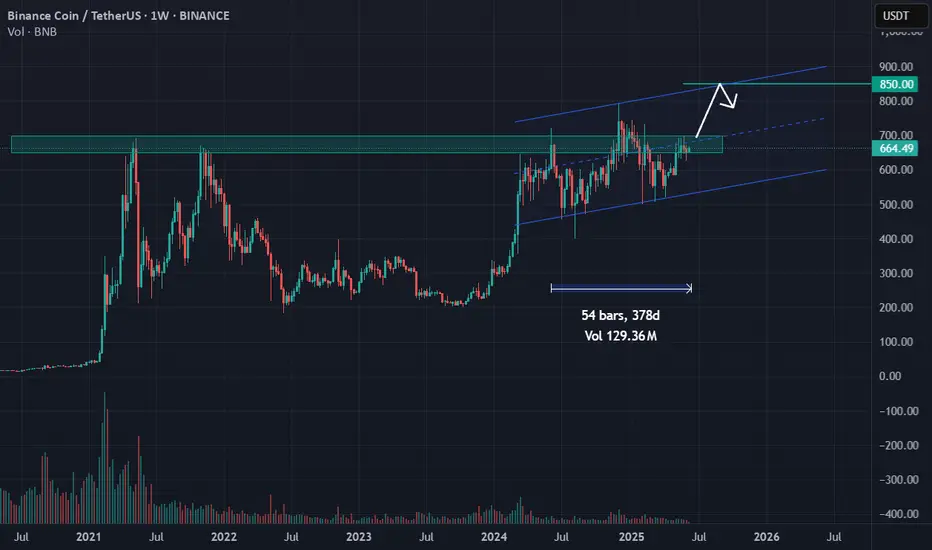
BNB 5 RR upside HVFBNB 5 RR upside HVF - continuation patterns over and over on BNB. Seeking the 900 mark after an 800$ break and new setup with fractals.
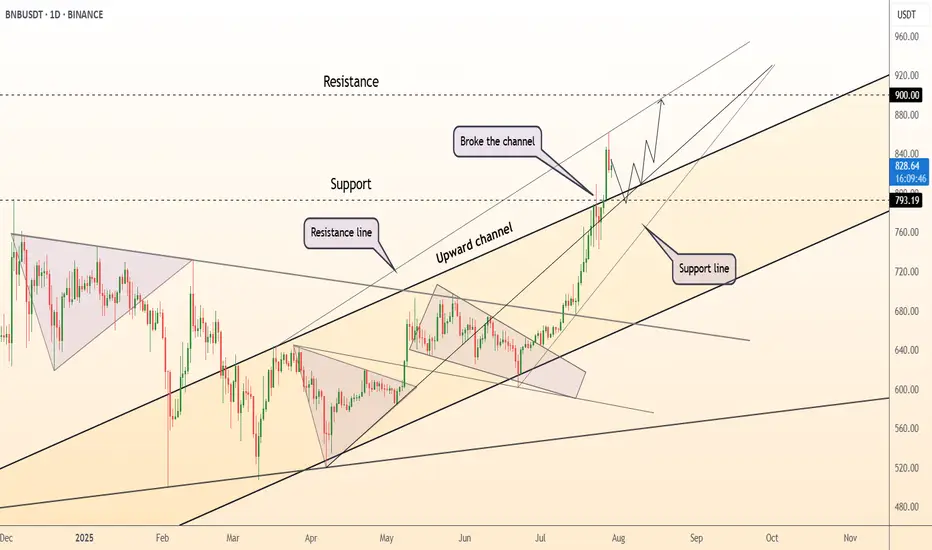
DeGRAM | BNBUSD broke the channel📊 Technical Analysis
● Daily candle closed back above the long-term median of the black rising channel after piercing the May-to-July grey resistance fan — a textbook “break-retest” that shifts the line into support at $793.
● Structure remains a staircase of higher-lows; the present pull-back is
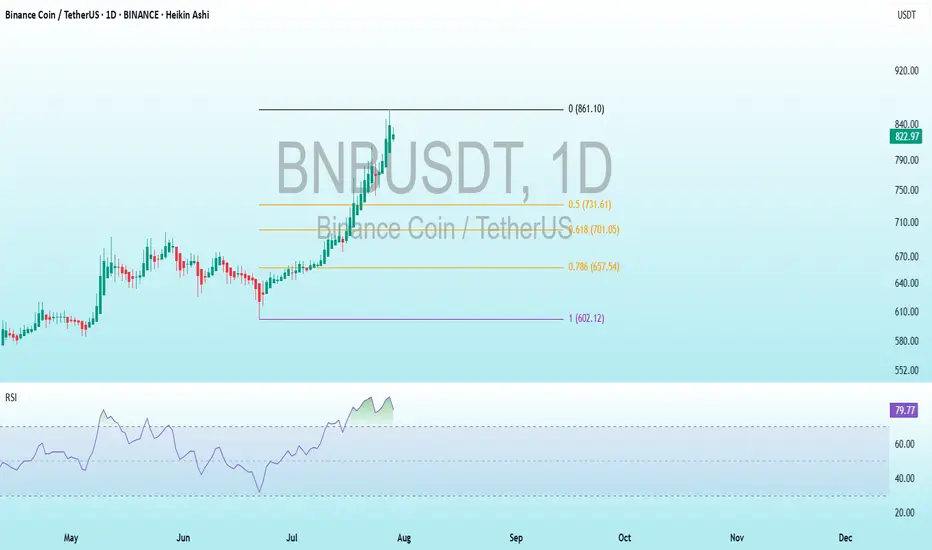
BNB Bearish DivergenceBINANCE:BNBUSDT
Trade Setup:
Target 1: 731.61 (0.50 Fibonnaci Golden Zone).
Target 2: 701.05 (0.618 Fibonnaci Golden Zone).
Target 3: 657.54 (0.786 Fibonnaci Golden Zone).
Target 4: 602.12 (1 Fibonnaci).
Stop Loss: 861.10 (above recent high, ~25% above current price).
RSI Analysis: The RSI show
BNB - Challenging chart to analyzeBINANCE:BNBUSDT CRYPTOCAP:BNB CRYPTOCAP:BNB.D
Technical analysis :
BNB is one of the most challenging charts to analyze. I will try to decypher the hidden patterns.
The BNB was in accumulation range for more than 1 year. The blue parallele channel limits the price movement.
Today, BNB is tr
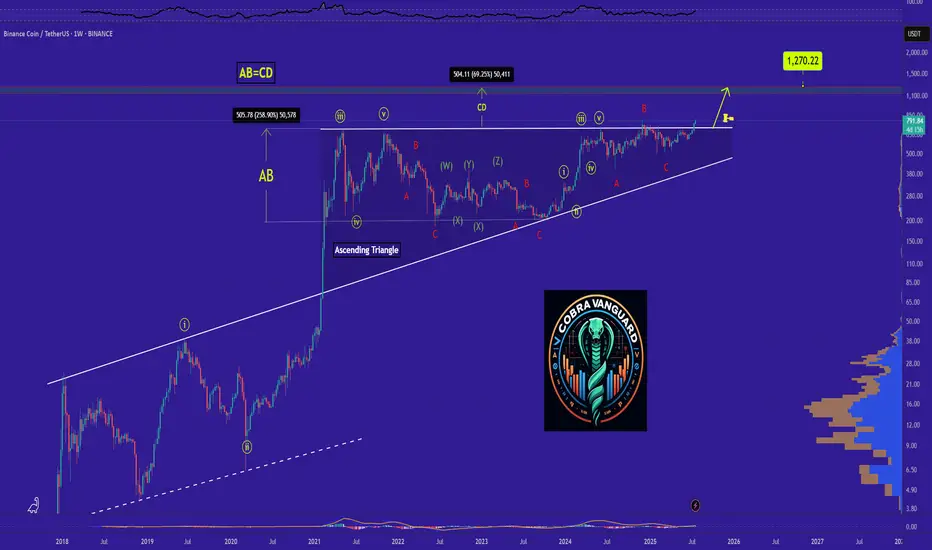
Why BNB Remains Bullish and Its Next Potential Move !Currently,is forming an ascending triangle, indicating a potential price increase. It is anticipated that the price could rise, aligning with the projected price movement (AB=CD).
previous analysis
Stay Awesome , CobraVanguard.
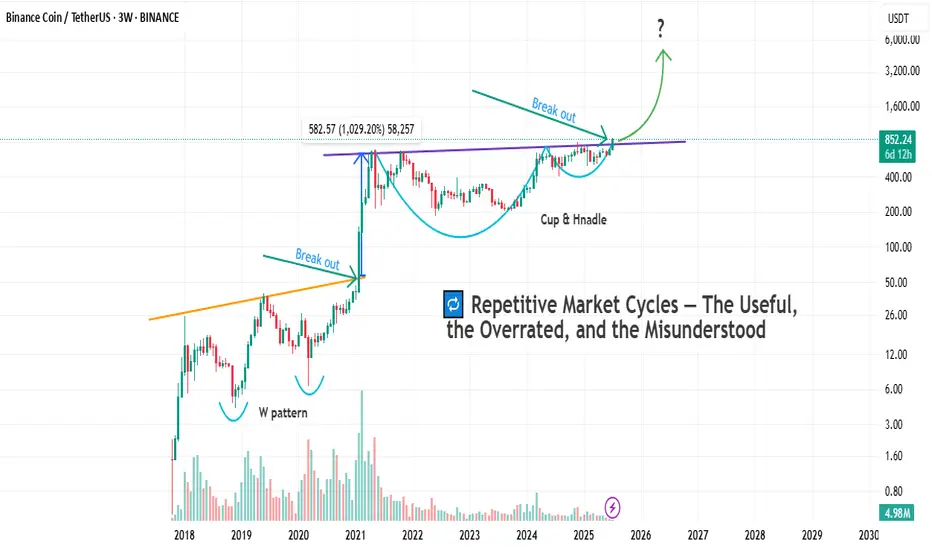
Cycles Don’t Lie — But Which One Speaks Here ?Markets love to repeat themselves.
But just because something repeats, doesn’t mean it’s predictable — or useful.
Let’s break down the main types of market cycles that traders talk about, and more importantly, let’s call out their flaws. No sugarcoating.
🔹 1. Time Cycles
These are based on the id
BNB Breaks ATH – Just Like I PredictedBNB ATH Breakout – Just As Predicted 🚀
A few days ago, I said it loud and clear:
"Mark my words — BNB will not only retest its ATH but break it and go beyond before the year ends."
Well... today, it happened.
BNB just smashed through its previous ATH and printed a new all-time high, exactly as c
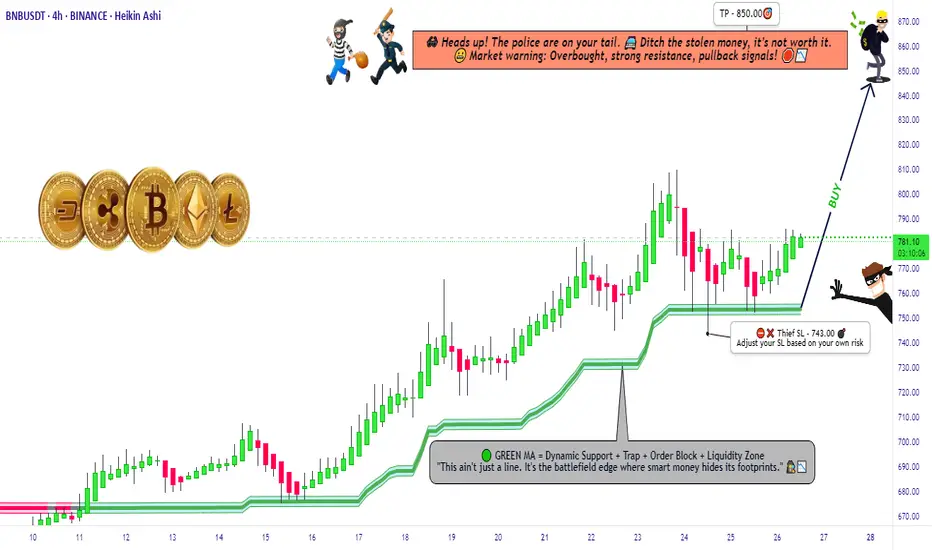
"BNB Primed for a Pump – Thief Trading Mode Activated!"🚨 BNB/USDT HEIST PLAN – SWIPE THE BULLISH LOOT BEFORE COPS ARRIVE! 🚨
🌟 Attention, Money Makers & Market Robbers! 🌟
(Hola! Oi! Bonjour! Hallo! Marhaba!)
The BNB/USDT vault is CRACKED OPEN—time to execute the ultimate heist! 🏦💰 Based on 🔥Thief Trading Style Analysis🔥, here’s your lucrative robbery
See all ideas
Summarizing what the indicators are suggesting.
Oscillators
Neutral
SellBuy
Strong sellStrong buy
Strong sellSellNeutralBuyStrong buy
Oscillators
Neutral
SellBuy
Strong sellStrong buy
Strong sellSellNeutralBuyStrong buy
Summary
Neutral
SellBuy
Strong sellStrong buy
Strong sellSellNeutralBuyStrong buy
Summary
Neutral
SellBuy
Strong sellStrong buy
Strong sellSellNeutralBuyStrong buy
Summary
Neutral
SellBuy
Strong sellStrong buy
Strong sellSellNeutralBuyStrong buy
Moving Averages
Neutral
SellBuy
Strong sellStrong buy
Strong sellSellNeutralBuyStrong buy
Moving Averages
Neutral
SellBuy
Strong sellStrong buy
Strong sellSellNeutralBuyStrong buy
Displays a symbol's price movements over previous years to identify recurring trends.
Curated watchlists where BNBUSDT is featured.
Interest-earning crypto wallets: Put your digital money to work
12 No. of Symbols

Proof of Stake: Seeking validation?
26 No. of Symbols
See all sparks
Frequently Asked Questions
The current price of Binance Coin / TetherUS (BNB) is 753.92 USDT — it has risen 1.47% in the past 24 hours. Try placing this info into the context by checking out what coins are also gaining and losing at the moment and seeing BNB price chart.
Binance Coin / TetherUS price has fallen by −2.18% over the last week, its month performance shows a 16.46% increase, and as for the last year, Binance Coin / TetherUS has increased by 31.07%. See more dynamics on BNB price chart.
Keep track of coins' changes with our Crypto Coins Heatmap.
Keep track of coins' changes with our Crypto Coins Heatmap.
Binance Coin / TetherUS (BNB) reached its highest price on Jul 23, 2025 — it amounted to 809.84 USDT. Find more insights on the BNB price chart.
See the list of crypto gainers and choose what best fits your strategy.
See the list of crypto gainers and choose what best fits your strategy.
Binance Coin / TetherUS (BNB) reached the lowest price of 0.50 USDT on Nov 6, 2017. View more Binance Coin / TetherUS dynamics on the price chart.
See the list of crypto losers to find unexpected opportunities.
See the list of crypto losers to find unexpected opportunities.
The safest choice when buying BNB is to go to a well-known crypto exchange. Some of the popular names are Binance, Coinbase, Kraken. But you'll have to find a reliable broker and create an account first. You can trade BNB right from TradingView charts — just choose a broker and connect to your account.
Crypto markets are famous for their volatility, so one should study all the available stats before adding crypto assets to their portfolio. Very often it's technical analysis that comes in handy. We prepared technical ratings for Binance Coin / TetherUS (BNB): today its technical analysis shows the buy signal, and according to the 1 week rating BNB shows the buy signal. And you'd better dig deeper and study 1 month rating too — it's buy. Find inspiration in Binance Coin / TetherUS trading ideas and keep track of what's moving crypto markets with our crypto news feed.
Binance Coin / TetherUS (BNB) is just as reliable as any other crypto asset — this corner of the world market is highly volatile. Today, for instance, Binance Coin / TetherUS is estimated as 2.68% volatile. The only thing it means is that you must prepare and examine all available information before making a decision. And if you're not sure about Binance Coin / TetherUS, you can find more inspiration in our curated watchlists.
You can discuss Binance Coin / TetherUS (BNB) with other users in our public chats, Minds or in the comments to Ideas.