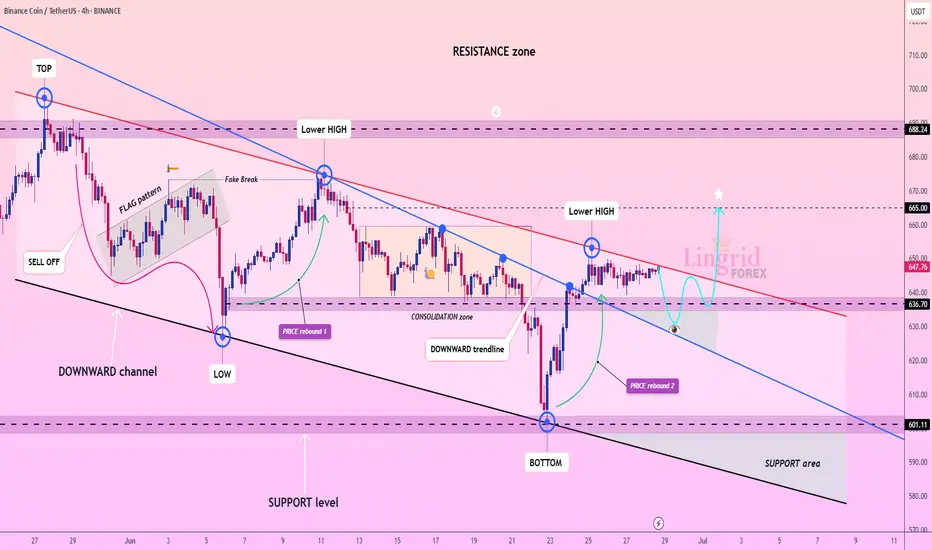
Lingrid | BNBUSDT breakout Setup. Preparing for Bullish Surge? BINANCE:BNBUSDT is facing strong resistance below the red descending trendline, repeatedly forming lower highs as it struggles to break above 650. The price is coiling between the 636 and 648 zones, hinting at a potential breakout or breakdown move. A clean rejection could drag price back to the 60
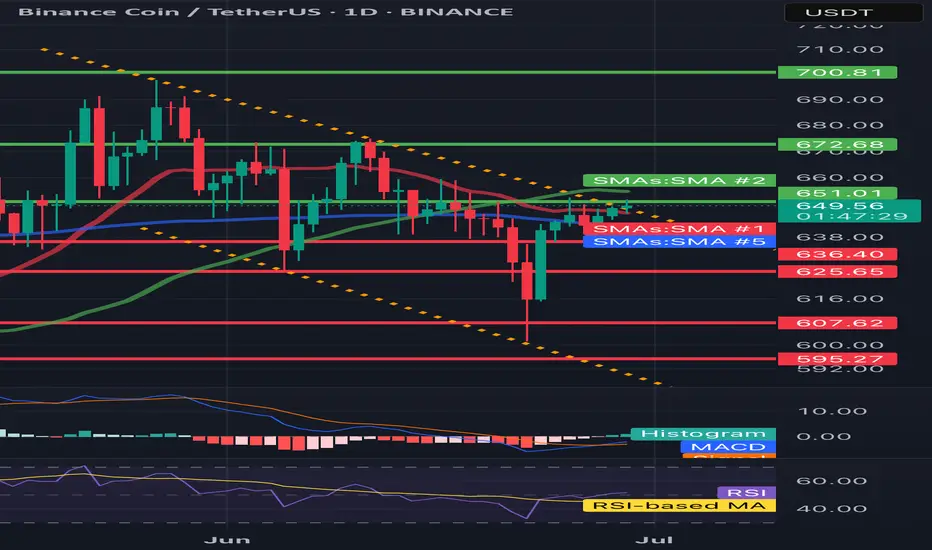
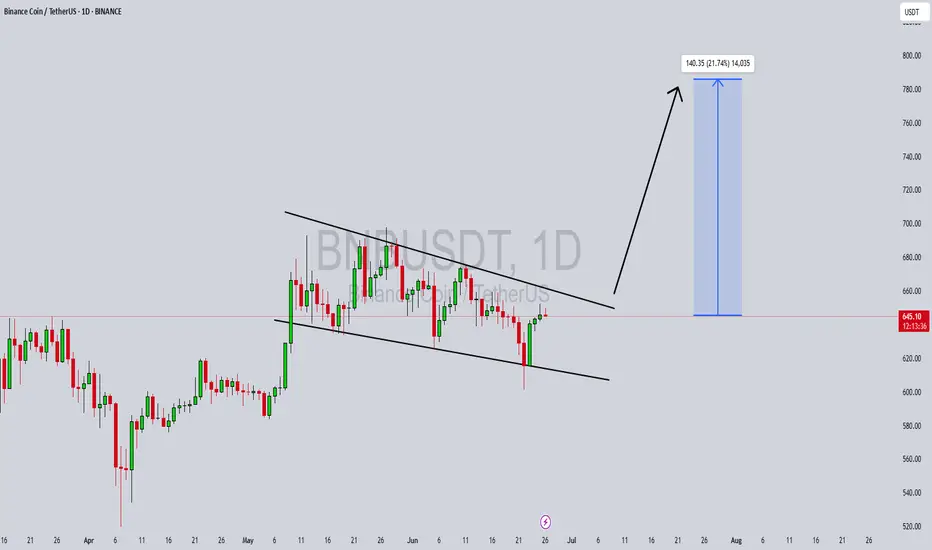
BNB/USDT 1D🕵️♂️ General context
• Steam: BNB/USDT
• Price: 649.52 USDT
• Time: 1D (daily interval)
• Currently, the reflection is underway after the inheritance, but the technical situation remains uncertain.
⸻
📈 Trend and market structure
• You can see a previous strong drop (visible long red c
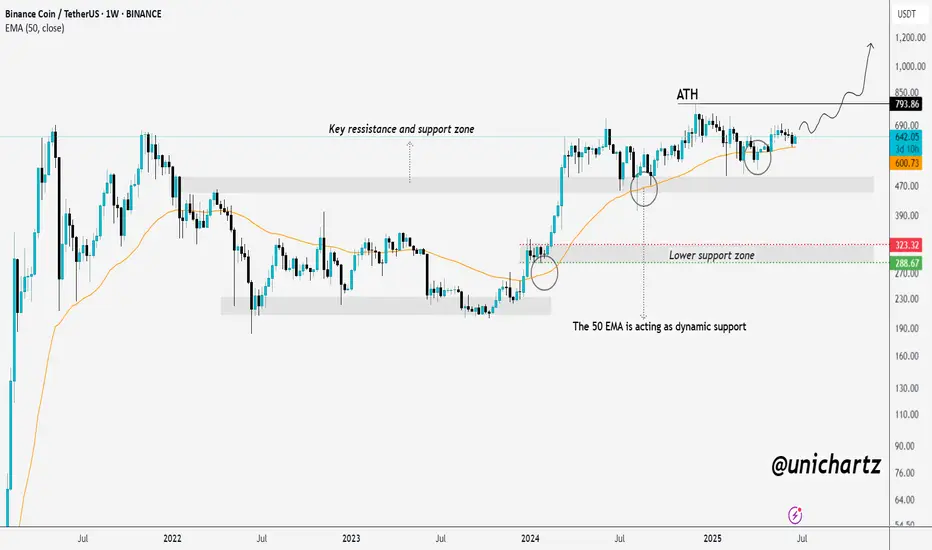
BNB to Make History Before 2026 BeginsCRYPTOCAP:BNB is setting up for something big. Price is holding strong above the rising support line, with the 50 EMA acting as dynamic support.
It's consolidating just below the all-time high — a classic sign of strength. Structure looks solid, momentum is building, and the chart favors bulls.
Does anyone trade this at all?⚡️ Hello, everyone! I decided to do a review of BNB. It's practically a stablecoin. But does the token have any potential other than being used for airdrops on Binance? Let's find out!
BNB has now closed the gap above, and now there is a large gap below at the $556 - $499 levels. And as we know, 99
BNBUSDT Forming Bullish Wave BNBUSDT is forming a promising bullish wave pattern that suggests a potential continuation of the upward trend in the short to mid-term. The structure is supported by consistent volume, indicating strong participation and interest from traders and investors. The price action reflects healthy higher
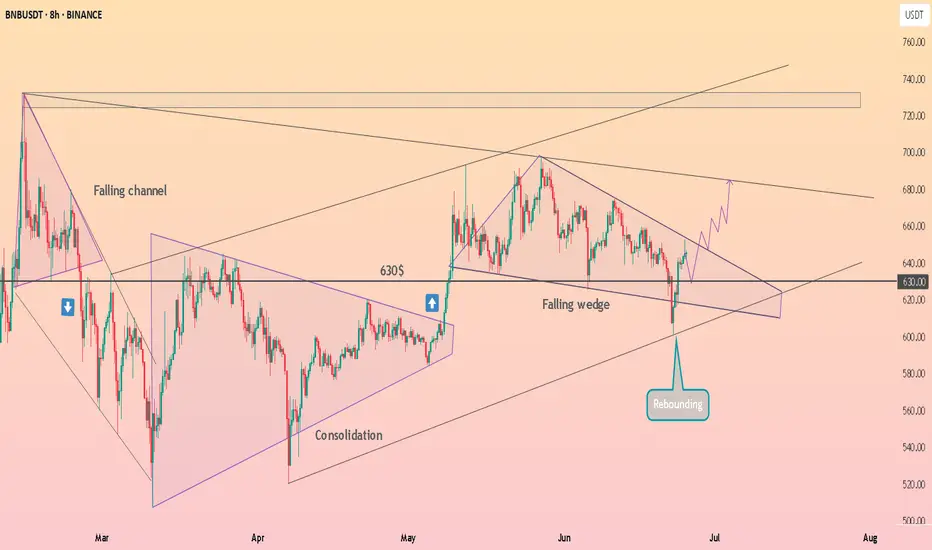
HolderStat┆BNBUSD forming the falling wedgeBINANCE:BNBUSDT on the 8h chart rebounded from a falling wedge and reclaimed the $630 support. Price structure shows growing strength as it aims for $680 next. Watch for a breakout confirmation to ignite a push toward $740.
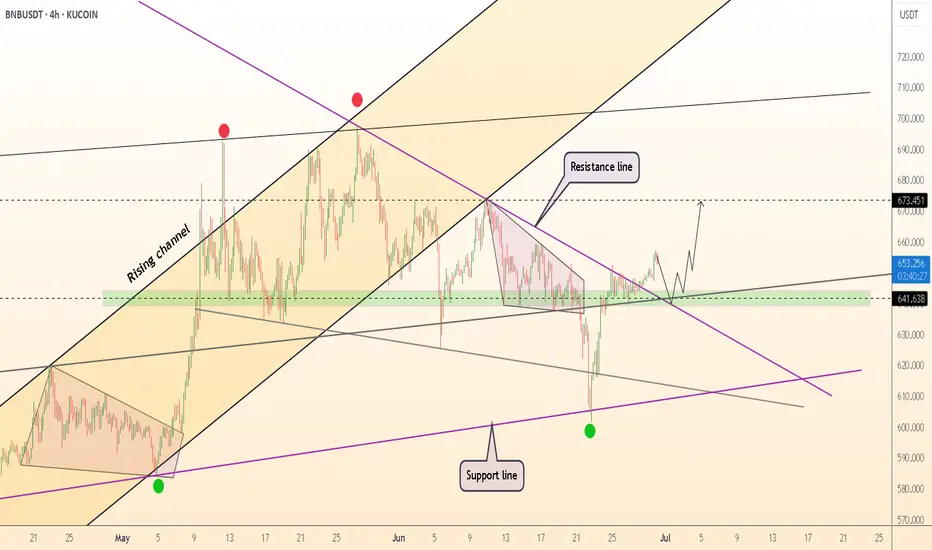
DeGRAM | BNBUSD broke the resistance line📊 Technical Analysis
● Breakout: price pierced the purple descending resistance, retested it and the green $641-648 demand cluster, then bounced—confirming the breakout as valid support.
● Rising channel intact; higher-low sequence points to the mid-band confluence at $673. A measured move from th
BNB wait for entry
BNB has been consolidating around its current weekly support level for over a year.
Such prolonged consolidation often precedes a significant breakout. Accumulating at this key support zone could present a strong opportunity for long-term positioning.
For short-term trades, it’s best to patiently

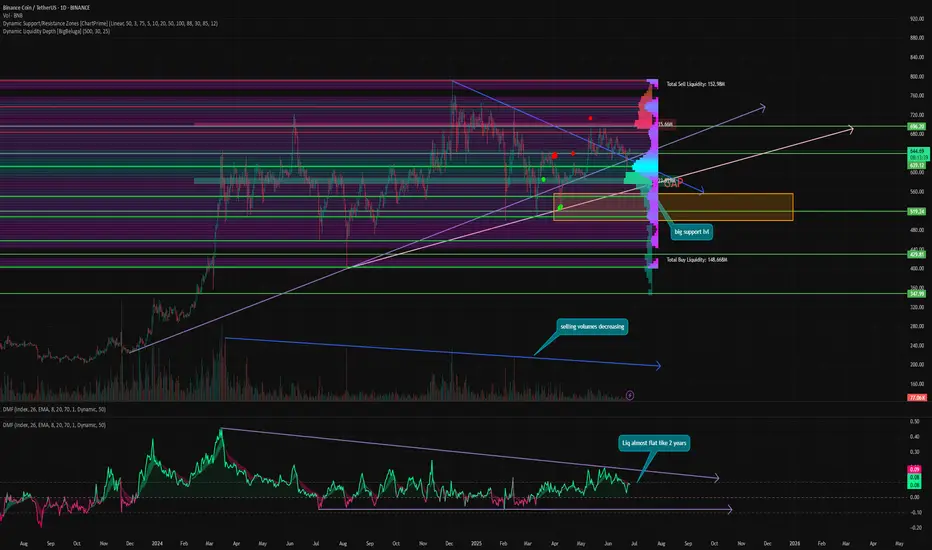
BNB Analysis (Crypto)Here is my analysis on BNB, the native token of Binance. I'll be using ICT concepts, primarily liquidity, efficiency, PD Arrays, and premium/discount/OTE.
Hope you find it insightful in knowing where price is going to go!
- R2F Trading

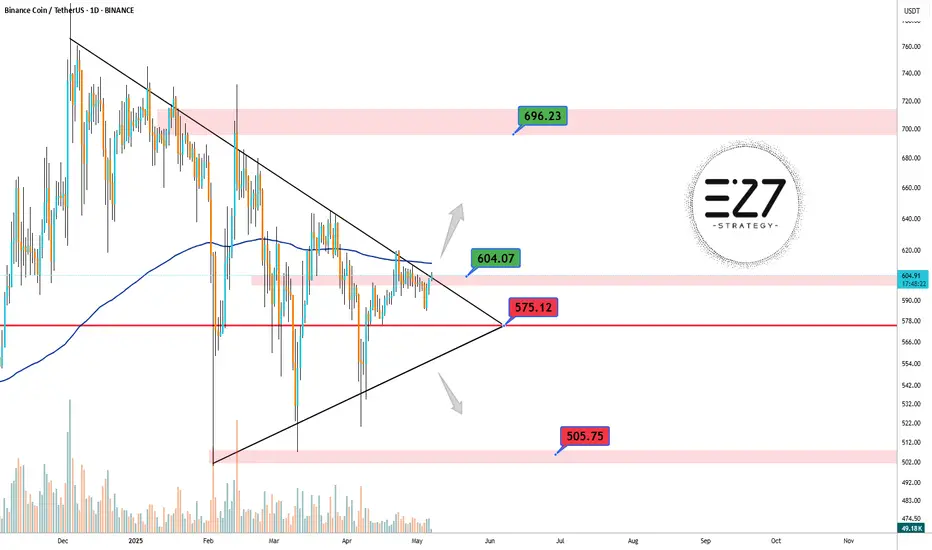
BNB Pump???On the daily chart of BNB, a symmetrical triangle has formed, and the price is approaching a breakout point. The $600–$604 zone, aligned with the 200-day moving average and the descending trendline, acts as a key resistance. A bullish breakout could push the price toward the $696 area. On the downsi
See all ideas
Summarizing what the indicators are suggesting.
Oscillators
Neutral
SellBuy
Strong sellStrong buy
Strong sellSellNeutralBuyStrong buy
Oscillators
Neutral
SellBuy
Strong sellStrong buy
Strong sellSellNeutralBuyStrong buy
Summary
Neutral
SellBuy
Strong sellStrong buy
Strong sellSellNeutralBuyStrong buy
Summary
Neutral
SellBuy
Strong sellStrong buy
Strong sellSellNeutralBuyStrong buy
Summary
Neutral
SellBuy
Strong sellStrong buy
Strong sellSellNeutralBuyStrong buy
Moving Averages
Neutral
SellBuy
Strong sellStrong buy
Strong sellSellNeutralBuyStrong buy
Moving Averages
Neutral
SellBuy
Strong sellStrong buy
Strong sellSellNeutralBuyStrong buy
Displays a symbol's price movements over previous years to identify recurring trends.
Curated watchlists where BNBUSDT.P is featured.
Interest-earning crypto wallets: Put your digital money to work
12 No. of Symbols
Proof of Stake: Seeking validation?
26 No. of Symbols
See all sparks