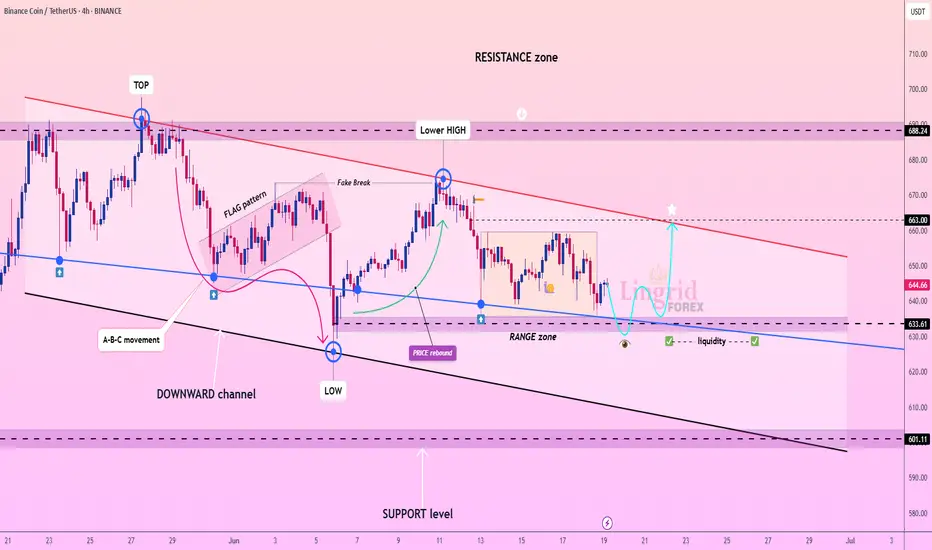
Lingrid | BNBUSDT buying Opportunity in Consolidation PhaseBINANCE:BNBUSDT is forming a reactive base inside the lower boundary of its descending channel, just above the 633 support zone. The current range structure suggests consolidation, with a potential for a false breakdown before an upward move. A breakout through the red descending trendline could t
BNB/USDT: Poised for a Bullish Rebound?BNB/USDT: Poised for a Bullish Rebound?
BNB has tested the 640 support zone for the third time in recent days, signaling potential strength in this area.
This level may mark the bottom of the ongoing bearish correction, with signs pointing to a possible upward movement in the coming days, as ref

BNB wait for entry
BNB has been consolidating around its current weekly support level for over a year.
Such prolonged consolidation often precedes a significant breakout. Accumulating at this key support zone could present a strong opportunity for long-term positioning.
For short-term trades, it’s best to patiently

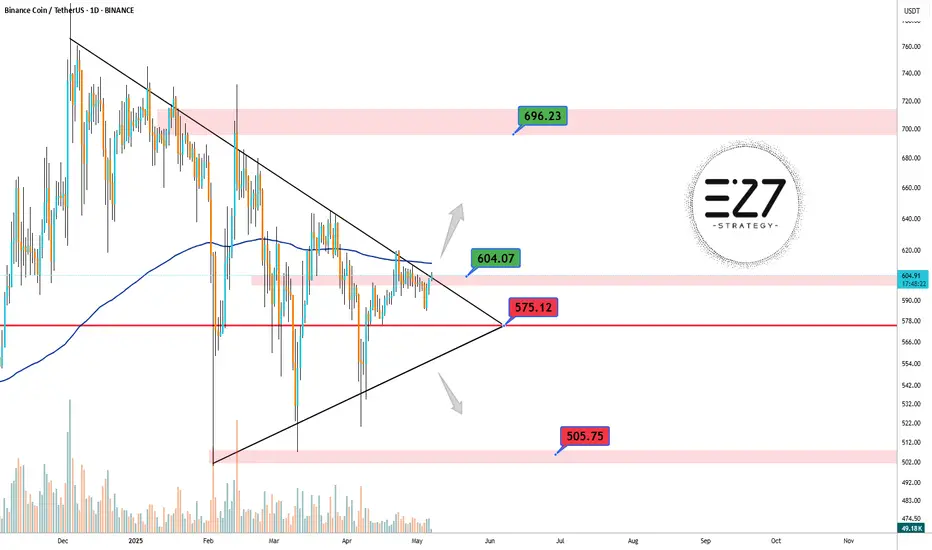
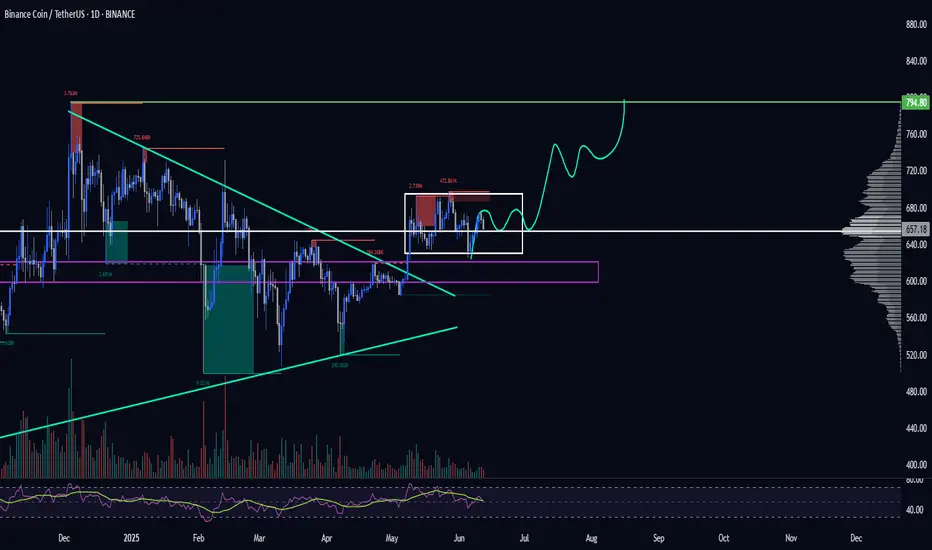
BNB Pump???On the daily chart of BNB, a symmetrical triangle has formed, and the price is approaching a breakout point. The $600–$604 zone, aligned with the 200-day moving average and the descending trendline, acts as a key resistance. A bullish breakout could push the price toward the $696 area. On the downsi
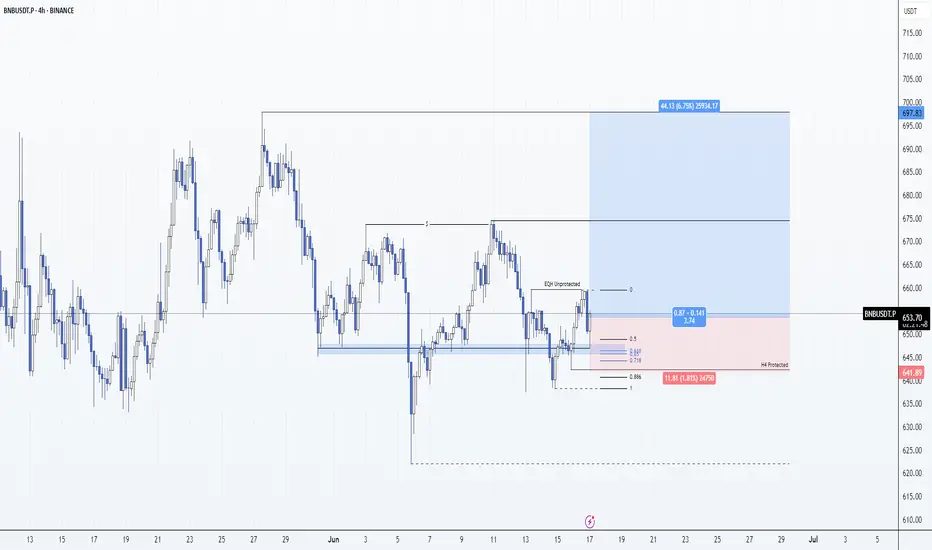
BNB: Long 17/06/25Trade Direction:
BNB Long BINANCE:BNBUSDT.P BINANCE:BNBUSDT
Risk Management:
- Risk set at approx 0.5%
Reason for Entry:
- Retrace into higher timeframe support marked
- Structure remains valid
- Unprotected equal highs DOL
- 0.5 retrace
- H1 and M30 oversold H4 Showing strength
- Banking on
BNBthe BNB weekly chart shows lack of genuine directional bias ,its best to allow the market make clear direction .
On the the weekly demand floor ,price can make a surprise visit and activate a buy.
The green buy and sell zone will be watched for potential reaction especially on the ATL AND DTL LEVEL

BNB Analysis (Crypto)Here is my analysis on BNB, the native token of Binance. I'll be using ICT concepts, primarily liquidity, efficiency, PD Arrays, and premium/discount/OTE.
Hope you find it insightful in knowing where price is going to go!
- R2F Trading

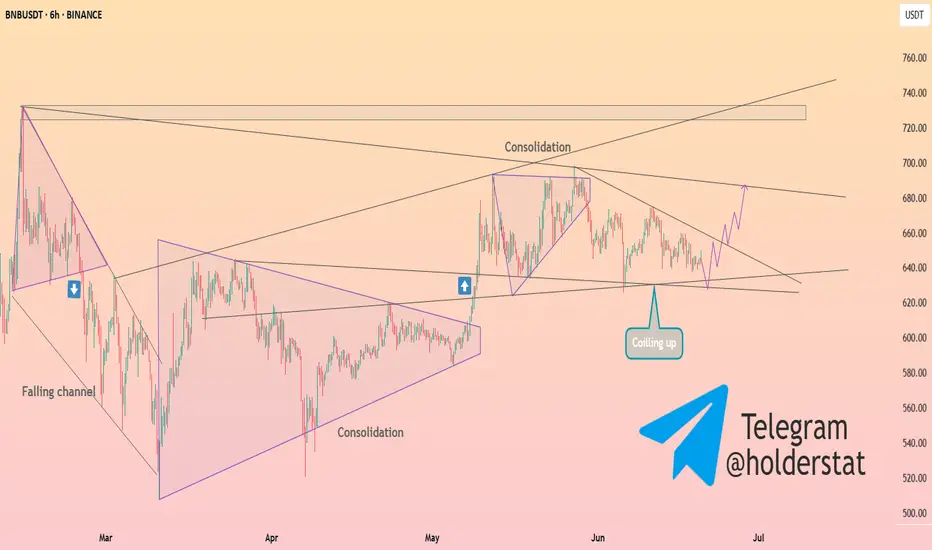
HolderStat┆BNBUSD coiling up for a breakoutBINANCE:BNBUSDT has emerged from a falling channel and entered a phase of consolidation, with price action now coiling up for a potential breakout. The chart shows a series of higher lows, and the current structure is forming a bullish pennant. The price is holding above key support, and the techni
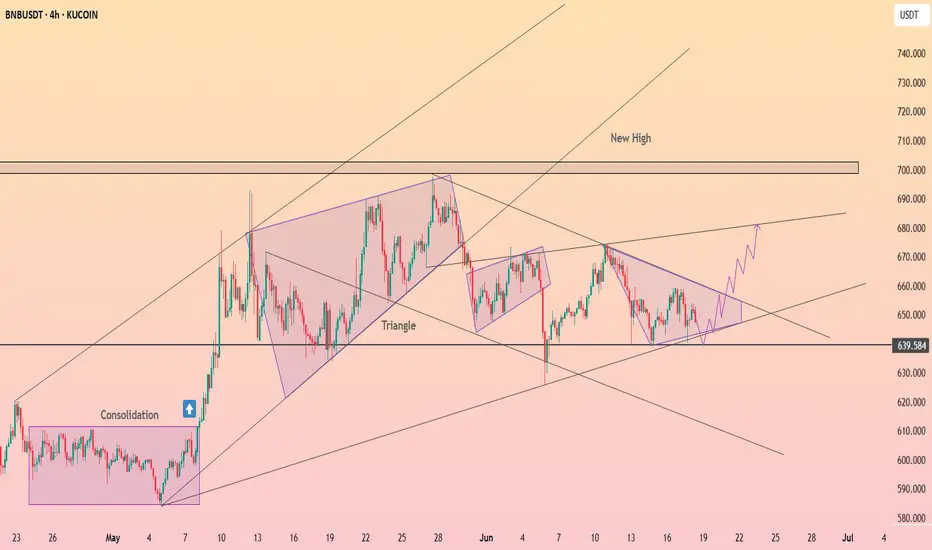
HolderStat┆BNBUSD held supportKUCOIN:BNBUSDT keeps coiling inside a contracting wedge above the $639 launchpad. A 4-h close over 650-655 can spark a thrust to 680 and revive the 700–710 “new-high” box; slip-back under 630 delays the breakout but leaves the structure intact 🚀
BNB 1D Ready to Explode? This Chart Says YES. 06/12/25BINANCE:BNBUSDT is forming a tight consolidation right below key resistance at $710, inside a triangle structure. Every dip into the $655–$625 support zone gets quickly bought up — showing strong buyer interest and accumulation.
Price is compressing inside the triangle with higher lows, indicating
See all ideas
Summarizing what the indicators are suggesting.
Oscillators
Neutral
SellBuy
Strong sellStrong buy
Strong sellSellNeutralBuyStrong buy
Oscillators
Neutral
SellBuy
Strong sellStrong buy
Strong sellSellNeutralBuyStrong buy
Summary
Neutral
SellBuy
Strong sellStrong buy
Strong sellSellNeutralBuyStrong buy
Summary
Neutral
SellBuy
Strong sellStrong buy
Strong sellSellNeutralBuyStrong buy
Summary
Neutral
SellBuy
Strong sellStrong buy
Strong sellSellNeutralBuyStrong buy
Moving Averages
Neutral
SellBuy
Strong sellStrong buy
Strong sellSellNeutralBuyStrong buy
Moving Averages
Neutral
SellBuy
Strong sellStrong buy
Strong sellSellNeutralBuyStrong buy
Displays a symbol's price movements over previous years to identify recurring trends.
Curated watchlists where BNBUSDT.P is featured.
Interest-earning crypto wallets: Put your digital money to work
12 No. of Symbols
Proof of Stake: Seeking validation?
26 No. of Symbols
See all sparks