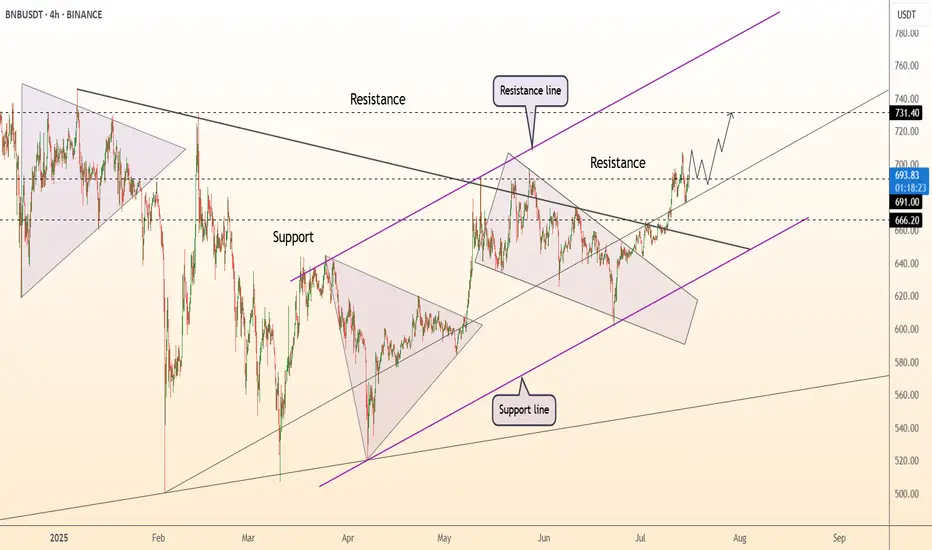
DeGRAM | BNBUSD above the resistance📊 Technical Analysis
● Candle closes have punched through the long-term black resistance and purple trend cap, turning the $666-673 breakout shelf into support as price tracks the grey inner up-sloper inside the rising channel.
● A pennant is coiling just beneath May’s peak; its measured pole and
Related pairs
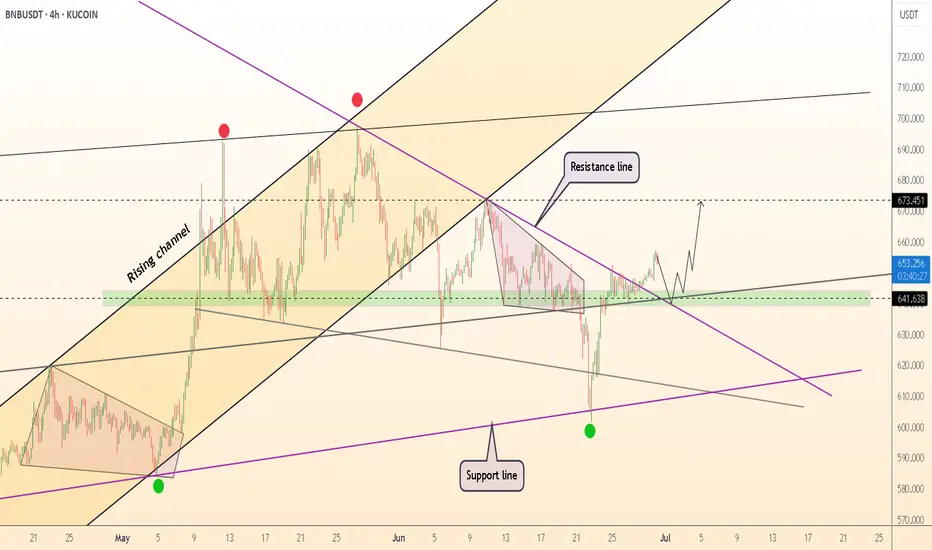
DeGRAM | BNBUSD broke the resistance line📊 Technical Analysis
● Breakout: price pierced the purple descending resistance, retested it and the green $641-648 demand cluster, then bounced—confirming the breakout as valid support.
● Rising channel intact; higher-low sequence points to the mid-band confluence at $673. A measured move from th
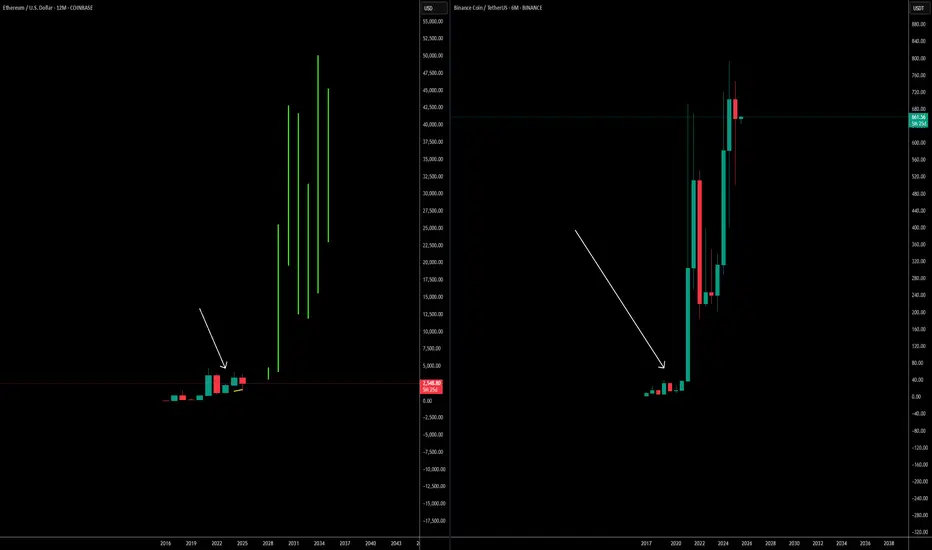
Why Ethereum’s Will 10×🚀 Ethereum’s Next 10×: Why bank-grade adoption + the stable-coin avalanche make a moonshot look conservative
Big banks are building on-chain right now. JPMorgan & Bank of America began 2025 pilots for dollar-backed tokens that settle on Ethereum, while Societe Generale just unveiled its USD Co
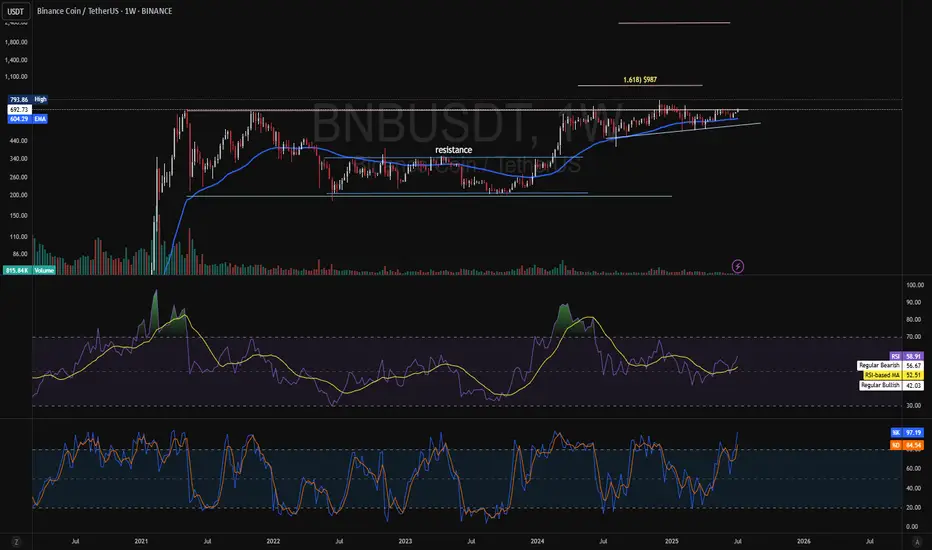
#BNB AnalysisThis chart is screaming I want to explode. Very low volume spike indicating accumulation at these levels. Especially at close to previous ATH. Price structure has been respected forming higher high and striving to make lowers not diverging from market structure at the price nears discovery area. The
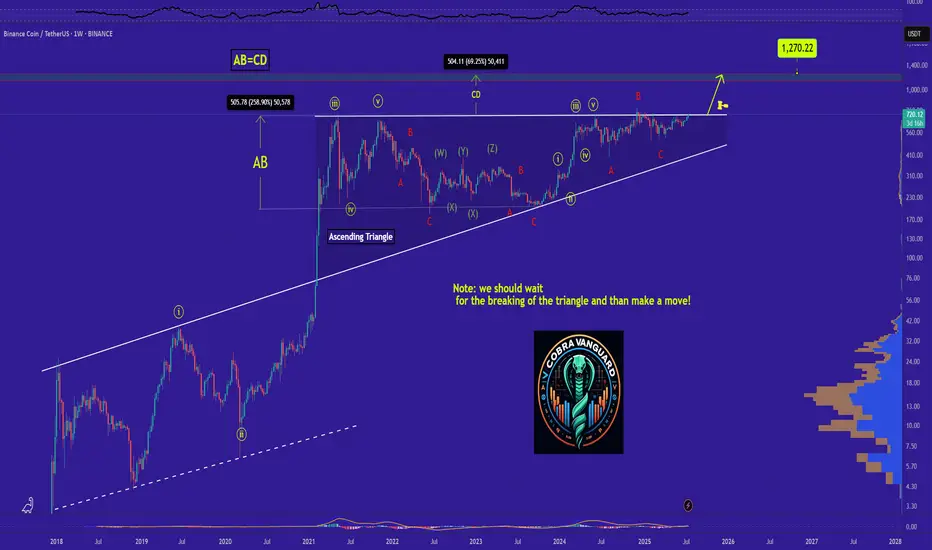
Why BNB Remains Bullish and Its Next Potential Move !Currently,is forming an ascending triangle, indicating a potential price increase. It is anticipated that the price could rise, aligning with the projected price movement (AB=CD).
However, it is crucial to wait for the triangle to break before taking any action.
Stay Awesome , CobraVanguard.
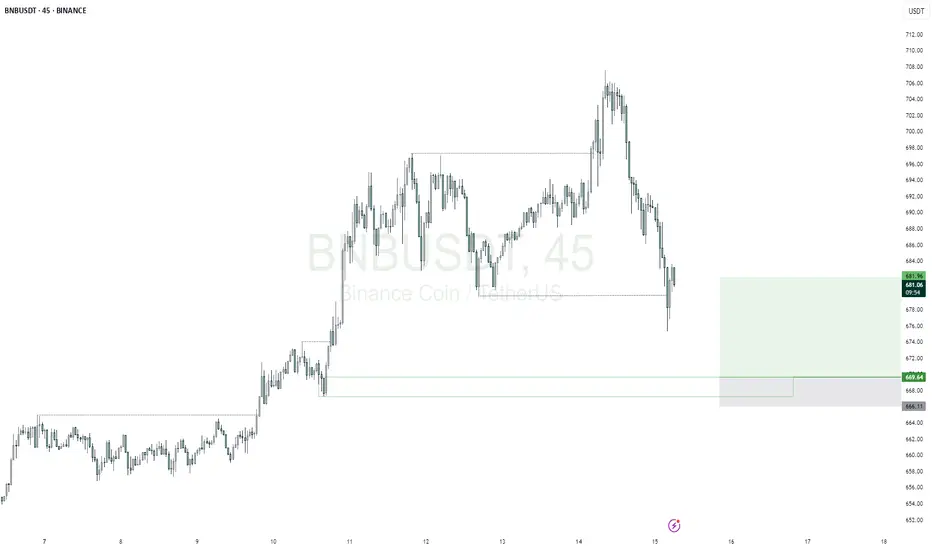
BNBUSDTmy entry on this trade idea is taken from a point of interest below an inducement (X).. I extended my stoploss area to cover for the whole swing as price can target the liquidity there before going as I anticipate.. just a trade idea, not financial advise
Entry; $669.64
Take Profit; $681.96
Stop
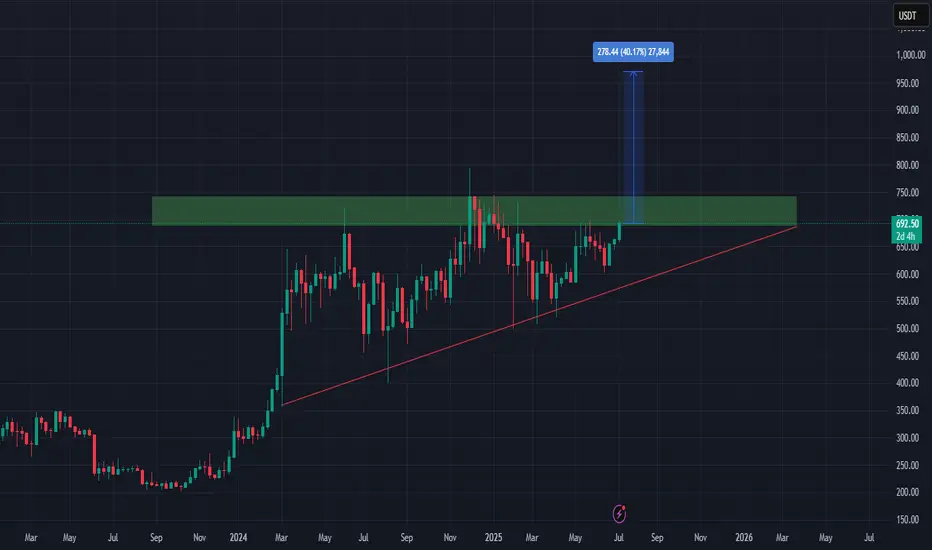
BNB/USDT – Ascending Triangle Breakout Setuphi traders
The BNB/USDT chart is displaying a classic ascending triangle pattern, which typically signals a potential bullish breakout. This pattern has formed over the past year, characterized by a series of higher lows (shown by the rising red trendline) while repeatedly testing a strong horizont
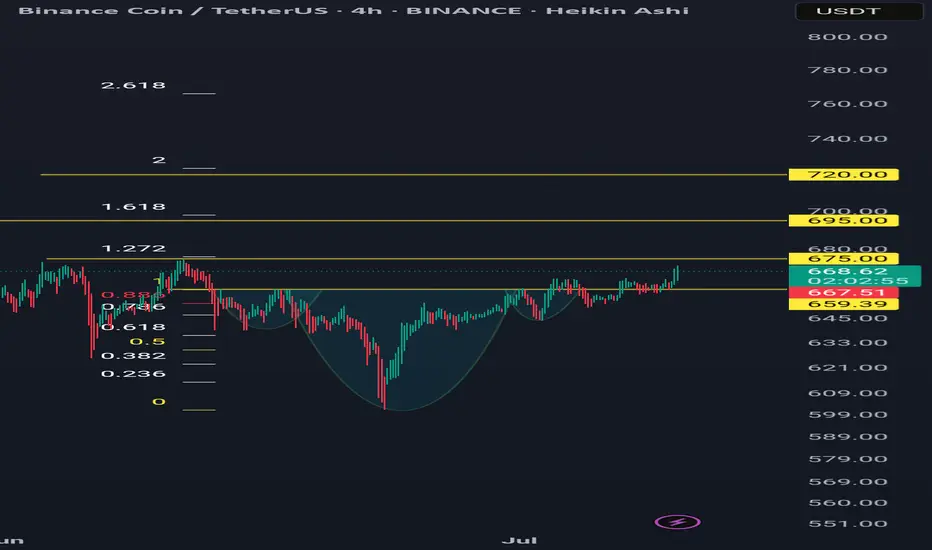
Bnb 4hr time frame iH&SAn activated iH&S pattern is formed a days ago. Targets are 675, 695 and 720.
If the 675 resist its a sign of weakness.
Pattern invalidation if closes below 643
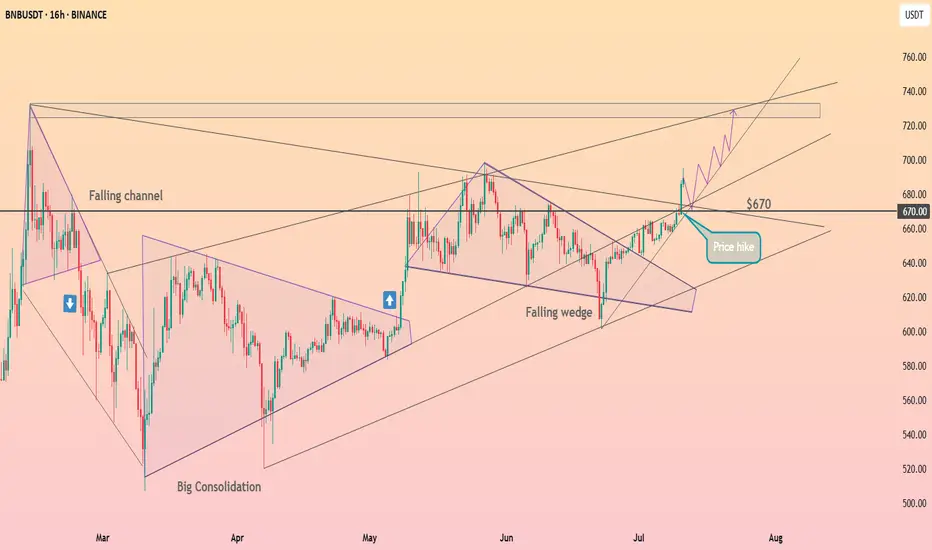
HolderStat┆BNBUSD breakoutBINANCE:BNBUSDT has reclaimed $670 support after breaking out from a long-term falling wedge. The bounce has been strong, and the rising structure now targets the $735–$740 resistance zone. Price action confirms bullish intent with consolidation beneath resistance before breakout.
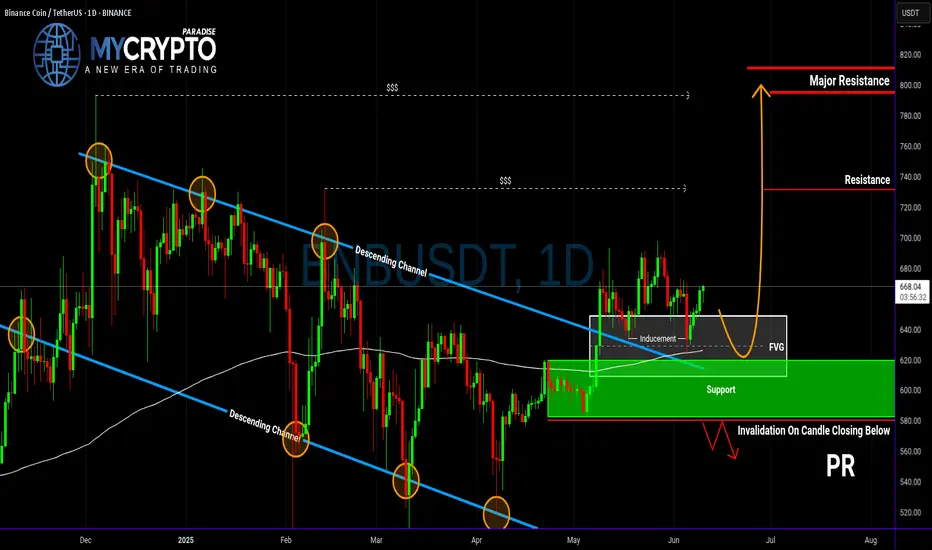
Is BNB About to Explode—or About to Collapse?Yello Paradisers! Could this be the beginning of the next BNB rally, or just another classic trap to liquidate early longs before the real move begins? Let’s dive into this high-probability setup before it’s too late.
💎BNBUSDT is currently showing good signs of bullish continuation. The price has s
See all ideas
Summarizing what the indicators are suggesting.
Oscillators
Neutral
SellBuy
Strong sellStrong buy
Strong sellSellNeutralBuyStrong buy
Oscillators
Neutral
SellBuy
Strong sellStrong buy
Strong sellSellNeutralBuyStrong buy
Summary
Neutral
SellBuy
Strong sellStrong buy
Strong sellSellNeutralBuyStrong buy
Summary
Neutral
SellBuy
Strong sellStrong buy
Strong sellSellNeutralBuyStrong buy
Summary
Neutral
SellBuy
Strong sellStrong buy
Strong sellSellNeutralBuyStrong buy
Moving Averages
Neutral
SellBuy
Strong sellStrong buy
Strong sellSellNeutralBuyStrong buy
Moving Averages
Neutral
SellBuy
Strong sellStrong buy
Strong sellSellNeutralBuyStrong buy
Curated watchlists where BNBUSDT is featured.

Interest-earning crypto wallets: Put your digital money to work
12 No. of Symbols

Proof of Stake: Seeking validation?
26 No. of Symbols
See all sparks
Frequently Asked Questions
The current price of BNB / Tether USD (BNB) is 718.88 USDT — it has risen 1.30% in the past 24 hours. Try placing this info into the context by checking out what coins are also gaining and losing at the moment and seeing BNB price chart.
BNB / Tether USD price has risen by 6.76% over the last week, its month performance shows a 9.88% increase, and as for the last year, BNB / Tether USD has increased by 18.28%. See more dynamics on BNB price chart.
Keep track of coins' changes with our Crypto Coins Heatmap.
Keep track of coins' changes with our Crypto Coins Heatmap.
BNB / Tether USD (BNB) reached its highest price on Jul 12, 2025 — it amounted to 697.46 USDT. Find more insights on the BNB price chart.
See the list of crypto gainers and choose what best fits your strategy.
See the list of crypto gainers and choose what best fits your strategy.
BNB / Tether USD (BNB) reached the lowest price of 544.13 USDT on Apr 30, 2025. View more BNB / Tether USD dynamics on the price chart.
See the list of crypto losers to find unexpected opportunities.
See the list of crypto losers to find unexpected opportunities.
The safest choice when buying BNB is to go to a well-known crypto exchange. Some of the popular names are Binance, Coinbase, Kraken. But you'll have to find a reliable broker and create an account first. You can trade BNB right from TradingView charts — just choose a broker and connect to your account.
BNB / Tether USD (BNB) is just as reliable as any other crypto asset — this corner of the world market is highly volatile. Today, for instance, BNB / Tether USD is estimated as 2.80% volatile. The only thing it means is that you must prepare and examine all available information before making a decision. And if you're not sure about BNB / Tether USD, you can find more inspiration in our curated watchlists.
You can discuss BNB / Tether USD (BNB) with other users in our public chats, Minds or in the comments to Ideas.