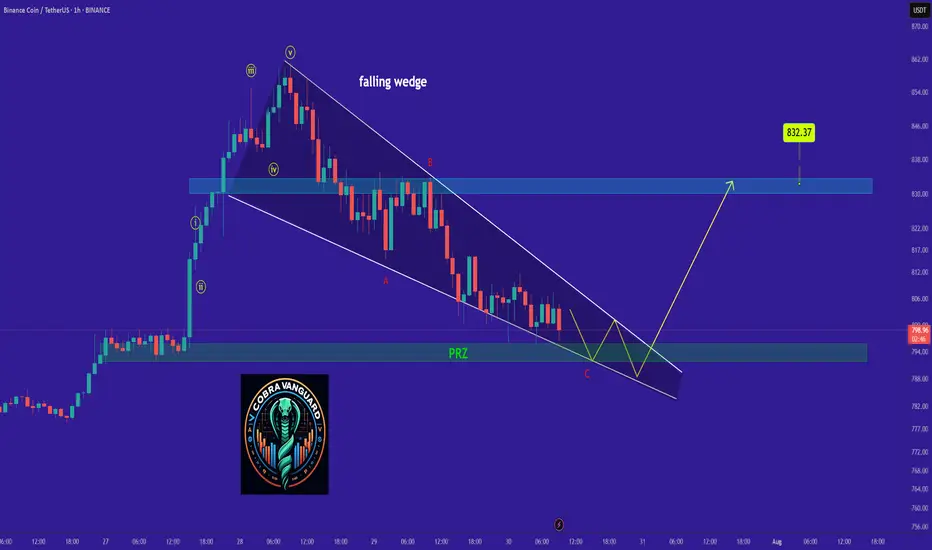
BNB's Situation (1h) !!!The BNB is in a Bullish phase by a Falling Wedge Pattern.
A falling wedge indicates the potential for price to reach to $830.
Note if the PRZ ZONE is broken downwards with the strength of Bearish candles , this analysis of ours will be failed.
Best regards CobraVanguard.💚
BNBUSDT trade ideas
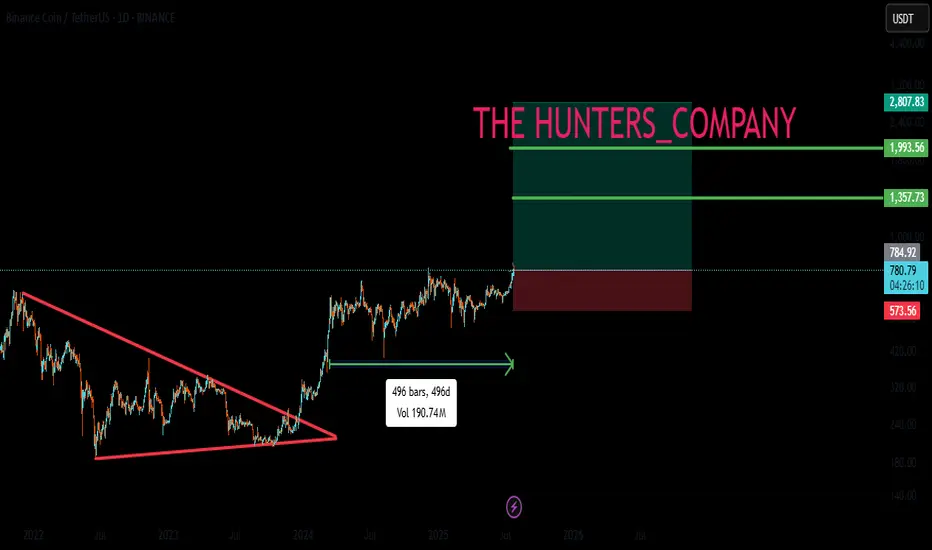
BNBUSDT - New ATH!"The strongest resistance level on the chart has just been broken — which was represented by the previous ATH — after nearly four attempts.
This exact pattern occurred before in 2021, and what followed was a parabolic rally.
The same scenario is unfolding now!
You’ll soon see BNB trading in four digit
When the crowd doubts — the smart money loads up.
Expect a parabolic rally once sentiment flips.
Best Regards:
Ceciliones🎯

BNB 5 RR upside HVFBNB 5 RR upside HVF - continuation patterns over and over on BNB. Seeking the 900 mark after an 800$ break and new setup with fractals.
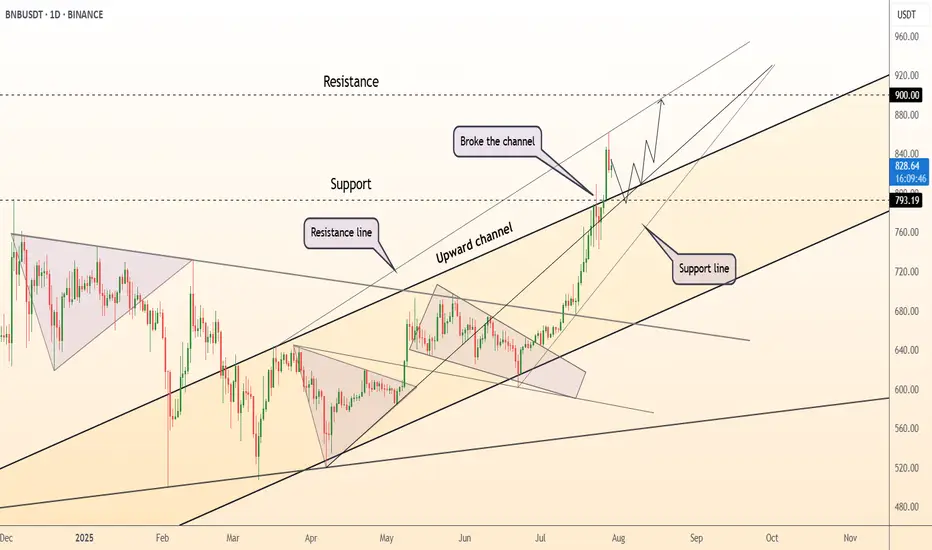
DeGRAM | BNBUSD broke the channel📊 Technical Analysis
● Daily candle closed back above the long-term median of the black rising channel after piercing the May-to-July grey resistance fan — a textbook “break-retest” that shifts the line into support at $793.
● Structure remains a staircase of higher-lows; the present pull-back is finding bids on the steep intraday trend-fan. A measured move of July’s pennant plus channel geometry converge at the round $900 barrier.
💡 Fundamental Analysis
● Binance’s 26ᵗʰ burn on 25 Jul destroyed 2.37 M BNB (~$1.9 B), shrinking circulating supply, while BNB Chain TVL rose another 4 % this week, underscoring persistent on-chain demand.
✨ Summary
Long $795-810; hold above $793 points to $835 → $900. Bull bias void on a daily close below $741.
-------------------
Share your opinion in the comments and support the idea with a like. Thanks for your support!
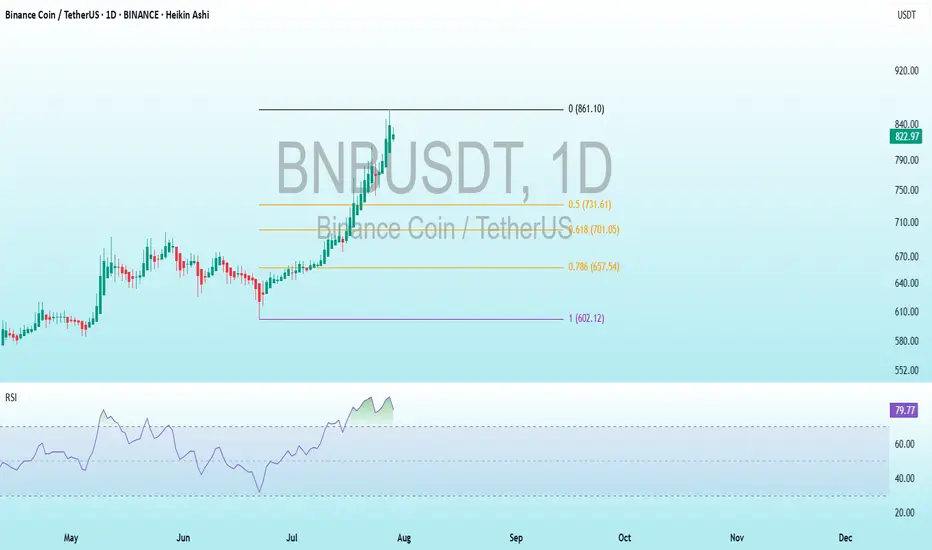
BNB Bearish DivergenceBINANCE:BNBUSDT
Trade Setup:
Target 1: 731.61 (0.50 Fibonnaci Golden Zone).
Target 2: 701.05 (0.618 Fibonnaci Golden Zone).
Target 3: 657.54 (0.786 Fibonnaci Golden Zone).
Target 4: 602.12 (1 Fibonnaci).
Stop Loss: 861.10 (above recent high, ~25% above current price).
RSI Analysis: The RSI shows a bullish divergence (price making lower lows while RSI makes higher lows), suggesting potential upward momentum. Current RSI is around 79.74, nearing overbought territory (>70), so caution is advised.
BNB - Challenging chart to analyzeBINANCE:BNBUSDT CRYPTOCAP:BNB CRYPTOCAP:BNB.D
Technical analysis :
BNB is one of the most challenging charts to analyze. I will try to decypher the hidden patterns.
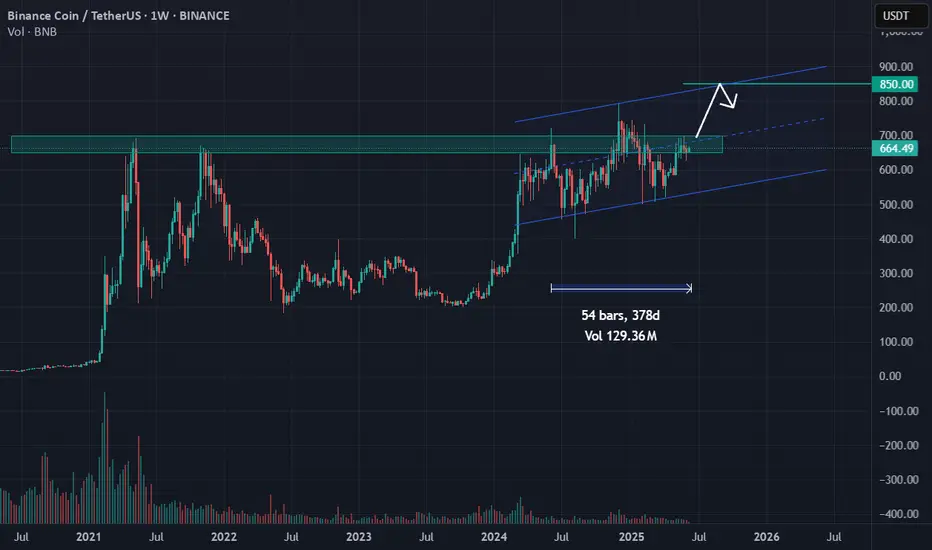
The BNB was in accumulation range for more than 1 year. The blue parallele channel limits the price movement.
Today, BNB is trading in the historical distribution level presented by the green rectangle. This shows the solid accumulation.
Psychological analysis :
The BNB was holding very well during recent BTC decline, which make It very attractive for investors as the project and the platform are strong. BNB will always be holding good as the platform is still attracting more and more traders all around the world. If Binance is not OK , all crypto market will be impacted.
Risks :
- Gorvernment fighting the platform
- Hacking
Rewards :
The main target of BNB is $850. If this level is broken with big volume, the next target is $1,000.
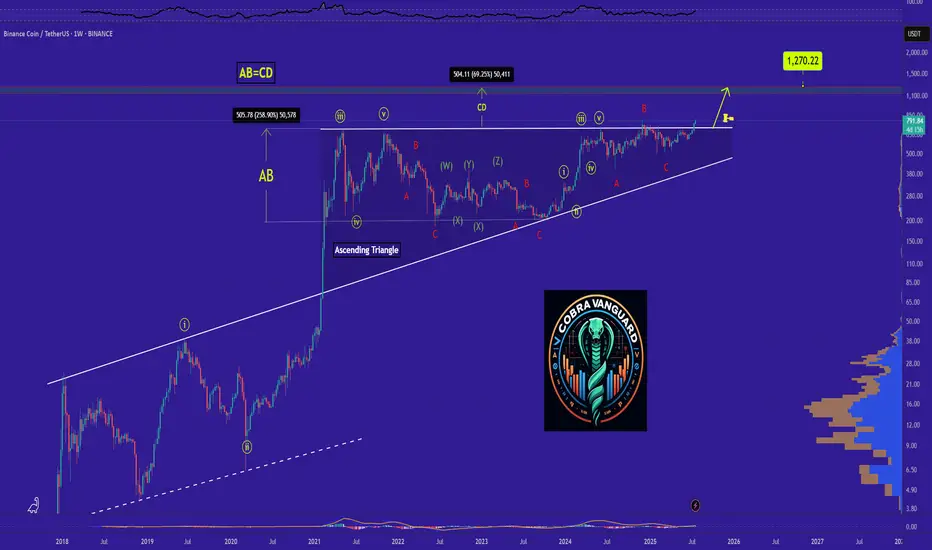
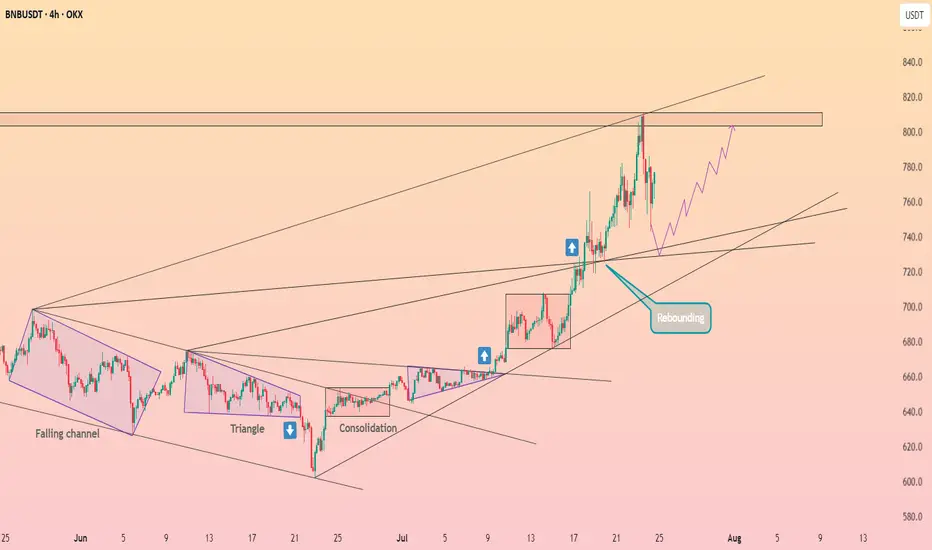
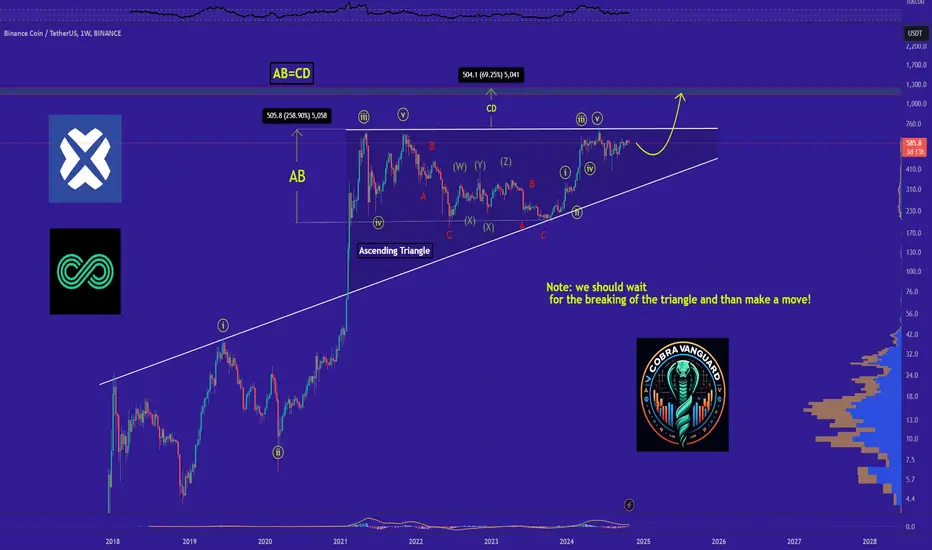
Why BNB Remains Bullish and Its Next Potential Move !Currently,is forming an ascending triangle, indicating a potential price increase. It is anticipated that the price could rise, aligning with the projected price movement (AB=CD).
previous analysis
Stay Awesome , CobraVanguard.
Cycles Don’t Lie — But Which One Speaks Here ?Markets love to repeat themselves.
But just because something repeats, doesn’t mean it’s predictable — or useful.
Let’s break down the main types of market cycles that traders talk about, and more importantly, let’s call out their flaws. No sugarcoating.
🔹 1. Time Cycles
These are based on the idea that price behaves in a similar way over specific time intervals — whether it’s 90 days, 4 years, or a custom Fibonacci count.
They show up in seasonal patterns, halving cycles (like Bitcoin), or through tools like Gann, Hurst, or even basic cycle lines.
The problem?
– The exact timing is rarely clean. A 120-day cycle might play out in 87 days next time.
– Flat, choppy markets will destroy any cycle-based setup.
– Different timeframes show different "cycles," so good luck aligning them.
– Most cycle tools are complicated and impractical for real-time decision making.
🔹 2. Psychological Cycles
The famous emotional rollercoaster: Hope → Euphoria → Fear → Panic → Capitulation → Depression → Optimism.
Every bull and bear market goes through these in some form — in theory.
The problem?
– It’s almost entirely subjective. Everyone sees a different phase.
– You usually recognize the cycle only after it’s over.
– Emotions aren’t equal across all assets — BTC retail emotions ≠ S&P500 institutional sentiment.
– There’s no precise tool to measure this. You’re mixing vibes with candles.
🔹 3. Structural Cycles (e.g. Wyckoff)
This one’s more about price behavior itself — accumulation, markup, distribution, markdown. The idea is that markets rotate through these four structural phases again and again.
The problem?
– Identifying where you are in the structure is hard in real time.
– Markets don’t always follow the Wyckoff textbook. Sometimes they just... go.
– It relies heavily on volume — and that doesn’t always align.
– Traders love to force a structure where there isn’t one. Confirmation bias, anyone?
🔹 4. Macro Cycles
Classic economic boom and bust: Expansion → Peak → Recession → Trough.
These cycles move slow but shape everything — interest rates, employment, growth, and eventually, risk assets.
The problem?
– They’re way too slow to help short-term traders.
– Good luck timing the top or bottom of the economy.
– Governments and central banks constantly interfere with natural cycles.
– Most macro data is lagging, so you’re reacting to history, not forecasting the future.
🔹 5. Liquidity / Volume Cycles
This idea tracks capital flow: when liquidity comes in, prices rise. When it dries up, risk assets fall. Simple, right?
The problem?
– Volume isn’t universal. Crypto volume =/= stock volume =/= forex volume.
– You can’t always track capital flow accurately, especially in OTC markets.
– Low volume doesn’t always mean weakness — sometimes it’s just summer.
– Volume data can be misleading, especially on shady exchanges.
🔹 6. Fractal Cycles
Markets repeat — at every level. 5-minute looks like the 4-hour, which looks like the daily. Elliott wave, harmonic patterns, whatever — the idea is that patterns echo across timeframes.
The problem?
– Pattern recognition can be wildly subjective.
– The market doesn’t always care about geometry. Sometimes it’s just noise.
– By the time a pattern is “confirmed,” you missed the move.
– Focusing too much on pattern symmetry makes you blind to macro/fundamentals.
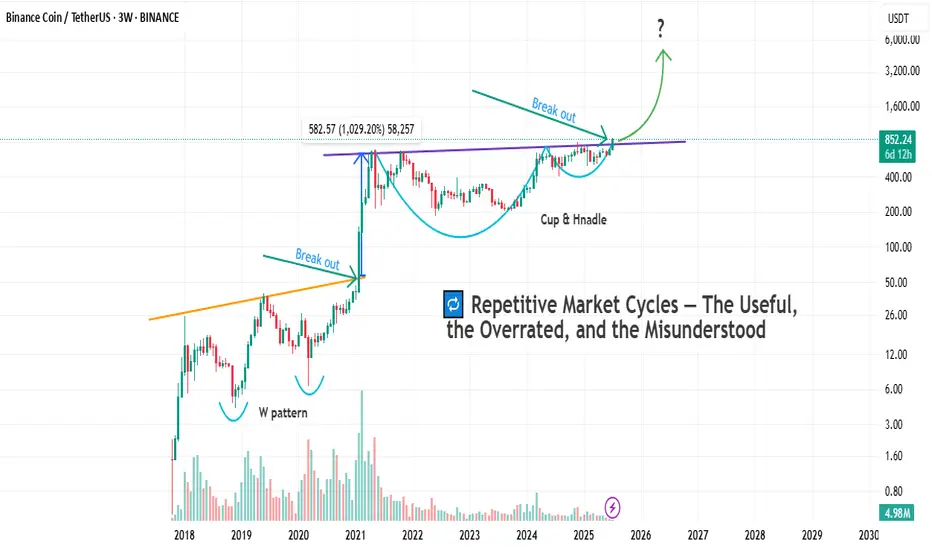
So after breaking all that down, let’s finally get to the chart in front of us.
Let’s take a closer look and see which cycle has actually played out here — and more importantly, which one actually helped :
As you can see on the chart, before every breakout above the previous all-time high, the market tends to form some sort of bottoming structure or reversal pattern.
And once that structure completes, the actual breakout usually leads to a solid price pump.
But here’s the key question:
Which one of the cycles we talked about earlier does this actually follow?
If you ask me, a professional trader will always try to use every tool available — not because any single one gives you the answer, but because combining them gets you closer to what's likely to happen.
And that’s what separates a well-rounded trader from a one-dimensional one.
Why do I say “one-dimensional”?
Because if you insist on looking at the market through a single lens, you’re bound to make bad decisions. We’re not here to prove our personal theories — we’re here to profit from what actually happens in the market, not what we think should happen.
In the chart above, we actually see a mix of all the cycles we talked about.
But I’d love to hear from you as well — let’s brainstorm together.
What do you see here as a trader?
And what’s your take on this setup?
Bottom Line
Yes, markets repeat.
But repetition doesn’t equal reliability.
Every cycle has its use — and its blind spot.
Know the difference. Use what fits your style.
And don’t romanticize a model just because it looks clean on a chart from six months ago.
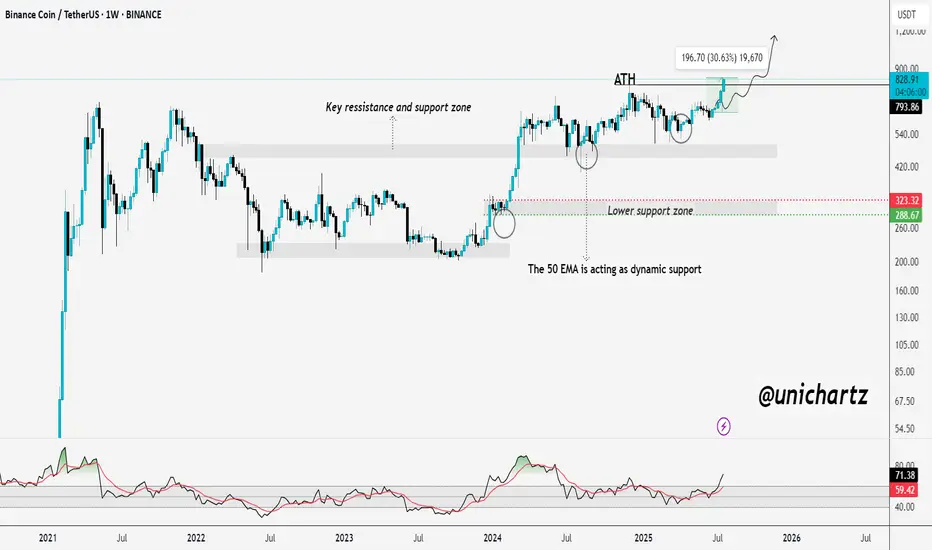
BNB Breaks ATH – Just Like I PredictedBNB ATH Breakout – Just As Predicted 🚀
A few days ago, I said it loud and clear:
"Mark my words — BNB will not only retest its ATH but break it and go beyond before the year ends."
Well... today, it happened.
BNB just smashed through its previous ATH and printed a new all-time high, exactly as charted.
Strong structure ✅
EMA support held ✅
Momentum built up ✅
Bulls showed up ✅
This is what conviction backed by TA looks like.
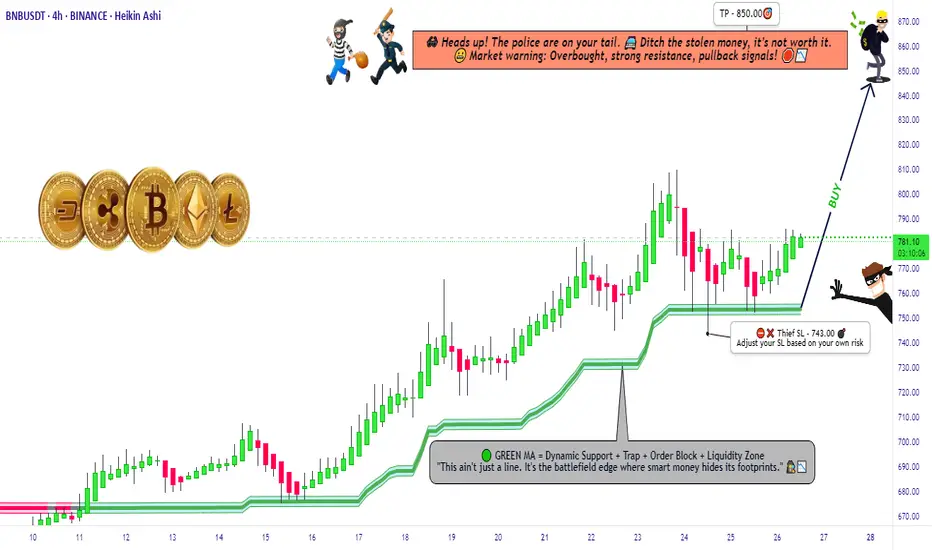
"BNB Primed for a Pump – Thief Trading Mode Activated!"🚨 BNB/USDT HEIST PLAN – SWIPE THE BULLISH LOOT BEFORE COPS ARRIVE! 🚨
🌟 Attention, Money Makers & Market Robbers! 🌟
(Hola! Oi! Bonjour! Hallo! Marhaba!)
The BNB/USDT vault is CRACKED OPEN—time to execute the ultimate heist! 🏦💰 Based on 🔥Thief Trading Style Analysis🔥, here’s your lucrative robbery blueprint for the Binance Coin vs. Tether market.
🔐 MASTER PLAN: LONG ENTRY HEIST (HIGH-RISK, HIGH-REWARD)
🎯 TARGET: 850.00 (or escape before the cops show up!)
🚨 POLICE TRAP ZONE: Overbought + Strong Resistance – Bears & cops are lurking!
💎 TAKE PROFIT EARLY & TREAT YOURSELF! (You’ve earned it, outlaw!)
⚔️ ENTRY STRATEGY: SWIPE FAST OR WAIT FOR THE PULLBACK!
🤑 VAULT IS OPEN! Enter any price if you’re bold (instant long).
🕵️♂️ SMART THIEVES: Use buy limit orders near 15M/30M swing lows/highs for a safer heist.
🛑 STOP-LOSS (ESCAPE ROUTE)
Thief SL: 743.00 (4H candle wick – adjust based on your risk tolerance!)
⚠️ WARNING: If the cops (bears) break in, DON’T HESITATE—RUN!
🎯 TARGETS & ESCAPE PATHS
Scalpers: Trail your SL & escape with quick loot! (Only long-side allowed!)
Swing Bandits: Hold strong but watch for police traps!
📡 MARKET INTEL (WHY THIS HEIST WILL WORK)
Bullish momentum in play! (But stay sharp—consolidation & reversals possible.)
Fundamentals, COT Reports, On-Chain Data, & Sentiment all hint at more upside!
🚨 TRADING ALERTS – DON’T GET CAUGHT!
📰 NEWS = VOLATILITY! Avoid new trades during major releases.
🔒 LOCK PROFITS! Use trailing stops to protect your stolen gains.
💥 BOOST THIS HEIST – STRENGTHEN THE SQUAD! 💥
🔥 Hit the LIKE & FOLLOW to support the robbery team!
🚀 More heists coming soon—STAY TUNED, OUTLAWS! 🚀
🎯 Trade Smart. Steal Big. Escape Faster. 🏴☠️
BNB WEEKLYHello friends🙌
🔊We are here with BNB analysis:
A long-term analysis that can be viewed as an investment, but in the long term, with patience and capital management...
You can see that after weeks of price suffering, a good upward move has now been formed by buyers, which has also caused a new ceiling to be set. Considering the market decline and the decline of most currencies, you can see that BNB is well supported and its price has suffered.
⚠Now, with the arrival of buyers, you can enter a long-term buy trade with capital management.
🔥Follow us for more signals🔥
*Trade safely with us*
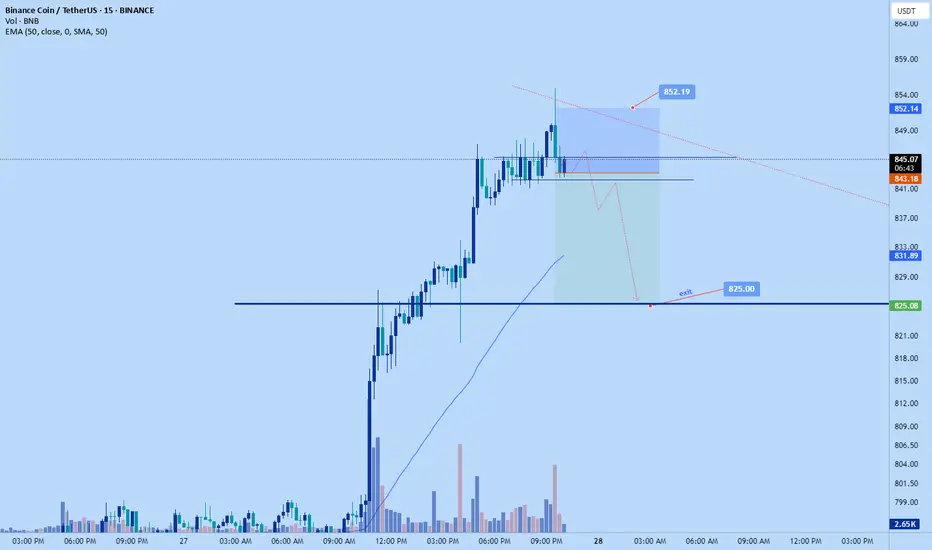
Bnb scalp short to $825 areaAnticipating a correction bnb soon. THe trend is still bullish but chancing a short as its quite high structurally. And saw signs of whales selling
Sl: $852.19 or higher
Tp: $825 area
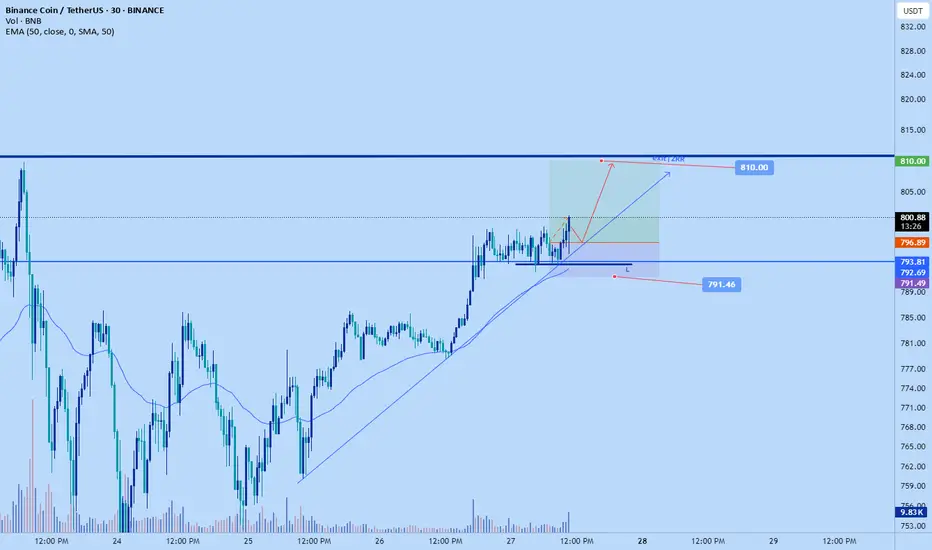
BNB scalp long to $810 new ATHBNB been making new ATH and no one is talking about it. Looking to scalp it back up to a new ATH right now.
ITs already but looks likely to retest another time before it dumps
Sl: $791.46
Exi: $810
It just spiked up a bit so one would have to wait for a bit of pullback again to get good RR else skip.
BNB - the strangest coin on the market? Almost no one trades it, and volumes have been falling for the second year in a row. But at the same time, it is the only token on the market that is in an upward flag. It is showing an even stronger trend than Bitcoin.
Yes, we are talking about BNB. Here's why you should pay attention to this token:
➡️ Money Flow shows divergence with the price, positions continue to close, and liquidity is gradually disappearing. However, over the past year and a half, the token's liquidity has hardly ever been in the negative zone.
Meanwhile, Bitcoin spent months in this zone, reaching values of -0.20. BNB barely touched the negative zone and immediately rebounded. This speaks to people's crazy faith in the token. There are simply no sellers.
➡️ Volume - purchase volumes have also diverged and continue to decline. BNB reached its current ATH on negligible volumes, which again highlights the complete lack of sellers. Even now, at the new ATH.
➡️ Liquidity Depth - as we know, the price moves from liquidity to liquidity. And now it is dozens of times greater at the bottom than at the top. This potentially hints at a local correction.
Also, during the growth, a GAP formed at the level of $576 - $502. And as we know, 99% of GAPs close sooner or later. But there is only one GAP and it is small, since BNB is a fairly low-volatility token and is traded quite effectively on its way up.
➡️ It is also the only one of the market leaders currently in an ascending flag, which means that the token has not yet seen a correction.
📌 Conclusion:
The chart looks obviously great, but there is local overheating, which will definitely be removed sooner or later. So BNB looks promising for shorting if it does not hold at $796.
However, Binance is certainly doing an excellent job of promoting its token with all these Launchpads and so on. So it is worth looking at a major correction to build up a spot position in BNB.
Subscribe and stay tune with more impactful ideas on trend tokens!

BNB Structural Analysis – Decision Zone & Bullish Setup Ahead!💎🚀 BNB Structural Analysis – Decision Zone & Bullish Setup Ahead! 🔥♦️
🔍 Dow Theory + Index Review + Market Structure Breakdown
✅ Like 💥 Follow 💬 Comment to keep this content coming daily!
👋 Hey traders! Welcome to our daily crypto routine:
📅 Every Day:
🔹 BTC + ETH technical updates
🔹 Full market structure review (TOTAL, BTC.D, USDT.D…)
📅 Every Sunday:
🔸 Weekly analysis of the Top 10 Altcoins (excluding BTC & ETH)
💎 Analysis method:
🧠 Dow Theory
📈 HWC Cycle – 1D timeframe
📉 MWC Cycle – 4H
🕐 LWC Cycle – 1H
📊 Index tracking: TOTAL / TOTAL2 / TOTAL3 / BTC.D / USDT.D
🔥 🧠 STRUCTURAL INSIGHTS – BNB, Market Context, and Trigger Points
♦️ Indexes Status
🔸 BTC.D – ⚠️ If 60.44 breaks down → bullish for altcoins. So far, the 62–62.36 zone has held as resistance – 🟢 still favorable for alts.
🔸 USDT.D – Currently trying to break 4.40, but hasn’t succeeded yet. This keeps the bullish bias intact.
💡 Before 4.13 breaks upward, we should already have open long positions.
🔸 TOTAL3 – Testing previous bottom – forming a potential double bottom.
💎 Breakout above 1.08T = 🟢 confirmation of a new altcoin wave, which could also support BNB’s rally
.
♦️ BTC Context – The Key to Altcoin Momentum
🟡 Still ranging between 115K–120K
🚀 Breakout above 120K could unleash strong rallies across alts – especially BNB.
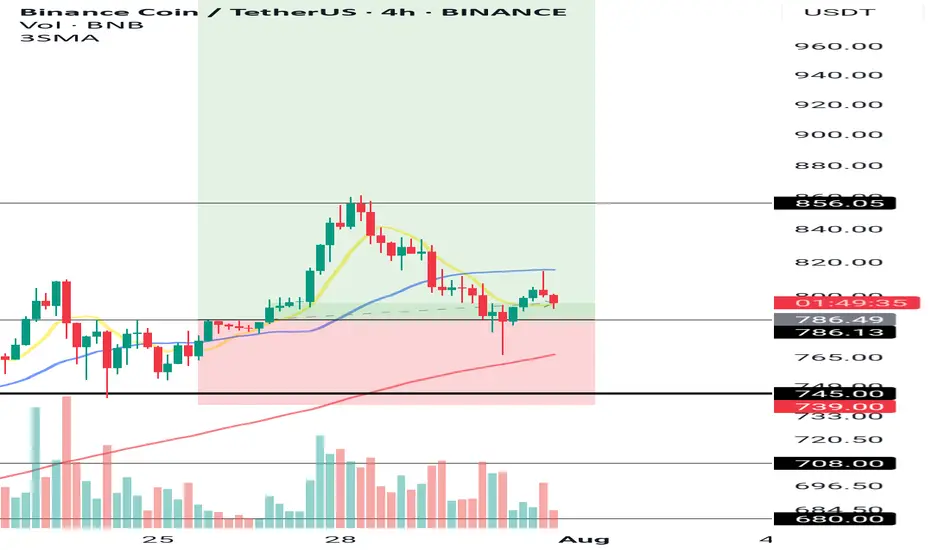
♦️ BNB/USDT Analysis – 4H Bullish, But Decision Time Is Near!
🔹 Trend:
✅ In the 4H timeframe, structure remains bullish – higher highs and higher lows still intact.
🔻 However, the latest price action has seen a deep correction from the 856 high, pushing price back into the daily support zone (745–786) = 📍 Decision Zone.
🛑 739 = key level. If it breaks, the 4H Dow structure breaks too.
💎 Key Levels to Watch:
• 🔼 Daily Resistance: 856.05
• 🔽 Key Daily Support: 745
• 🔽 Important 4H Support: 786.13
💎 Current Position Outlook:
✅ Entry at 786 = still valid and technically sound
✅ Stop-loss below 739 = protects the Dow structure
🎯 Targets: First 900, then 1000 – with potential for more if 1000 breaks
⚠️ Alternate Entry Trigger (Safe Setup):
🚀 If you missed the 786 entry:
📍 Wait for a break of previous 4H candle high (~805) WITH volume confirmation
🎯 Targets: 856 → 900 → 1000
🔁 Summary:
🟡 As long as the market holds above 739 and BTC doesn’t break down, this is a high-probability bullish setup
🔥 Break above 805 = a strong momentum trigger
📌 We stay bullish while respecting structure and volume
🚀 Smash that ROCKET if this analysis helped!
💬 Drop your thoughts in the comments
👍 Like & 🔔 Follow for daily updates and altcoin strategies
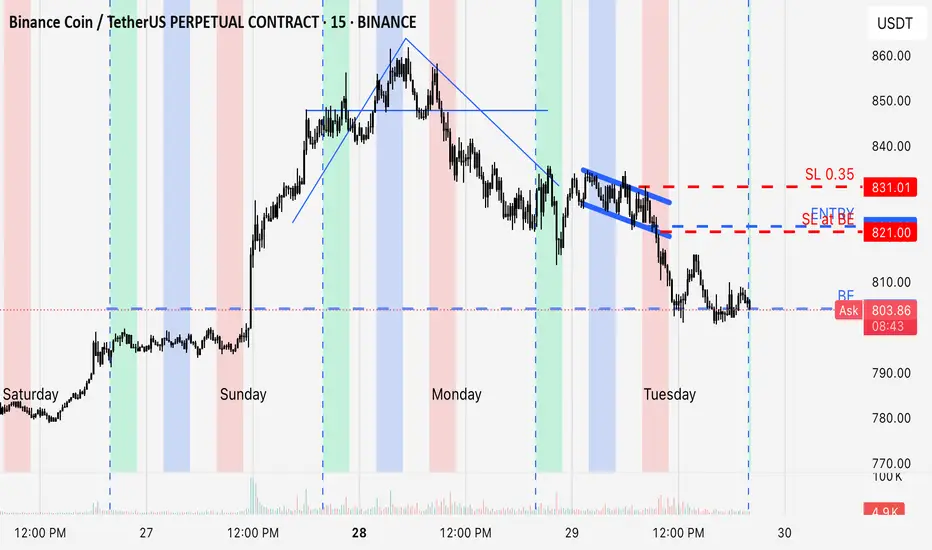
Overextended reversal3 legged move away from 20 ma, gave a false break. On the 15minutes, started to consolidate into London and breakout in newyork session
Binance coin has dropped from $800 ┆ HolderStatBINANCE:BNBUSDT surged from $532 support and is now battling $550 resistance. A daily close above $550 opens upside targets near $567. Rejection may drag price back into the $532–$537 range. Bias remains bullish while inside the current trend channel.
BNB/USDT - 45MIN Reversal in PlayPrice swept the New York session low, tapping into a key POC zone. A strong bullish engulfing candle followed, signaling potential reversal from demand. With momentum building, the setup targets the recent external liquidity above near FVG highs — a classic SMC bounce play.🔁

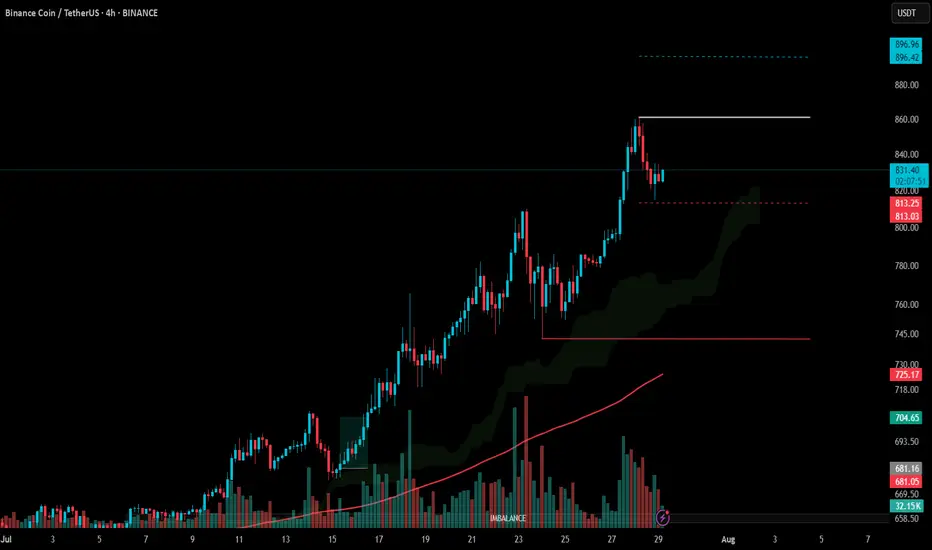
#BNB Update #1 – July 29, 2025#BNB Update #1 – July 29, 2025
Although BNB has approached the correction level of its last impulsive move, it hasn’t yet completed this correction. Another pullback might occur. We’re already talking about a BNB that’s making new ATHs one after another.
If you ask my opinion, I’m not sure if I would buy a project that has already hit an ATH, especially when there are many others that haven’t reached their ATHs yet or are still below them. But to be clear—BNB hasn’t finished its correction. For that to happen, it needs to pull back to the $812 level. If that correction completes, the target will be $896.
There are a lot of imbalance gaps in BNB. Since I won’t be opening any position, I don’t recommend opening one either.
Can BNB reach around $1000 ?...The BNB is in a ascending triangle now which means the price will increase and also It is expected that the price would at least grow as good as the measured price movement(AB=CD)
Note: we should wait for the breaking of the triangle and than make a move!
See my first anaysis on BNB in 2020
✨We spend hours finding potential opportunities and writing useful ideas, we would be happy if you support us.
Best regards CobraVanguard.💚
_ _ _ _ __ _ _ _ _ _ _ _ _ _ _ _ _ _ _ _ _ _ _ _ _ _ _ _ _ _ _ _
✅Thank you, and for more ideas, hit ❤️Like❤️ and 🌟Follow🌟!
⚠️Things can change...
The markets are always changing and even with all these signals, the market changes tend to be strong and fast!!
Perfect Sync: V Reversal Meets Bull Flag
Two clean and classic technical structures:
✅ V-Reversal Formation
✅ Bull Flag – still active and building pressure
After a sharp reversal, the price entered a bullish continuation phase.
Currently moving within the flag structure toward its upper edge.
If we see a breakout to the upside, the move could match the flagpole length, which aligns well with the target from the V-reversal pattern.
📍 Bullish scenario remains valid as long as we stay within structure.
📉 Breakdown below $570 invalidates this setup.
🧠 Important Reminder:
Enter only after a confirmed breakout.
✅ Apply strict risk management
✅ Never risk more than 1% of your capital on a single position.
Everything’s clear. No noise. Just wait for confirmation — let the market come to you.

DeGRAM | BNBUSD above the support📊 Technical Analysis
● BNB is climbing a steep micro-channel nested in the long-term purple up-trend; the last dip stopped exactly at the $775 breakout shelf and printed a fresh higher-high, showing buyers still protect every pull-back.
● The old March resistance line has been broken and retested as support; its extension, plus the channel ceiling, converge at $835-840—matching the 1.618 flag-pole projection from July’s consolidation.
💡 Fundamental Analysis
● On-chain activity is surging: Yahoo Finance reports BNB Chain daily transactions and DEX volume just reached multi-month highs, underpinning spot demand.
✨ Summary
Long $775-790; hold above the green shelf targets $835 → $840. Invalidate on a 4 h close below $741.
-------------------
Share your opinion in the comments and support the idea with a like. Thanks for your support!

Binance coin has fallen below the resistance line ┆ HolderStatBINANCE:BNBUSDT continues to form clear higher highs and higher lows, trending inside a steep ascending channel. After breaking out of a bullish triangle, momentum remains strong as price eyes the 900 mark. Buyers are clearly in control unless key support levels break.
