Why Ethereum’s Will 10×🚀 Ethereum’s Next 10×: Why bank-grade adoption + the stable-coin avalanche make a moonshot look conservative
Big banks are building on-chain right now. JPMorgan & Bank of America began 2025 pilots for dollar-backed tokens that settle on Ethereum, while Societe Generale just unveiled its USD CoinVertible stable-coin on main-net.
Stable-coins already move more money than Visa + Mastercard combined. $27.6 trillion flowed through stable-coins in 2024—most of it routed over Ethereum block-space.
Ethereum clears four-fifths of that stable-coin volume. More than 80 % of all stable-coin transactions occur on ETH or its L2s, locking in network effects that rivals can’t match.
ETF wall-of-money is already hitting the gate. 2025 Ethereum ETFs posted a record $743 million month of inflows—the strongest vote of institutional confidence to date.
ETH supply keeps shrinking while demand spikes. Post-Merge burn has removed roughly 332 k ETH, flipping issuance negative; base-line inflation is now < –1.3 %/yr.
30 million ETH is locked in staking, slicing liquid float by 25 %. The yield engine tightens supply just as banks and ETFs need inventory.
Real-world assets are going token-native. Tokenized bond issuance jumped 260 % in 2024 to €3 billion, and virtually every pilot settles on ERC-standards.
Layer-2 roll-ups slashed average gas fees to <$4. Cheaper block-space makes day-to-day payments viable, driving still more stable-coin throughput (and fee burn).
User base is exploding toward mass scale. Active ETH wallets hit 127 million—up 22 % YoY—showing that retail, devs, and institutions are onboarding together.
Energy-efficient PoS removes the last ESG roadblock. With > 99 % less energy use than PoW chains, Ethereum checks the sustainability box that banks and asset managers need for wide-open deployment.
Bottom line: when TradFi giants plug directly into Ethereum rails and stable-coins dwarf legacy payment rails, every transfer torches a little more supply. Add the ETF flywheel and a vanishing float, and a 10× move shifts from “moon-boy” to math.
OTHER EXAMPLES
TSLA
tradingview.sweetlogin.com
Total 2
tradingview.sweetlogin.com
MartyBoots here—trading for 17 years, and I would like to hear YOUR take!
👉 Can Ethereum really 10× from here? Drop your best argument below, hit the 👍 if you learned something, and smash that Follow to stay in the loop on every crypto deep-dive I post.
BNBUSDT trade ideas
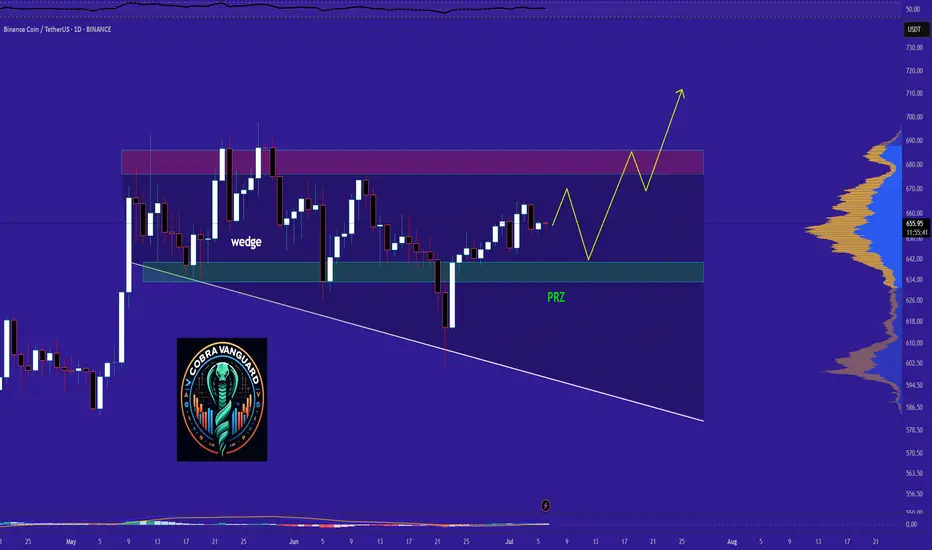
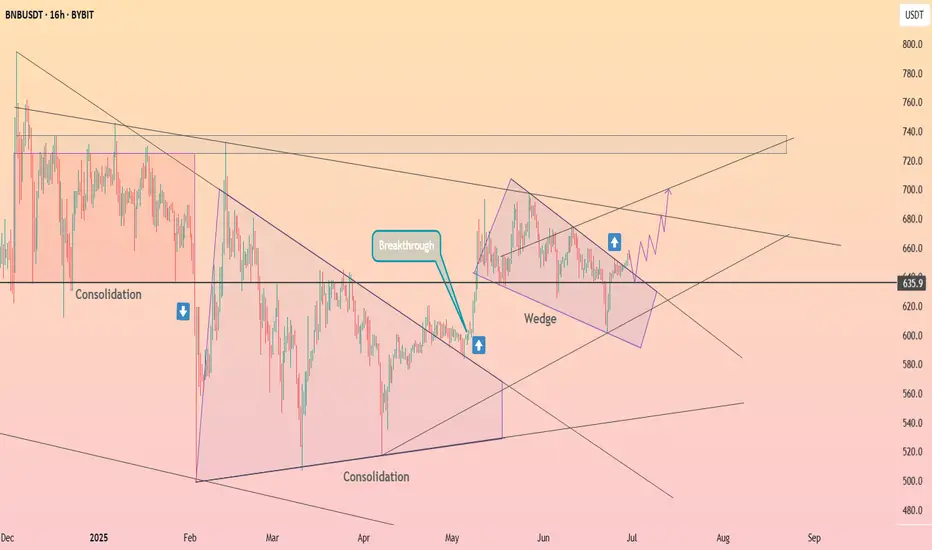
BNB Ready for PUMP or what ?The price could drop to the PRZ range and then rise toward the wedge's ceiling. If the wedge breaks, higher prices are not out of the question.
Best regards CobraVanguard.💚
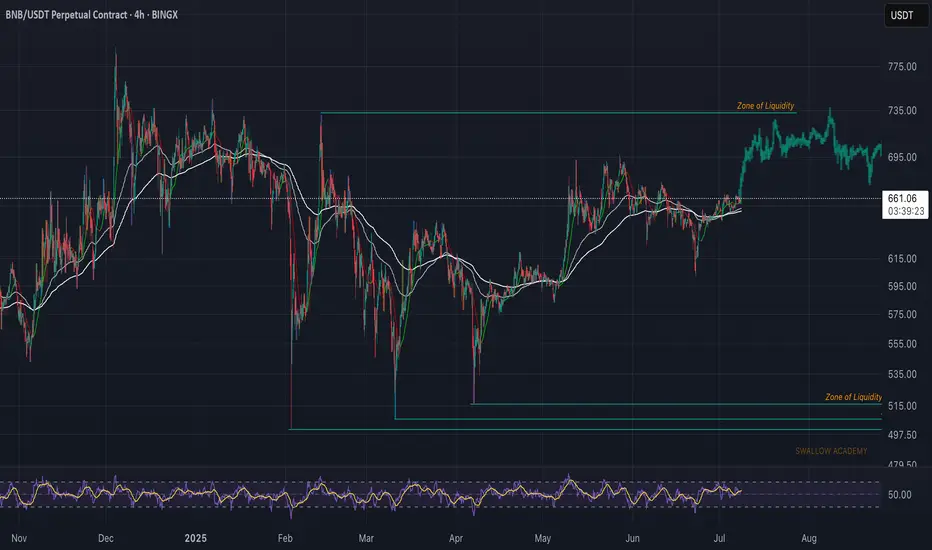
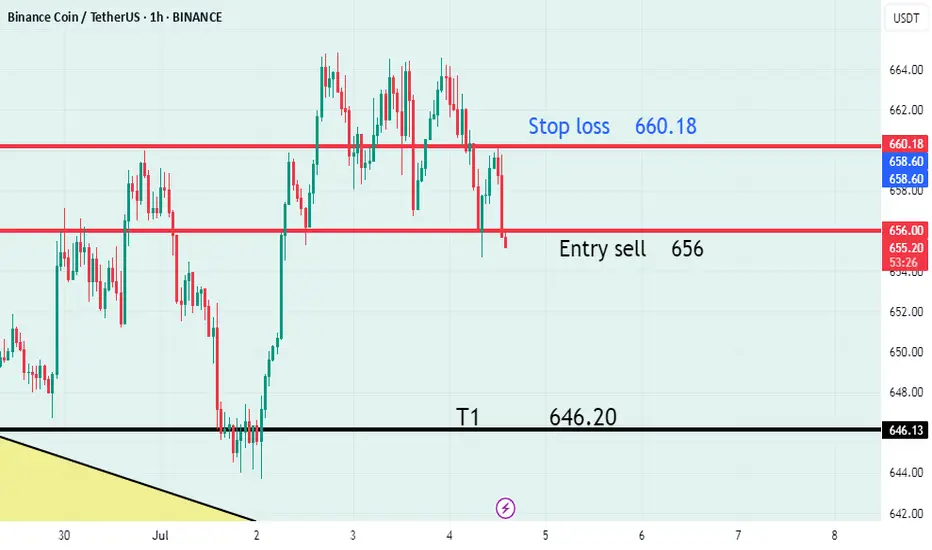
Binance Coin (BNB): Similar Pattern Forming / Liquidity HuntingBNB coin has pretty similar price ation compared to Novemenr 2024 bullish buildup we had. Lately price has been rather trading in a sideways chanel with quite some liqudiity huntings on the way as well.
What we are expecting currently is a further buyside dominance which would lead the price to local high area, from where we might be seeing some strong downard movement and from wher ewe will be trying to catch a short position as well.
P.S. not our favourite coin to trade but scalping is pretty decent on this one tbh.
Swallow Academy
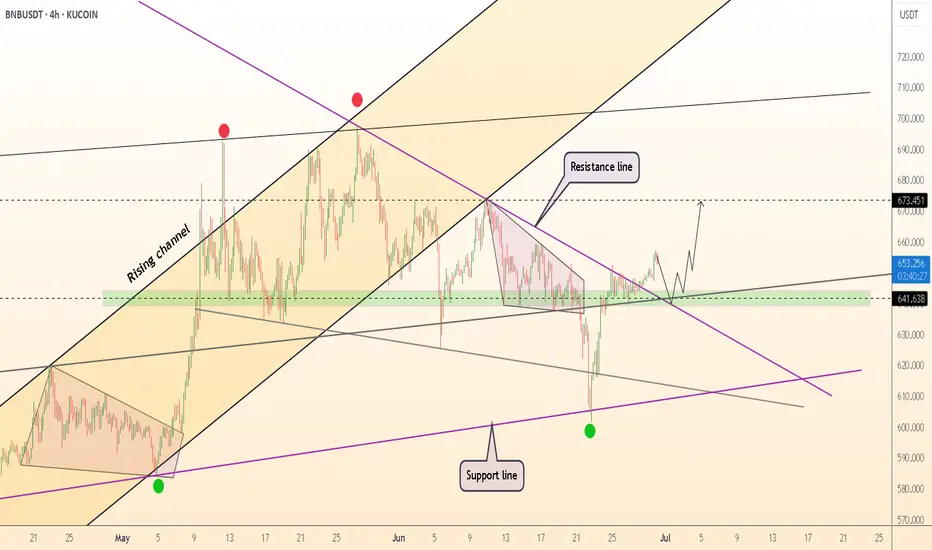
DeGRAM | BNBUSD broke the resistance line📊 Technical Analysis
● Breakout: price pierced the purple descending resistance, retested it and the green $641-648 demand cluster, then bounced—confirming the breakout as valid support.
● Rising channel intact; higher-low sequence points to the mid-band confluence at $673. A measured move from the mini flag that is forming inside the channel also projects to $705.
💡 Fundamental Analysis
● Binance’s “Megadrop 2” airdrop locked another 350 k BNB this week while BNB Chain TVL rose 4 %, tightening float and sustaining bid.
✨ Summary
Long $645-655; hold above $641 targets $673 ➜ $705. Invalidate on a 4 h close beneath $604.
-------------------
Share your opinion in the comments and support the idea with a like. Thanks for your support!
BNBUSDT Forming Bullish PennantBNBUSDT is showing an impressive breakout pattern that’s catching the attention of crypto investors and traders alike. Binance Coin has consistently proven itself as a top altcoin, and this breakout signals a strong shift in momentum that could push prices higher by 10% to 20% in the short term. The current surge in trading volume supports this bullish scenario, indicating that both retail traders and institutional players are positioning themselves for potential upside gains.
This breakout is not just a technical event — it’s underpinned by BNB’s robust fundamentals. Binance Coin remains one of the most utility-driven tokens in the crypto market, with use cases ranging from transaction fee discounts on the Binance Exchange to staking, launchpad participation, and even DeFi projects. As Binance continues to expand its ecosystem, the demand for BNB is likely to grow, adding fuel to this breakout rally.
For traders, the key is to watch for price stability above the breakout level and look for confirmation signals that the move is backed by sustainable momentum. Managing risk with clear stop-losses and profit targets will be crucial as the market reacts to broader trends and any news from the Binance ecosystem. With the current sentiment positive and buyers stepping in aggressively, BNB could be poised for another leg higher in its long-term uptrend.
✅ Show your support by hitting the like button and
✅ Leaving a comment below! (What is You opinion about this Coin)
Your feedback and engagement keep me inspired to share more insightful market analysis with you!
Skeptic | BNB Surge: Rocket Triggers for Spot & FuturesHey everyone, it’s Skeptic! 😎 Is BNB ready to rocket? I’m diving into a pro-level breakdown of Binance Coin (BNB), a top 5 crypto with a $92.9B market cap, now trending on CoinMarketCap with surging momentum. This analysis unpacks recent upgrades, ecosystem strength, and technical triggers for spot and futures trading, grounded in cycle-based strategies. Trade with no FOMO, no hype, just reason.
Recent Performance & Key Events
Binance Coin ( BNB ), trading at $ 660 with a $92.9 billion market cap, ranks among the top 5 cryptocurrencies globally. The Maxwell hard fork in recent weeks slashed block times to 0.75 seconds, boosting network speed and efficiency, adding $8 billion to the Binance Chain’s market cap. BNB powers the Binance ecosystem, supporting staking, NFTs, and DeFi projects. Despite regulatory scrutiny, ongoing platform expansion and token burn mechanisms sustain BNB’s utility and investor interest. Let’s dive into the technical setup for actionable trades. 📊
Technical Analysis: Cycle-Based Breakdown
The Weekly timeframe is range-bound, so lower timeframes drive price action. Let’s break it down:
Daily Timeframe
On the Daily, we had a primary uptrend within an upward channel, which broke downward. I cloned the channel and placed it below, and price has reacted well to the midline, still holding there. A midline break could drive price to the channel floor at $536.47. However, a V-pattern stands out as one of the strongest patterns. Why? It shows sellers broke support and consolidated below, but buyers overwhelmed them, pushing price back above support instantly. This signals immense buying pressure, liquidating shorts despite heavy selling—big respect to buyers! lol
💬 For spot trading , wait for BTC.D to turn bearish, as rising BTC.D means liquidity flows to Bitcoin, making altcoin buys less attractive. BNB/BTC turning uptrend is another confirmation—currently, BNB/BTC is bearish, so focus on Bitcoin for now. Check pair/BTC ratios to spot coins outperforming Bitcoin.
Key Insight: Volume and BTC.D/BNB/BTC confirmation are critical for spot buys to avoid low-liquidity traps.
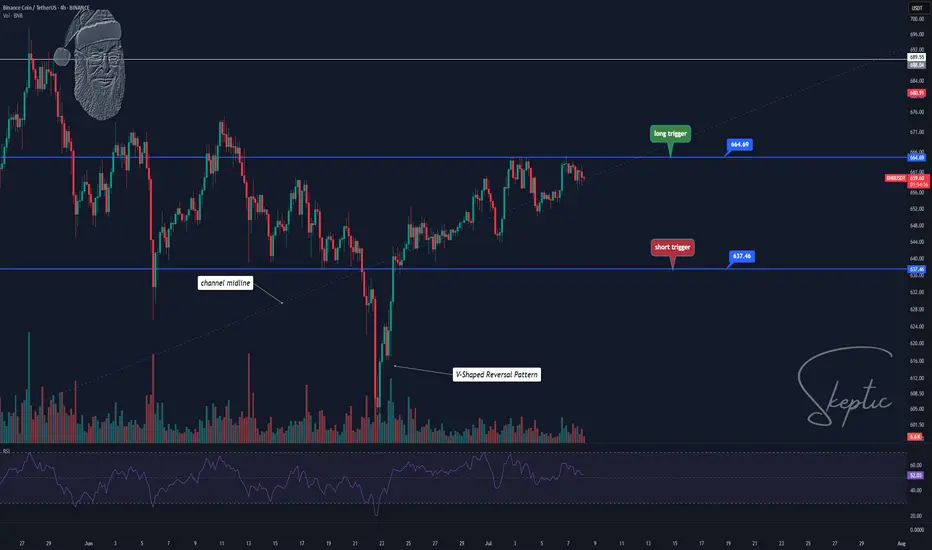
4-Hour Timeframe (Futures Triggers)
On the 4-hour, for longs:
Trigger: Break of resistance at $ 664.69 , confirming the V-pattern. Validate with a volume surge on breakout and RSI entering overbought.
Short Trigger: If support at $ 637.46 breaks again, go short, as buyers may lack strength after exhausting their effort in the prior defense. Volume confirmation is essential.
Pro Tip: ALWAYS use volume to confirm positions. Without a volume spike, fakeout risk is high. Stick to 1%–2% risk per trade to protect capital.
Final Vibe Check
This BNB breakdown delivers precise triggers: long at $664.69 (futures with V-pattern confirmation), short at $637.46 (futures). With a range-bound Weekly and Daily V-pattern, volume and BTC.D/BNB/BTC signals are your edge. BNB’s Maxwell fork and ecosystem strength fuel its potential, but regulatory risks demand tight stops. Want more cycle setups or another pair? Drop it in the comments! If this analysis sharpened your game, hit that boost—it fuels my mission! 😊 Stay disciplined, fam! ✌️
💬 Let’s Talk!
Which BNB trigger are you eyeing? Share your thoughts in the comments, and let’s crush it together!
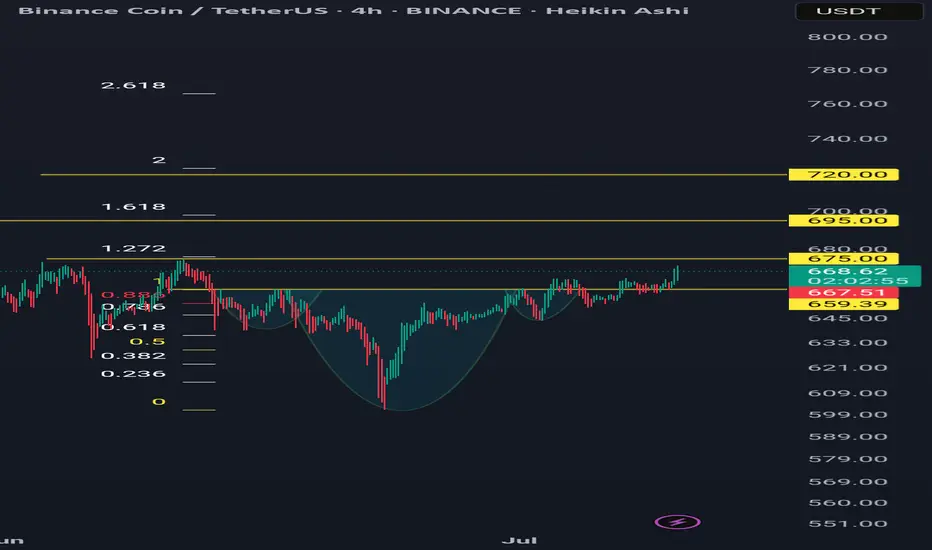
Bnb 4hr time frame iH&SAn activated iH&S pattern is formed a days ago. Targets are 675, 695 and 720.
If the 675 resist its a sign of weakness.
Pattern invalidation if closes below 643
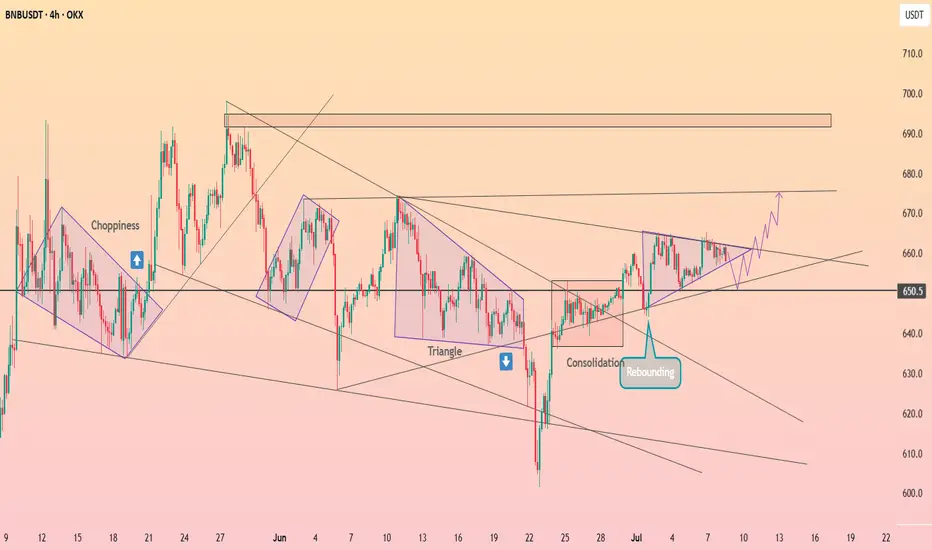
HolderStat┆BNBUSD forming the triangleBINANCE:BNBUSDT is approaching the apex of a symmetrical triangle pattern with strong support from 650. Repeated rebounds and higher lows indicate bullish pressure. A breakout above 665 could drive price to test the 695 resistance block.
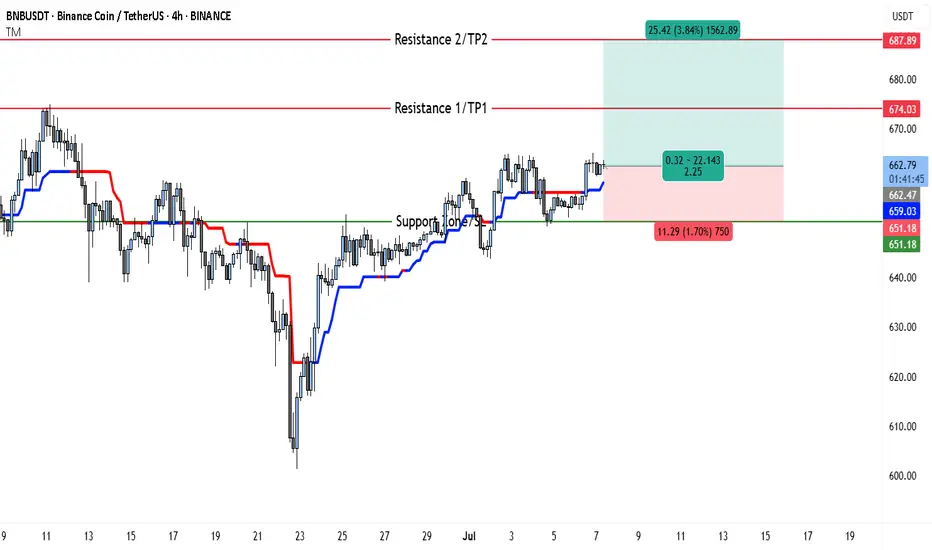
BNB Surge Incoming? Why Traders Are Watching $674On the 4H timeframe, BNBUSDT is showing a clear bullish structure with a consistent sequence of higher highs and higher lows since the low formed around June 23. Price action has gradually climbed, forming a well-respected ascending support base. This bullish momentum is further supported by the trend indicator (likely a custom moving average or Supertrend) that has shifted from red to blue and remained supportive of upside movement since late June. The recent consolidation just above the 651–652 support zone suggests that bulls are absorbing selling pressure before potentially pushing higher 📈.
What stands out is how price has broken above previous resistance near 659 and is now hovering near it, turning it into support. This is a textbook break-and-retest pattern, which adds to the bullish case. Buyers seem to be stepping in with confidence around this level.
Key levels are well-marked:
• Support Zone / SL Region: 651.18 – This area has been tested multiple times, making it a strong support and a good level to define risk.
• Resistance 1 / TP1: 674.03 – This is the next target zone, aligned with prior swing highs.
• Resistance 2 / TP2: 687.89 – A more ambitious target in line with broader continuation if momentum holds.
🔐 The current price at 662.07 shows signs of consolidation right above the support-turn-resistance level of 659.03. If the bulls defend this level successfully, continuation toward higher targets is likely.
Trade Setup Summary 🧾
• Entry: Around 662.07 (current market level, post breakout consolidation).
• Stop Loss: Just below the support zone at 651.18, giving enough breathing room while keeping risk controlled.
• Take Profit 1 (TP1): 674.03, a logical level of prior resistance.
• Take Profit 2 (TP2): 687.89, extended resistance zone from previous price action.
• Risk/Reward Ratio: Roughly 1:2.25, offering favorable reward compared to risk.
✅ Why This Trade Setup Makes Sense:
• Break-and-retest confirmation around 659 adds reliability 🔄
• Trend indicator is supportive of bullish momentum 📈
• Risk is clearly defined just below a major support zone 🛡️
• Room for upside toward TP2 offers good potential for reward 💰
Unless price breaks down below 651 with heavy volume, the technical structure remains bullish. If it dips to the support zone again, it might offer a second chance entry opportunity before heading to targets.
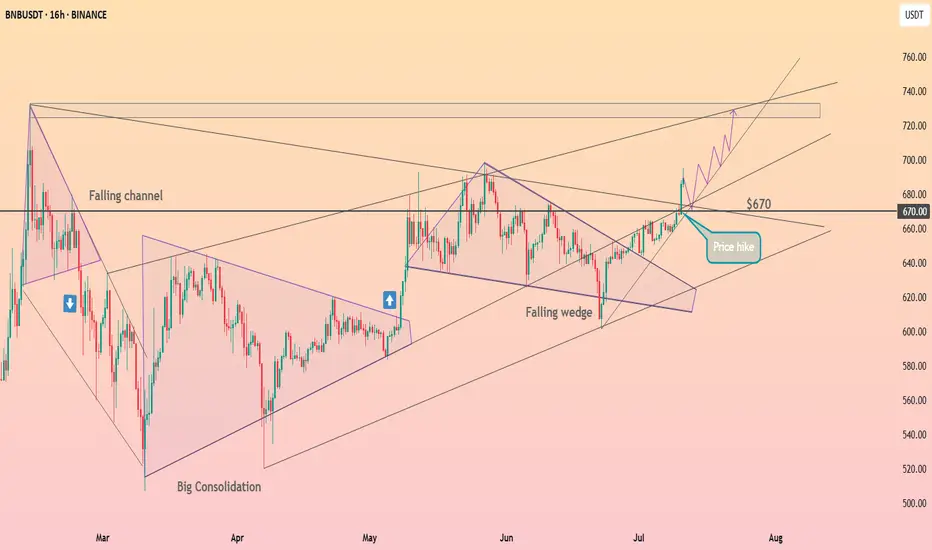
HolderStat┆BNBUSD breakoutBINANCE:BNBUSDT has reclaimed $670 support after breaking out from a long-term falling wedge. The bounce has been strong, and the rising structure now targets the $735–$740 resistance zone. Price action confirms bullish intent with consolidation beneath resistance before breakout.
BNB ATH to 2k
At least 1200 imho
Binance continues to be one of the most profitable crypto exchanges globally.
It saw strong year-over-year revenue growth in 2024, though slightly below its high mark in 2021.
Significant profit in just the final quarter suggests savvy cost management and peak market conditions.
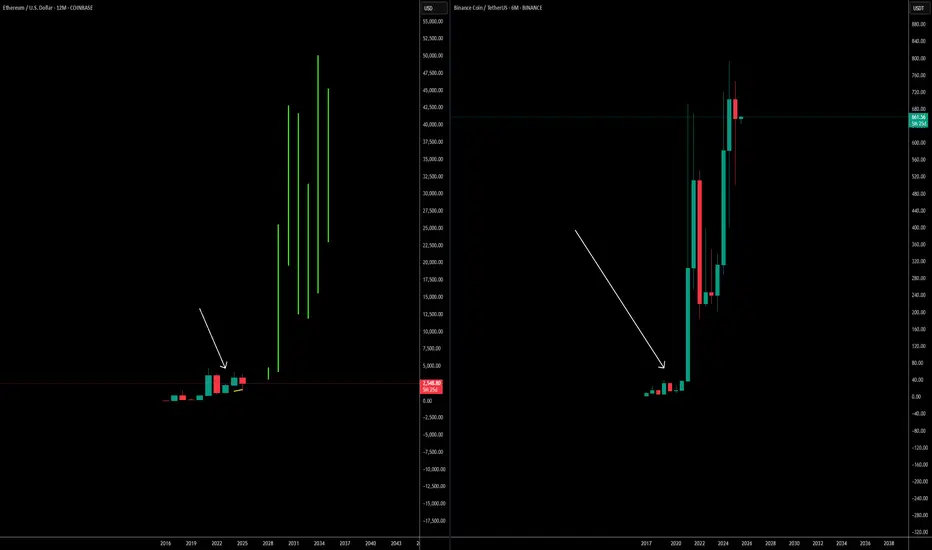
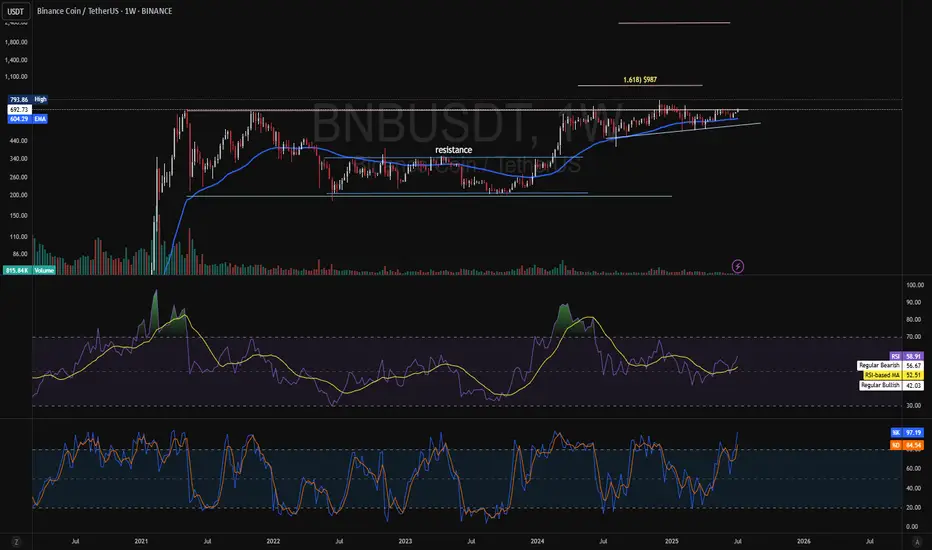
#BNB AnalysisThis chart is screaming I want to explode. Very low volume spike indicating accumulation at these levels. Especially at close to previous ATH. Price structure has been respected forming higher high and striving to make lowers not diverging from market structure at the price nears discovery area. The RSI sits at a medium range not close to overbought territory. Has developed a respected rectangle pattern with few retests on previous highs. A fib extension gives a return of a minimum $987, and it can break above that with the structure formation we have. It also sits well above the median yearly average. Until the structure changes bearish, I am long on this with risk to reward ratio, being higher on the upside.
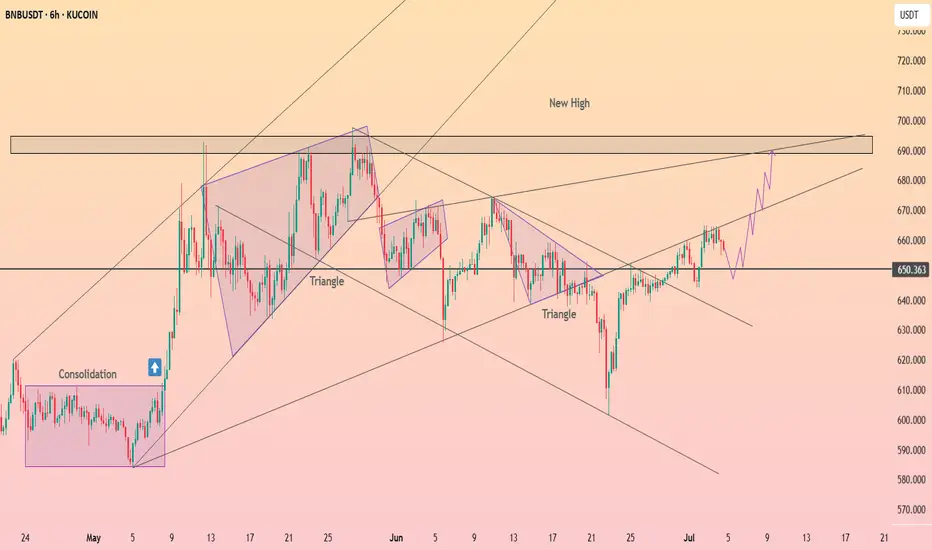
HolderStat┆BNBUSD consolidated above the $650 levelKUCOIN:BNBUSDT is holding firm above 650 after breaking through a symmetrical triangle. The price structure is supporting a bullish continuation toward the upper resistance zone at 690–700. A clear uptrend is forming with tight consolidation along support, hinting at a breakout move.
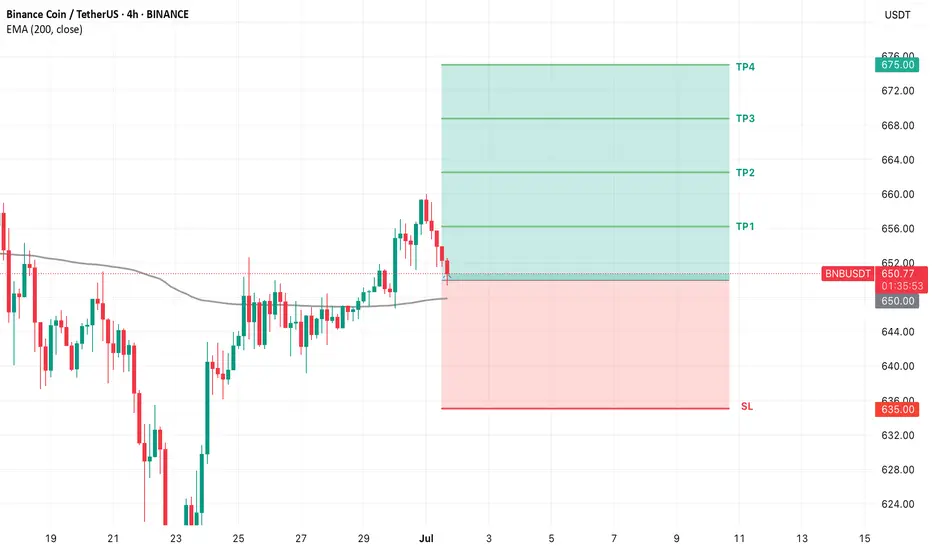
BNB USDT LONG TRADE SETUPBNB/USDT is currently holding at a strong support zone, with a high probability of an upward price move. Also EMA 200 acting as a support for BNB.
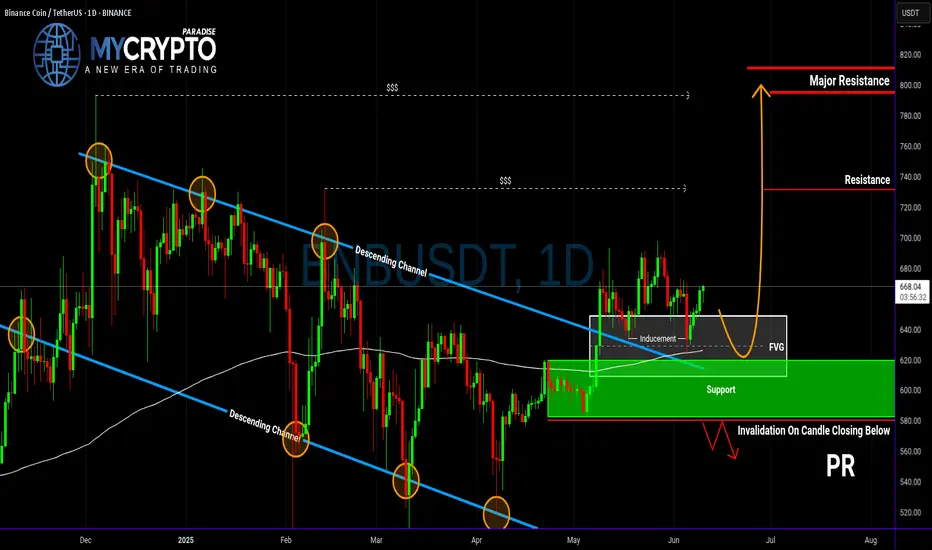
Is BNB About to Explode—or About to Collapse?Yello Paradisers! Could this be the beginning of the next BNB rally, or just another classic trap to liquidate early longs before the real move begins? Let’s dive into this high-probability setup before it’s too late.
💎BNBUSDT is currently showing good signs of bullish continuation. The price has successfully broken out of a descending channel and performed a precise retest of that structure—an early confirmation of strength. Following this, we’ve seen a strong reaction from a Fair Value Gap (FVG) and the 200 EMA, both of which align perfectly with the inducement taken just before the bounce. This confluence of technical signals significantly increases the probability of a sustained bullish move in the near term.
💎If price pulls back from current levels, it could offer us a more attractive risk-to-reward opportunity for long entries. Traders who are targeting higher RR ratios, such as 1:2 or beyond, may prefer to wait for a deeper pullback into our predefined support zone for a cleaner entry. This zone remains critical for maintaining our bullish bias.
💎However, if the price breaks down and we see a full candle close below that support zone, the entire bullish scenario becomes invalid. In such a case, it would be more prudent to stay on the sidelines and wait for a clearer and more favorable price action setup to emerge before jumping back in.
We are playing it safe right now. If you want to be consistently profitable, you need to be extremely patient and always wait only for the best, highest probability trading opportunities.
MyCryptoParadise
iFeel the success🌴
BNB wait for entry
BNB has been consolidating around its current weekly support level for over a year.
Such prolonged consolidation often precedes a significant breakout. Accumulating at this key support zone could present a strong opportunity for long-term positioning.
For short-term trades, it’s best to patiently wait for price to trigger the setup outlined in the chart.
Disclaimer:
This analysis is based on my personnal views and is not a financial advice. Risk is under your control.

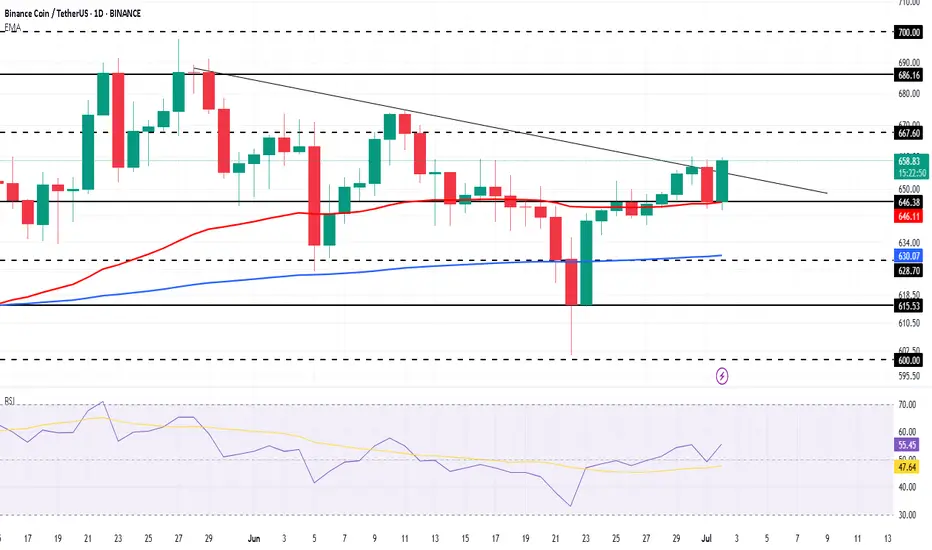
BNB Price Today: Downtrend Ends As Bullish Momentum Strengthens
BNB is currently priced at $658 , showing resilience despite market volatility. However, it’s facing a micro downtrend this month. The positioning of the exponential moving averages (EMAs) below the candlestick indicates a potential bullish trend.
This pattern suggests that if BNB can maintain its current price, there could be an upward movement, making it a favorable outlook for investors despite the ongoing market uncertainty.
For BNB to regain bullish momentum, breaking free from the downtrend is key. A bounce off $646 support could help BNB target $667 , which has proven difficult since May.
The RSI remains above neutral, signaling growing buying pressure that could fuel the uptrend. A successful breach of $667 into support would confirm a more optimistic outlook for the coin.
If market conditions worsen, BNB risks dropping below the $646 support . In this scenario, the next levels of support at $628 and $615 would be tested.
A break below these levels could invalidate the bullish outlook, leading to further declines. Investors should stay alert to shifts in broader market sentiment.
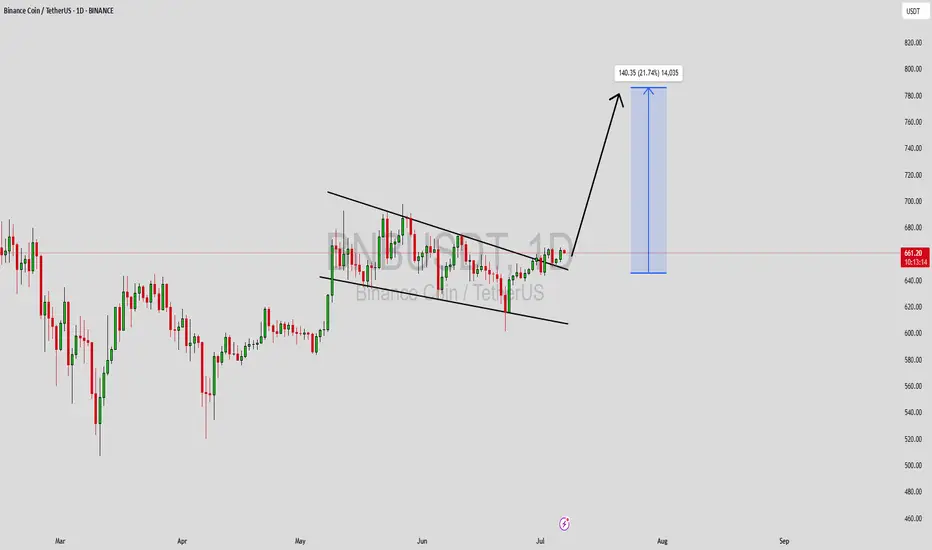
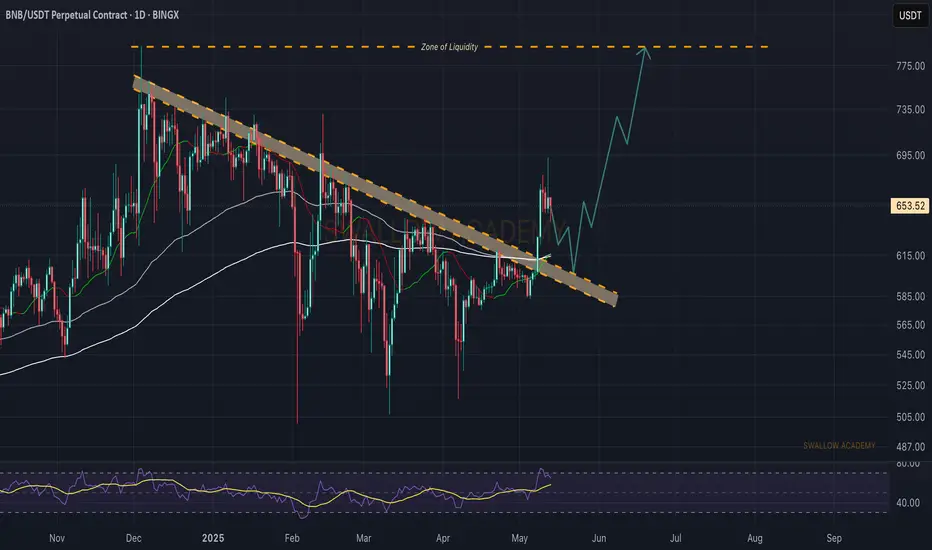
Binance Coin (BNB): Breakout Happening, $800 IncomingBNB coin has had a nice breakout recently, breaking from the local resistance trend, and now we are seeing some sort of weakness kicking in. Ideally we should see a proper retest of that broken zone target will remain the same for us here, $800.
Swallow Academy
HolderStat┆BNBUSD came out of the wedgeBINANCE:BNBUSDT just cleared a multi-week wedge resistance, signaling a bullish breakout above $635. The price is now poised to retest the upper channel boundary near $700–730. If bulls maintain momentum, this breakout could mirror prior impulsive legs higher, especially following similar consolidation patterns earlier this year.
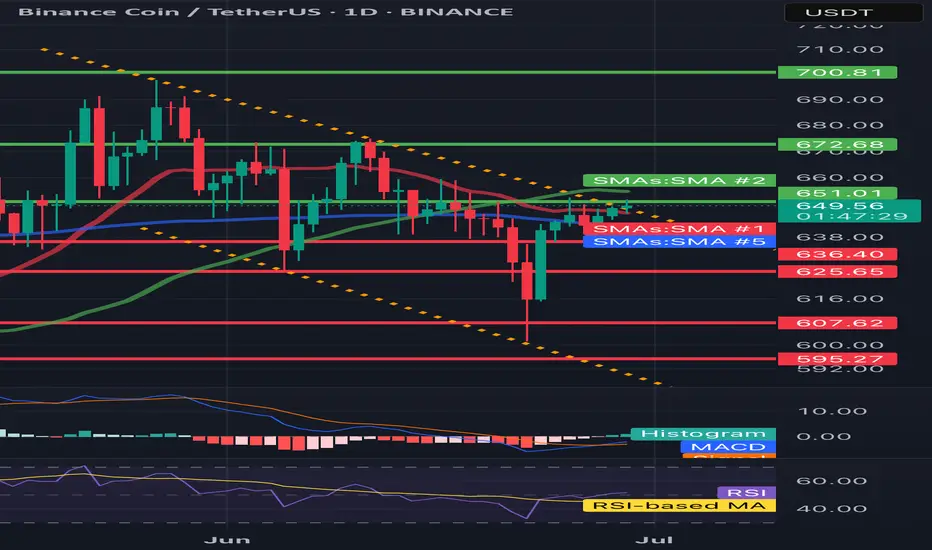
BNB/USDT 1D🕵️♂️ General context
• Steam: BNB/USDT
• Price: 649.52 USDT
• Time: 1D (daily interval)
• Currently, the reflection is underway after the inheritance, but the technical situation remains uncertain.
⸻
📈 Trend and market structure
• You can see a previous strong drop (visible long red candles).
• Currently, reflection is underway to the level of technical resistance (approx. 650–672 USDT).
• A medium -term inheritance trend is still in force - marked with an orange interrupted line of decreasing (inheritance) trend.
⸻
📊 Technical levels
🔹 Opora (green levels):
1. 651.01 USDT - the first tested resistance (current price right next to it).
2. 672.68 USDT - another resistance, above SMA (2), historically strong level of sales.
3. 700.81 USDT - strong psychological and technical level, tested in the past.
🔻 Support (red levels):
1. 636.40 USDT - short -term support (price maintaining just above this level).
2. 625.65 USDT - key support - if it is broken, a possible test of lower levels.
3. 607.62 and 595.27 USDT - subsequent support, where purchases appeared earlier (Long Knoty).
⸻
📉 Technical indicators
🔵 MacD
• Histogram comes out of red - a potential signal of Momentum change to upward.
• The MacD line begins to turn up to the signal line - possible Bullly Crossover soon (buy signal).
🟣 RSI
• RSI oscillates around line 40-50-it is a neutral zone with a slight tilt down, but RSI-Based has a possible reflection.
• Lack of purchase or sale - suggests that traffic can go both ways.
⸻
🔃 Medium walking (SMAS)
• The price is tested by several medium (green, red, blue line):
• SMA (1) and SMA (5) are similar and flat - no clear short -term trend.
• SMA (2) acts as a strong resistance at 672 USDT.
• Need to break out over 672.68 to recognize that the trend can turn around.
⸻
✅ Applications - technical scenarios
🔼 Bullish (upward) scenario:
• Crossing the level 651–672 USDT and closing the daily candle above.
• Confirmation by RSI> 50 and MacD crossover.
• Target: 700–710 USDT.
🔽 Bearish (inheritance) scenario:
• Price rejection with current resistance and descent below 636 → 625 USDT.
• If 625 falls, a possible drop in around 607/595 USDT.
• RSI may then fall into the sale zone.
⸻
🧠 Neutral / swing strategy
• Currently, the market in potential consolidation between 625 and 672 USDT.
• You can consider:
• Buying at the lower consolidation limit (625–636) with a stop-loss below 620.
• Short or Take Profit at the upper limit (670+) until it breaks out.
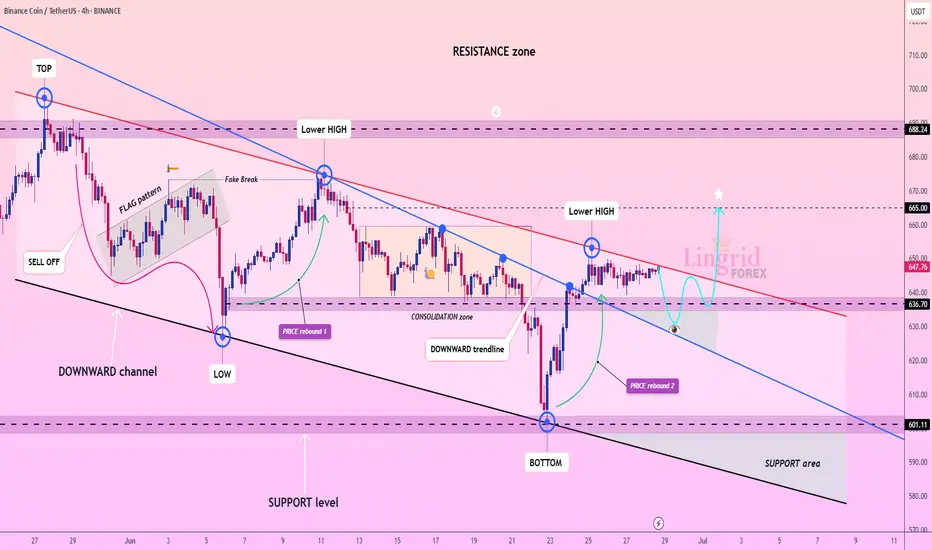
Lingrid | BNBUSDT breakout Setup. Preparing for Bullish Surge? BINANCE:BNBUSDT is facing strong resistance below the red descending trendline, repeatedly forming lower highs as it struggles to break above 650. The price is coiling between the 636 and 648 zones, hinting at a potential breakout or breakdown move. A clean rejection could drag price back to the 601 support area, while a surge above 650 opens the path toward 665.
📈 Key Levels
Buy zone: 636–640
Sell trigger: rejection from 648 or breakdown below 636
Target: 665
Buy trigger: breakout and close above 650 with volume
💡 Risks
Range continuation may trap breakout traders
Failure to hold 636 could accelerate downside
Resistance at 665 may cap bullish move short-term
If this idea resonates with you or you have your own opinion, traders, hit the comments. I’m excited to read your thoughts!
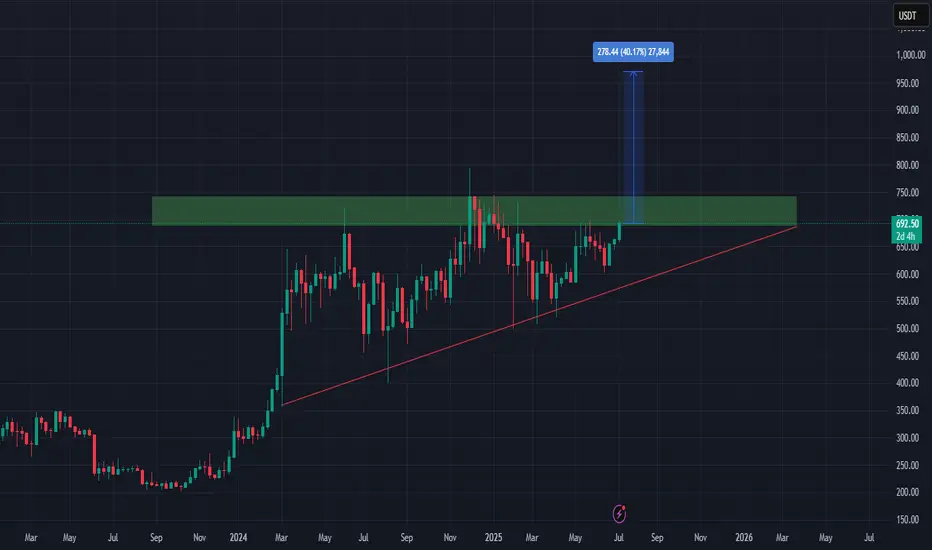
BNB/USDT – Ascending Triangle Breakout Setuphi traders
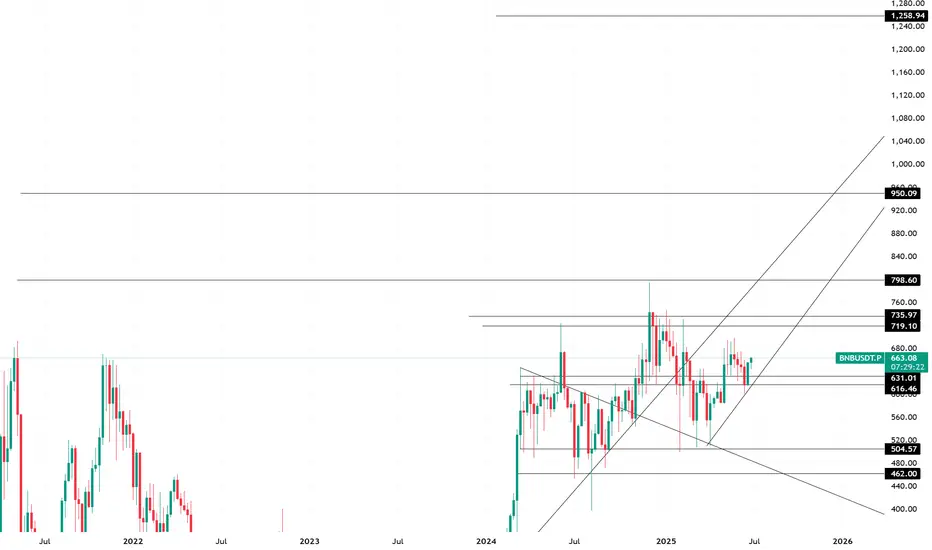
The BNB/USDT chart is displaying a classic ascending triangle pattern, which typically signals a potential bullish breakout. This pattern has formed over the past year, characterized by a series of higher lows (shown by the rising red trendline) while repeatedly testing a strong horizontal resistance zone around $690–$730 (highlighted in green).
BNB is currently trading near the upper resistance boundary at $692.85, showing signs of bullish momentum. A successful breakout above the $730 resistance level could confirm the ascending triangle breakout and trigger a strong upside move.
Target & Potential Move:
Breakout target: ~ $950 - $1,000
Measured move: 40% from the breakout point, aligning with the height of the triangle
Summary:
Pattern: Ascending Triangle (bullish)
Breakout Confirmation Level: $730+
Potential Target: $1,000
If the breakout is confirmed with strong volume and momentum, BNB could rally sharply in the coming weeks. Traders should watch for confirmation before entering.