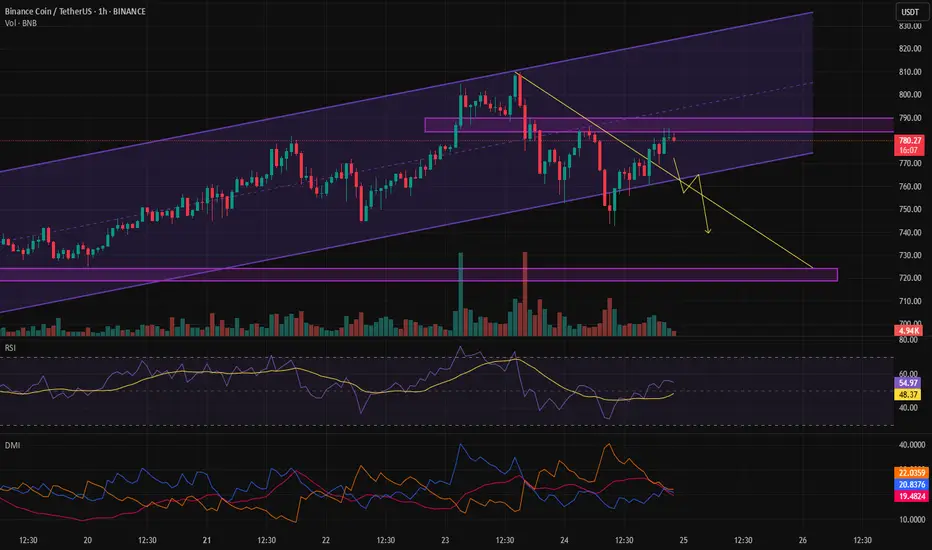
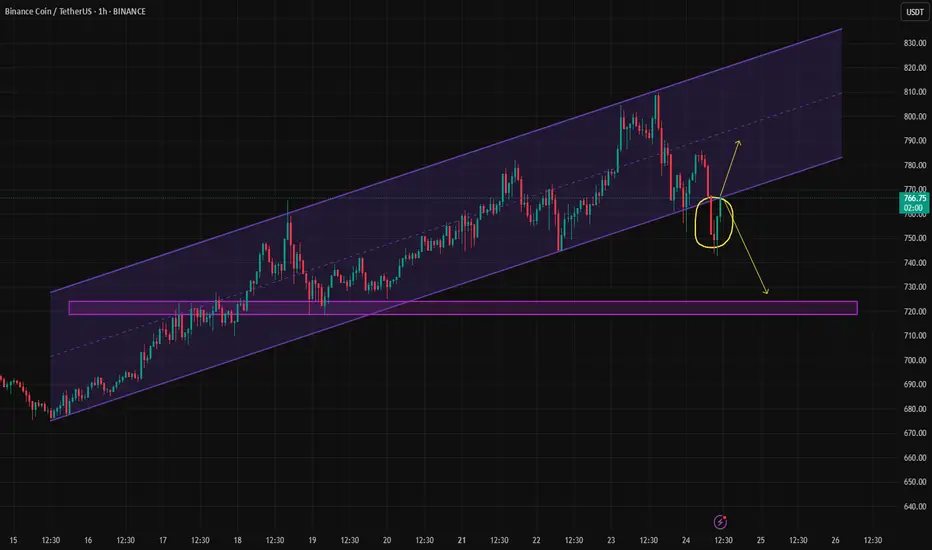
The sell signal is about to be triggered.Considering the weakness in the trend, if the price moves toward the bottom of the channel one more time, there's a possibility of the channel breaking to the downside.
BNBUSDT trade ideas
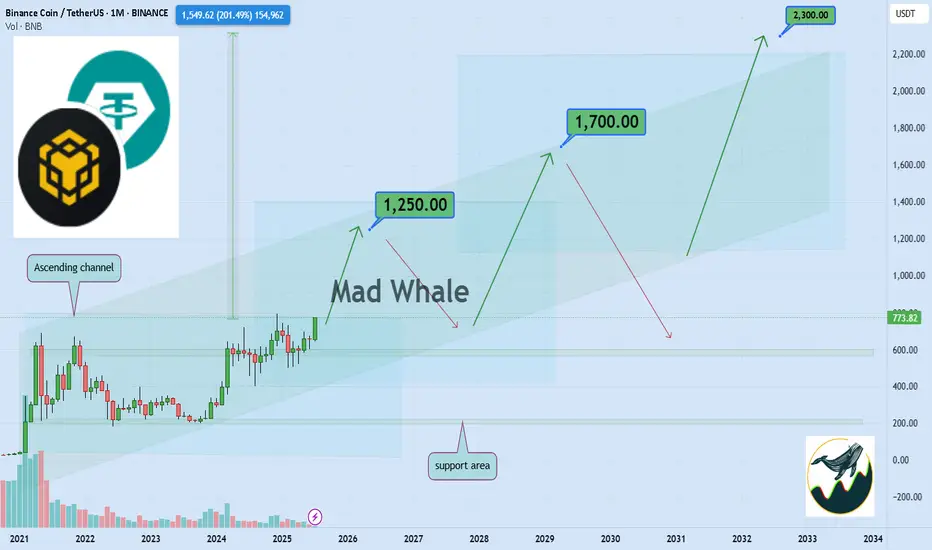
Massive Breakout Coming for BNB? Eyes on 1250, 1700, 2300 LevelsHello✌
Let’s analyze Binance Coin’s upcoming price potential 📈.
BINANCE:BNBUSDT , I expect an upward bullish trend in the long term.
I have three main targets in this analysis: $1250, $1700, and a final target of $2300. These targets could potentially be reached over a period of 2 to 6 years.
The price may form parallel channels along the way, which are shown on the chart. I also expect the current upward bullish channel to remain valid throughout this movement.
✨We put love into every post!
Your support inspires us 💛 Drop a comment we’d love to hear from you! Thanks , Mad Whale🐋
🐋Many of the points and levels shown on the chart are based on personal experience, feeling, and over 7 years of research and daily study of crypto charts.
Some of the lines, channels, and price zones are drawn to make the chart easier to understand and to help imagine possible future price movements.
I’ve also included one very big drop in price even bigger than the others because in the crypto market, it’s common for prices to suddenly fall hard and push out small investors and traders with positions.
The targets on the chart are not guaranteed; they might be reached, or they might not.📚
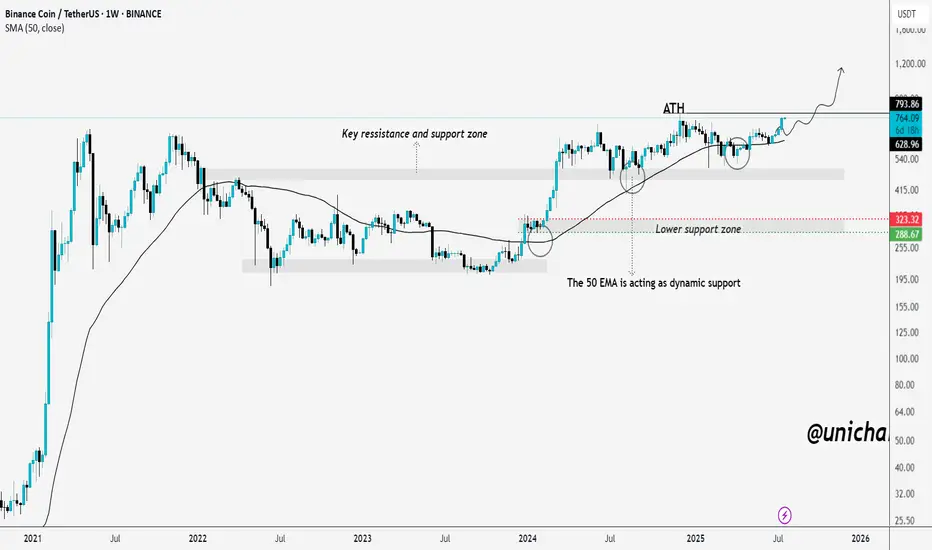
BNB on the Brink of a Breakout – ATH in Sight!We told you earlier — mark our words. BNB is now on the verge of breaking into a new all-time high, and the chart has been signaling this move for months.
The price has consistently respected the key support-resistance zone around $500–$540, and the 50-week EMA has acted as dynamic support throughout the uptrend.
Each dip into the lower support zone between $290–$320 was quickly bought up, showing strong buyer interest and demand. After several healthy consolidations and retests, BNB is once again approaching the previous ATH around $793.
If it breaks above with strong volume, we could enter price discovery mode. All the signs are aligning — and if you caught the early setups, you’re already in a great position. If not, it’s time to stay sharp and watch this breakout zone closely.
The momentum is real, and the fireworks might just be getting started.
THANKS
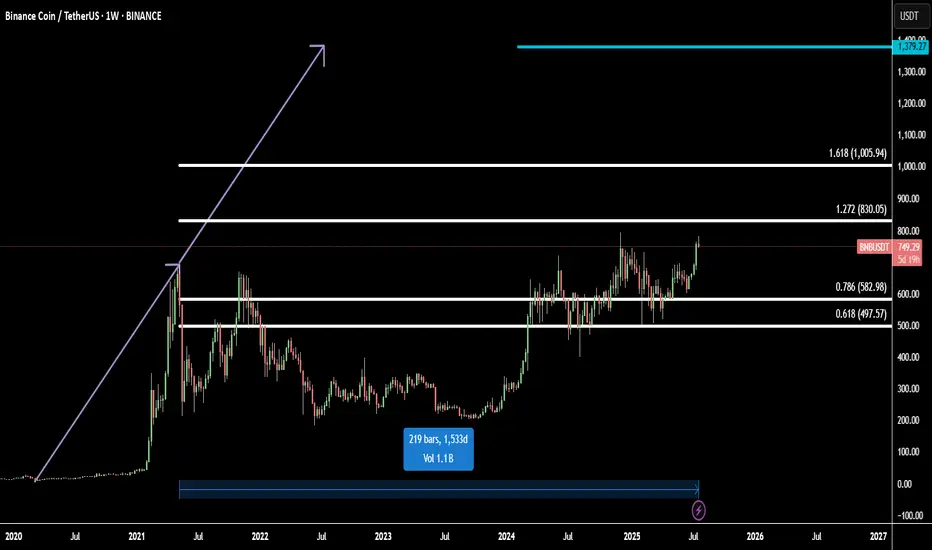
BNB Ready for All-Time High: Fibonacci + 1533-Day FlagBinance Coin (BNBUSD) is setting up for a major breakout, approaching its all-time high with strong momentum.
Technically, BNB has completed a 1533-day flag accumulation — a rare, long-term fractal consolidation that often precedes explosive moves. This massive base acts as a launchpad for the next bullish leg.
Using Fibonacci extensions, we identify two major upside targets:
Target 1: 1.272 Fib – 830.05 - the first resistance and profit zone
Target 2: 1.618 Fib – 1005.94 - key bullish extension from breakout range
Final Target: 1379.27
The final target is projected using fractal symmetry from previous bullish expansions, aligning with the broader market cycle and BNB’s historical price action.
This setup suggests a high-probability move toward new all-time highs and beyond, supported by strong technical structure and breakout energy.
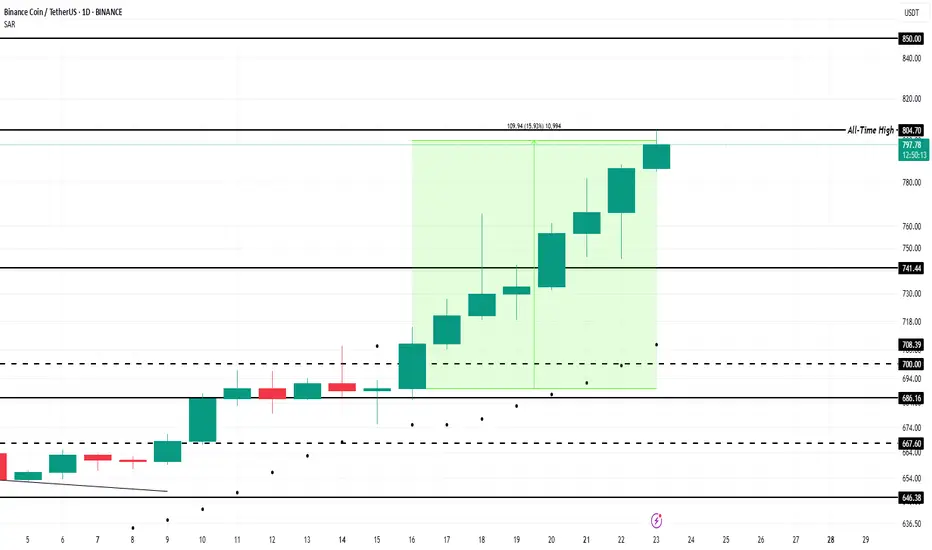
BNB Price Forms New All-Time High Above $800; Ends 7-Month WaitBINANCE:BNBUSDT price reached $804 today after a 16% increase over the past week, marking a new ATH . The altcoin has successfully ended a long period of consolidation and now stands at $799.
Its recent price movements indicate strong upward momentum, suggesting the potential for further gains. For nearly seven weeks, BINANCE:BNBUSDT has seen consistent accumulation . This trend is reflected in the exchange net position change, which shows growing investor interest in the altcoin
The bullish market sentiment is helping BINANCE:BNBUSDT break through key resistance levels. If this momentum continues, BNB could reach the $850 mark , a psychological milestone for the altcoin. This level could attract more investors and provide further price support, pushing BNB higher in the coming days.
However, should BNB holders decide to secure profits , the altcoin could face a price pullback. If selling pressure intensifies, BINANCE:BNBUSDT may slip below its current support level of $741 , which would invalidate the bullish outlook. A drop to this level would suggest a shift in sentiment, likely leading to a market correction.
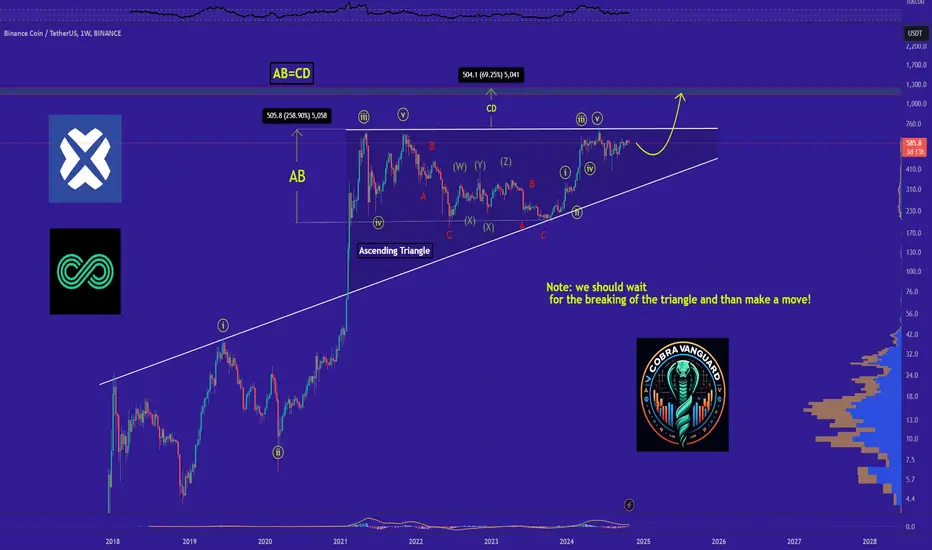
Can BNB reach around $1000 ?...The BNB is in a ascending triangle now which means the price will increase and also It is expected that the price would at least grow as good as the measured price movement(AB=CD)
Note: we should wait for the breaking of the triangle and than make a move!
See my first anaysis on BNB in 2020
✨We spend hours finding potential opportunities and writing useful ideas, we would be happy if you support us.
Best regards CobraVanguard.💚
_ _ _ _ __ _ _ _ _ _ _ _ _ _ _ _ _ _ _ _ _ _ _ _ _ _ _ _ _ _ _ _
✅Thank you, and for more ideas, hit ❤️Like❤️ and 🌟Follow🌟!
⚠️Things can change...
The markets are always changing and even with all these signals, the market changes tend to be strong and fast!!
Here I buy Binance Coin at $800Here I buy Binance Coin at $800
buy orders starting at $800
sell orders getting filled
binance coin supply shock is getting triggered
right now. Time to make binance coin great again
if sardines are thinking im done with altcoins, they are dead wrong
there are many to be bought still
THE THIRD GUY
t.I usher baby
hey, hey
hey what's happenin e'erybody
i hope they get my good siiiiide
you know i gotta look good when i walk out the house
you know i know the camera's following
i know they taking pictures, right drama?
ay man you watch it I live it you dig that
yall sit back relax get some popcorn man
im gonna make it a good show you dig that
this goin make a helll of a movie huh
my life your entertainmeeeeeeeeeent
you watch while I live iiiiiiit
i walk they follow
i talk they holla
just here for your amusemeeeeent
my life you entertainmeeeeent
you watch while i live iiiiit
you wait for me to lose it
I guess i'm just here for your amusemeeent
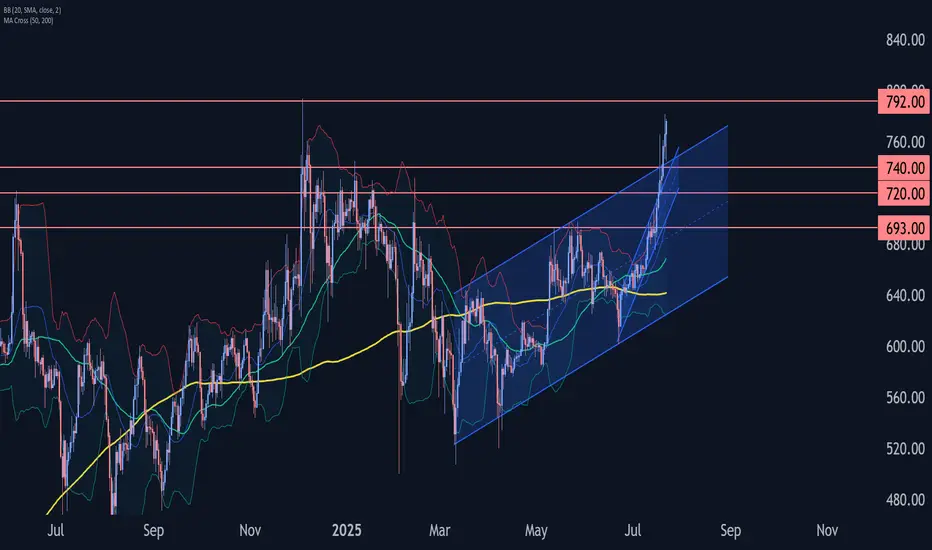
BNB Wave Analysis – 22 July 2025- BNB rising inside sharp impulse wave C
- Likely to rise to resistance level 792.00
BNB cryptocurrency continues to rise inside the sharp upward impulse wave C, which previously broke through the 3 strong resistance levels 693.00, 720.00 and 740.00.
The breakout of the resistance level 720.00 coincided with the breakout of the daily up channel from June – which accelerated the active impulse wave C.
Given the strong daily uptrend, BNB cryptocurrency can be expected to rise further to the next resistance level 792.00 (former multi-month high from last December).
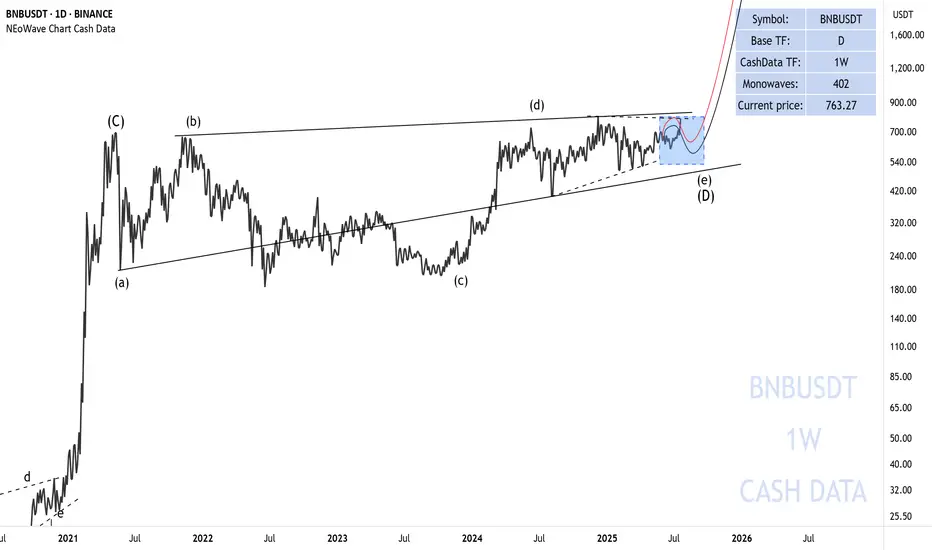
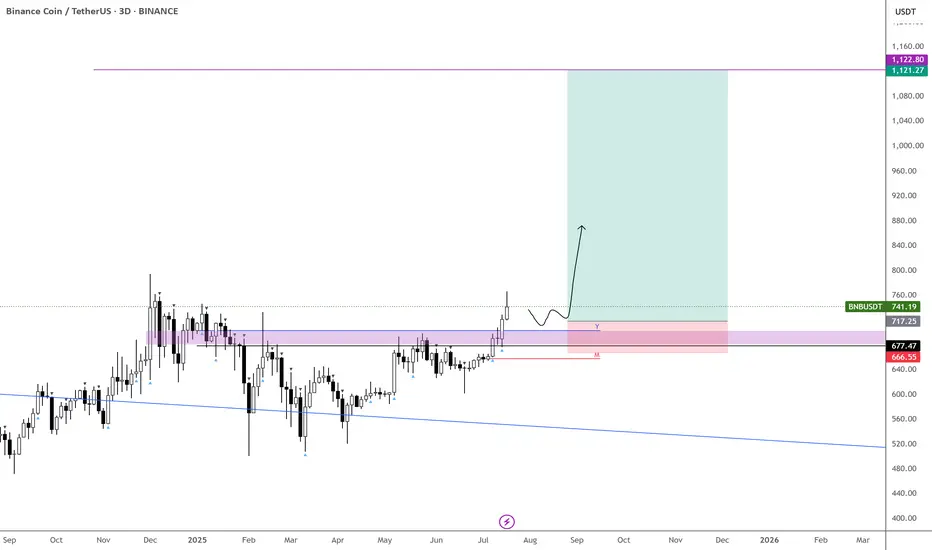
BNB is getting ready to riseThe first bullish move I was expecting for BNB has taken place and it looks like we should be waiting for the formation of wave-e of (e).
After the completion of wave-(e), we expect a big rise for BNB.
Good luck
NEoWave Chart
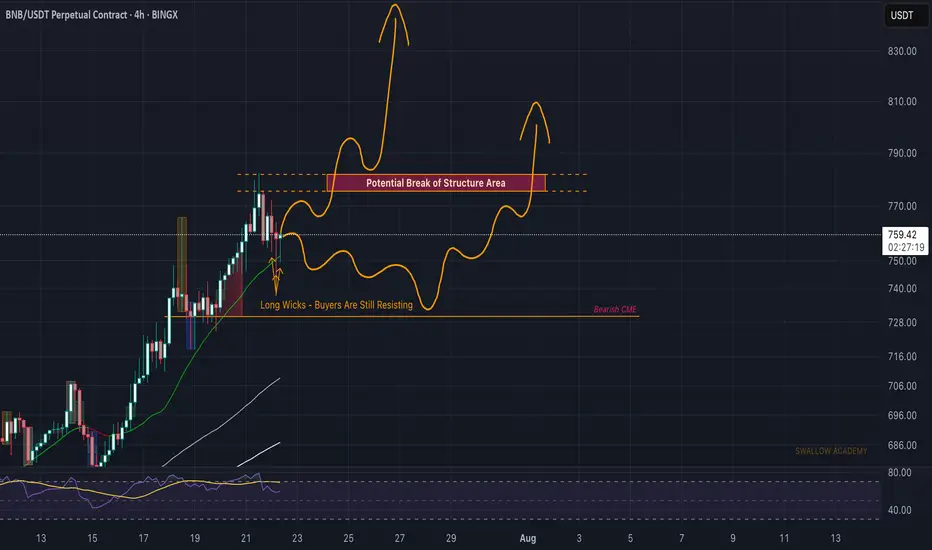
Binance Coin (BNB): Bearish CME + Possible Buying OpportunityBuyers are still showing resistance on BNB while sellers are slowly leading the price down; what we see is another buy-side movement happening very soon.
What we are looking for is either a touch to that bearish CME gap, which would fill the gap, or just an immediate movement from the current zone.
One way or another we are looking for that break of structure where our major buy zone would be sitting. If we fill that CME, then there might also be a good buying opportunity if we form MSB.
Swallow Academy
BNB ATH to 2k
At least 1200 imho
Binance continues to be one of the most profitable crypto exchanges globally.
It saw strong year-over-year revenue growth in 2024, though slightly below its high mark in 2021.
Significant profit in just the final quarter suggests savvy cost management and peak market conditions.
$BNB Is ready for $1k USDLow 700s before continuation?
This one’s been coiling up beautifully — still waiting on that strong move to hit.
OKX:CATUSDT and BINANCE:CAKEUSDT are part of the rotation I’m betting on.
BINANCE:BNBUSDT has one of the strongest consolidation structures among high caps — and it’s also one of the biggest laggards.
Looks like a setup worth the risk.
BNB Binance Coin: Lesson 15 methodology did the job again
Lesson 15 methodology (annotations in sync with the chart):
1. Largest up volume wave after a while - sellers might be in there.
2. Placed AVWAP and waited for price to cross downwards and pullback again on AVWAP
3. HTMU (hard to move up) - Abnormal Speed Index 4.6S at the top
4. Entry short signal PRS with abnormal SI 4.8.2 (price has a hard time to move up - absorption)
Simple as that. Enjoy!

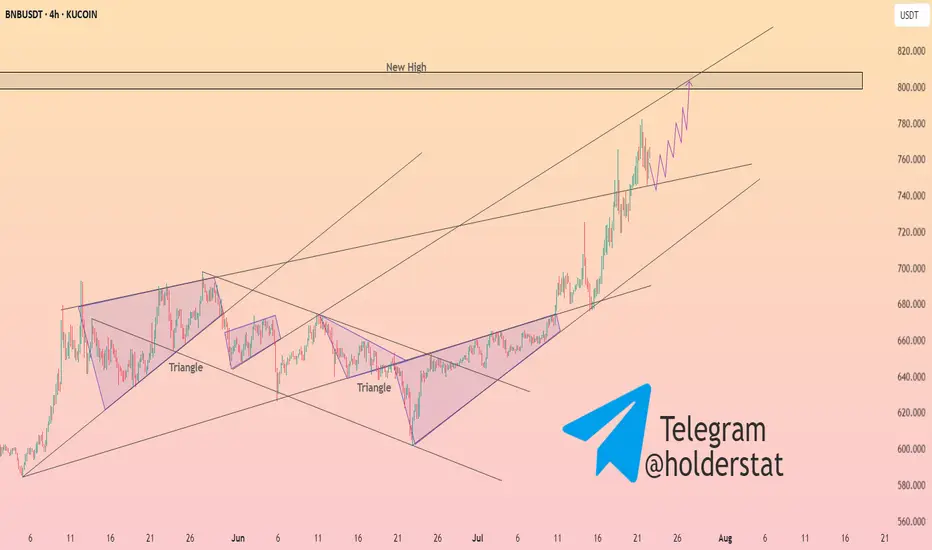
Binance coin around $760 ┆ HolderStatBINANCE:BNBUSDT has retraced from its recent high and is consolidating just above $770, a former resistance now acting as support. A bounce from this level would reinforce the uptrend and open the door for a potential push toward $860, continuing the bullish structure.

BNB LONG TRADE SETUPNew Trade Setup: BNB-USDT
LONG
Entry: 803.50 OR CMP
Target: TP1: 816.54, TP2: 829.57, TP3: 842.61, TP4: 855.64
Stoploss: 773.84
Leverage: 1X
Technical Analysis: BNB/USDT is currently facing strong support. There is a high probability of a short-term upward move.

Binance Coin (BNB): Expecting Sideways MovementBNB coin has been very choppy lately, where we've seen mostly sideways movement and then we saw eventually a liquidity movement with huge candles.
What we are expecting is further movement in the sideways channel, where eventually we will be looking for either MSB or BOS, which would result in a movement to one of the zones of liquidity.
Swallow Academy

Fake or pullback?It's really hard to guess, but if it's a fakeout, we'll head for a new high; and if it's a pullback, we might drop down to 720.
BNB SHORT TRADE SETUPBNB/USDT is currently in a correction zone. There's a high chance it will go down to grab the liquidity.

HolderStat┆BNBUSD fixed above the resistance lineBINANCE:BNBUSDT has completed a flag breakout and is consolidating above $552. Price structure supports further upside toward $590. Key support lies between $545 and $548.
$BNB LONG TERM VIEWCRYPTOCAP:BNB 🐂
DIRECTIONS: LONG 🟢
ENTRY: 732.2
SL: 710.9
MAX TP: 794.2
Margin 1-5%
If you've reached TP 1, you can set SL +. If not, set TP 2 to 1.2. ⚠️

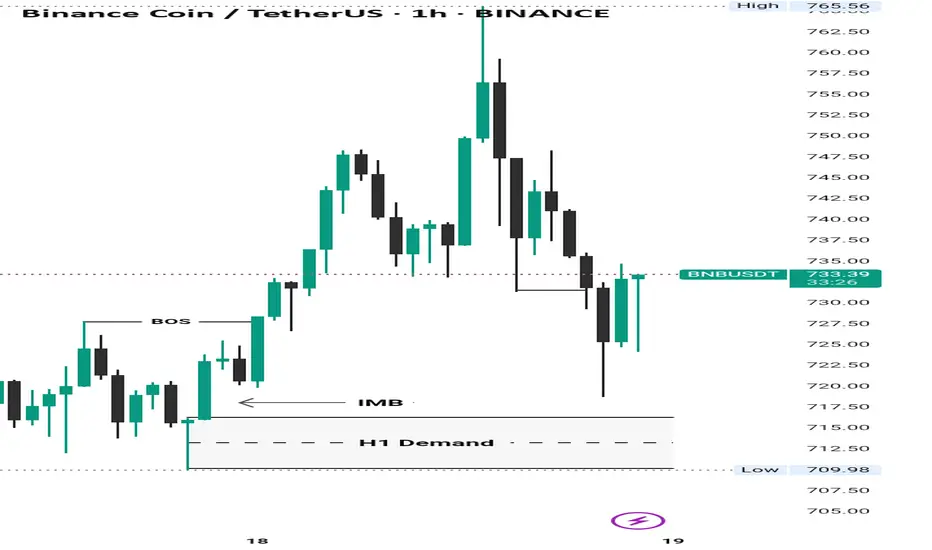
BNB LongI see a buy zone around 735 just after a significant FVG, and moreover, given the overall bullish strength of BNB, the pullback to happen next won't be a deep pullback but rather a light one. Confirming with the Fib retracement tool that zone sits well at the 38% pull back level, which is a good sign of a light bull back to continue the bullish move

BNB LongPut limit order. Liquidity will be taken. After that, it has a great chance of going up. Let's see how it plays.a great.

BNB idea BNBUSD is extremely bullish on the daily timeframe
Can the buyers sustain their buying power to the upside
Looking at the H1 for a potential movement to the upside.