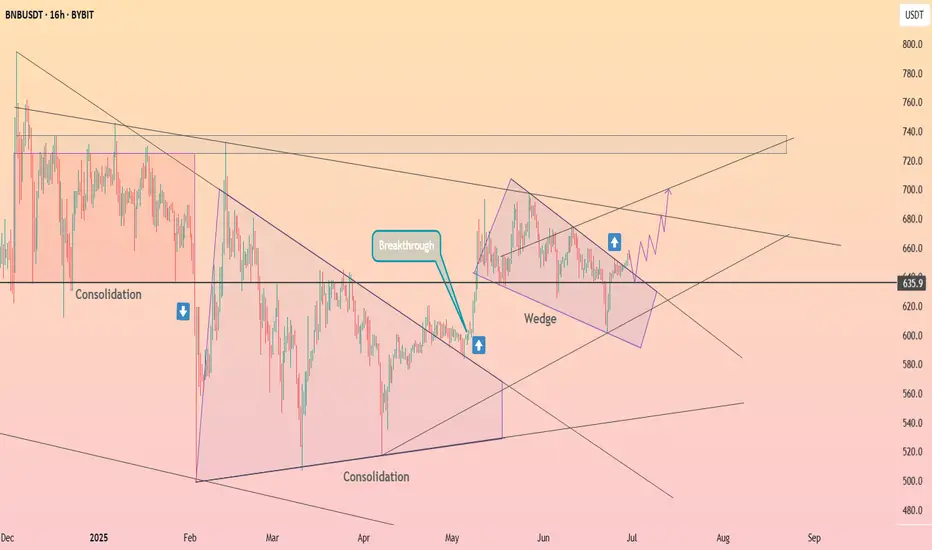
HolderStat┆BNBUSD came out of the wedgeBINANCE:BNBUSDT just cleared a multi-week wedge resistance, signaling a bullish breakout above $635. The price is now poised to retest the upper channel boundary near $700–730. If bulls maintain momentum, this breakout could mirror prior impulsive legs higher, especially following similar consolidation patterns earlier this year.
BNBUSDT trade ideas
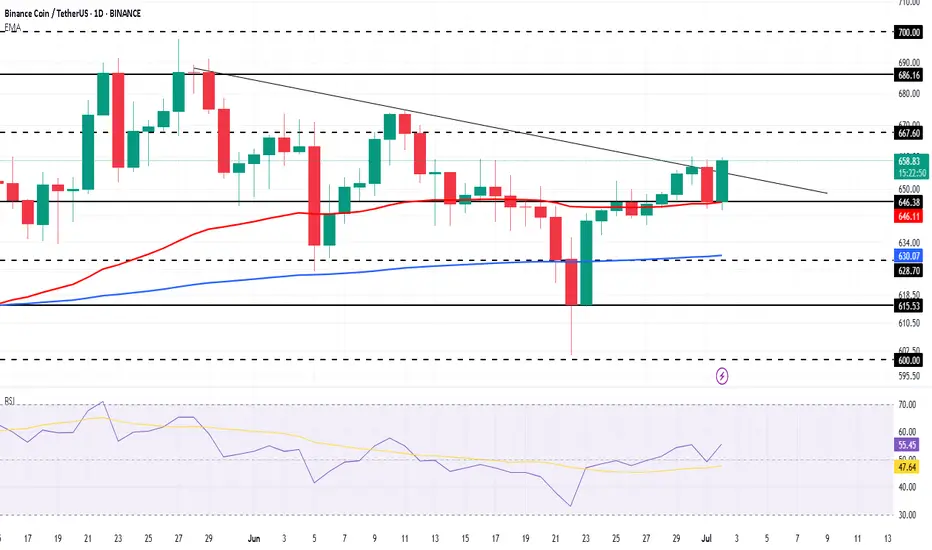
BNB Price Today: Downtrend Ends As Bullish Momentum Strengthens
BNB is currently priced at $658 , showing resilience despite market volatility. However, it’s facing a micro downtrend this month. The positioning of the exponential moving averages (EMAs) below the candlestick indicates a potential bullish trend.
This pattern suggests that if BNB can maintain its current price, there could be an upward movement, making it a favorable outlook for investors despite the ongoing market uncertainty.
For BNB to regain bullish momentum, breaking free from the downtrend is key. A bounce off $646 support could help BNB target $667 , which has proven difficult since May.
The RSI remains above neutral, signaling growing buying pressure that could fuel the uptrend. A successful breach of $667 into support would confirm a more optimistic outlook for the coin.
If market conditions worsen, BNB risks dropping below the $646 support . In this scenario, the next levels of support at $628 and $615 would be tested.
A break below these levels could invalidate the bullish outlook, leading to further declines. Investors should stay alert to shifts in broader market sentiment.
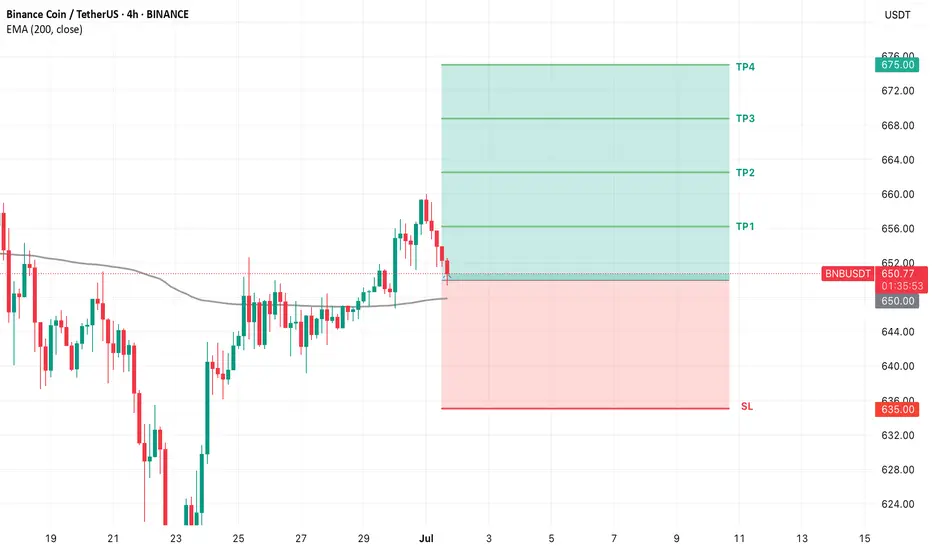
BNB USDT LONG TRADE SETUPBNB/USDT is currently holding at a strong support zone, with a high probability of an upward price move. Also EMA 200 acting as a support for BNB.
BNBUSDTCryptocurrency Futures Market Disclaimer 🚨🚨🚨
Trading cryptocurrency futures involves high risks and is not suitable for all investors.
Cryptocurrency prices are highly volatile, which can lead to significant gains or losses in a short period.
Before engaging in crypto futures trading, consider your risk tolerance, experience, and financial situation.
Risk of Loss: You may lose more than your initial capital due to the leveraged nature of futures. You are fully responsible for any losses incurred.
Market Volatility: Crypto prices can fluctuate significantly due to factors such as market sentiment, regulations, or unforeseen events.
Leverage Risk: The use of leverage can amplify profits but also increases the risk of total loss.
Regulatory Uncertainty: Regulations related to cryptocurrencies vary by jurisdiction and may change, affecting the value or legality of trading.
Technical Risks: Platform disruptions, hacking, or technical issues may result in losses.
This information is not financial, investment, or trading advice. Consult a professional financial advisor before making decisions. We are not liable for any losses or damages arising from cryptocurrency futures trading.
Note: Ensure compliance with local regulations regarding cryptocurrency trading in your region.
thanks for like and follow @ydnldn
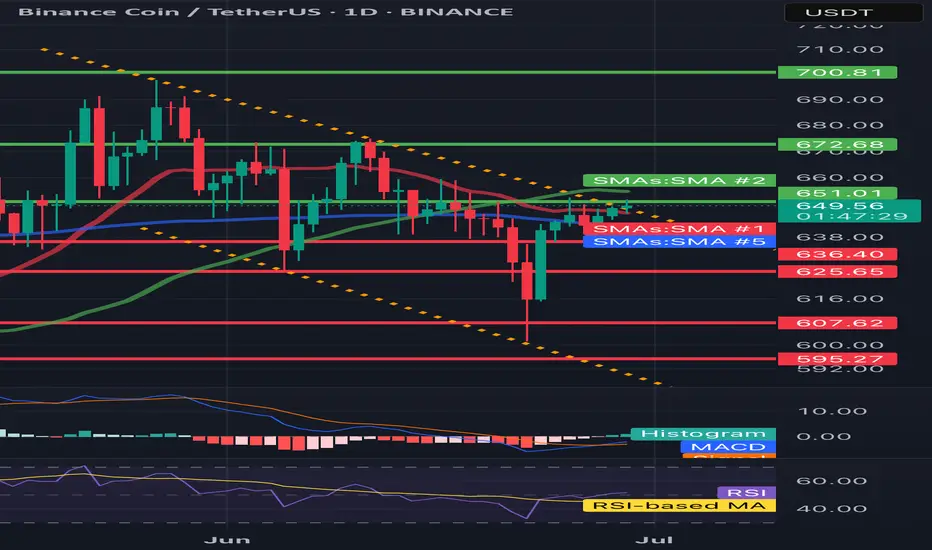
BNB/USDT 1D🕵️♂️ General context
• Steam: BNB/USDT
• Price: 649.52 USDT
• Time: 1D (daily interval)
• Currently, the reflection is underway after the inheritance, but the technical situation remains uncertain.
⸻
📈 Trend and market structure
• You can see a previous strong drop (visible long red candles).
• Currently, reflection is underway to the level of technical resistance (approx. 650–672 USDT).
• A medium -term inheritance trend is still in force - marked with an orange interrupted line of decreasing (inheritance) trend.
⸻
📊 Technical levels
🔹 Opora (green levels):
1. 651.01 USDT - the first tested resistance (current price right next to it).
2. 672.68 USDT - another resistance, above SMA (2), historically strong level of sales.
3. 700.81 USDT - strong psychological and technical level, tested in the past.
🔻 Support (red levels):
1. 636.40 USDT - short -term support (price maintaining just above this level).
2. 625.65 USDT - key support - if it is broken, a possible test of lower levels.
3. 607.62 and 595.27 USDT - subsequent support, where purchases appeared earlier (Long Knoty).
⸻
📉 Technical indicators
🔵 MacD
• Histogram comes out of red - a potential signal of Momentum change to upward.
• The MacD line begins to turn up to the signal line - possible Bullly Crossover soon (buy signal).
🟣 RSI
• RSI oscillates around line 40-50-it is a neutral zone with a slight tilt down, but RSI-Based has a possible reflection.
• Lack of purchase or sale - suggests that traffic can go both ways.
⸻
🔃 Medium walking (SMAS)
• The price is tested by several medium (green, red, blue line):
• SMA (1) and SMA (5) are similar and flat - no clear short -term trend.
• SMA (2) acts as a strong resistance at 672 USDT.
• Need to break out over 672.68 to recognize that the trend can turn around.
⸻
✅ Applications - technical scenarios
🔼 Bullish (upward) scenario:
• Crossing the level 651–672 USDT and closing the daily candle above.
• Confirmation by RSI> 50 and MacD crossover.
• Target: 700–710 USDT.
🔽 Bearish (inheritance) scenario:
• Price rejection with current resistance and descent below 636 → 625 USDT.
• If 625 falls, a possible drop in around 607/595 USDT.
• RSI may then fall into the sale zone.
⸻
🧠 Neutral / swing strategy
• Currently, the market in potential consolidation between 625 and 672 USDT.
• You can consider:
• Buying at the lower consolidation limit (625–636) with a stop-loss below 620.
• Short or Take Profit at the upper limit (670+) until it breaks out.
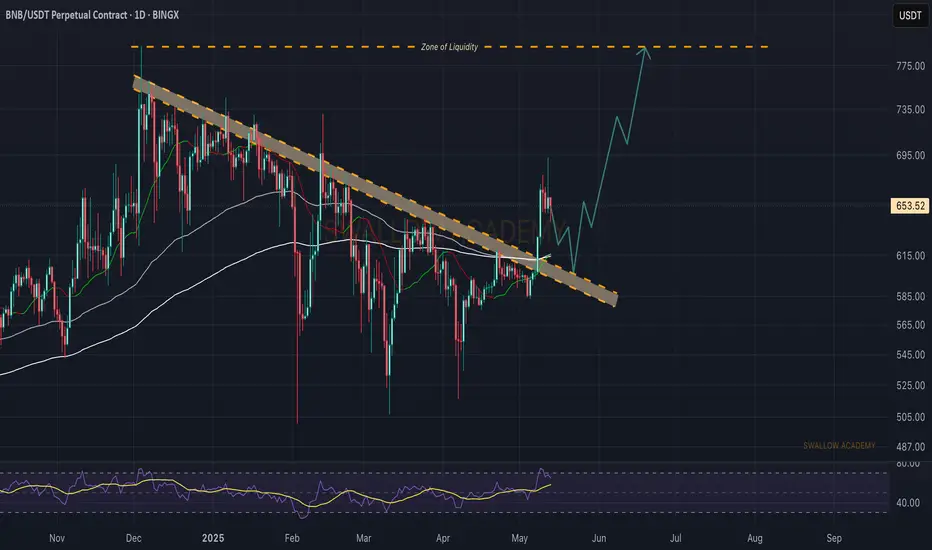
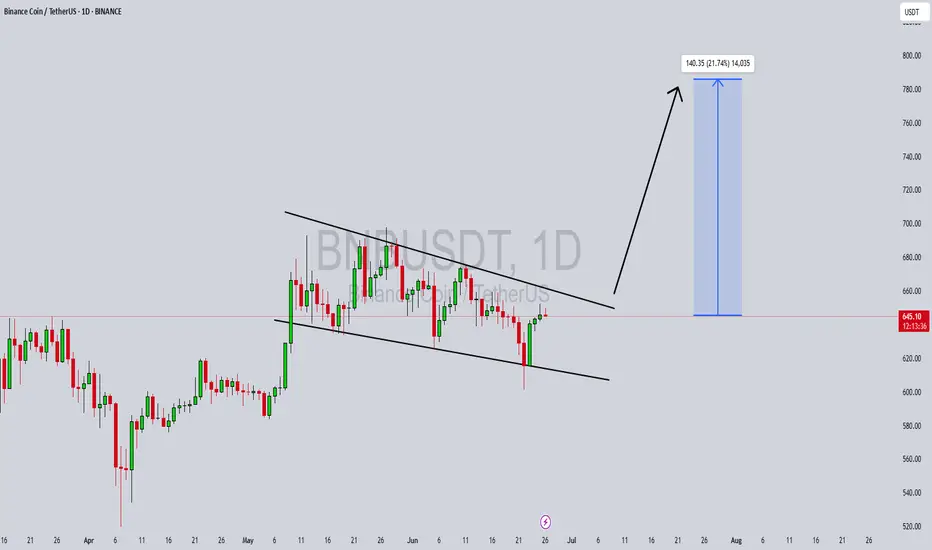
Binance Coin (BNB): Breakout Happening, $800 IncomingBNB coin has had a nice breakout recently, breaking from the local resistance trend, and now we are seeing some sort of weakness kicking in. Ideally we should see a proper retest of that broken zone target will remain the same for us here, $800.
Swallow Academy
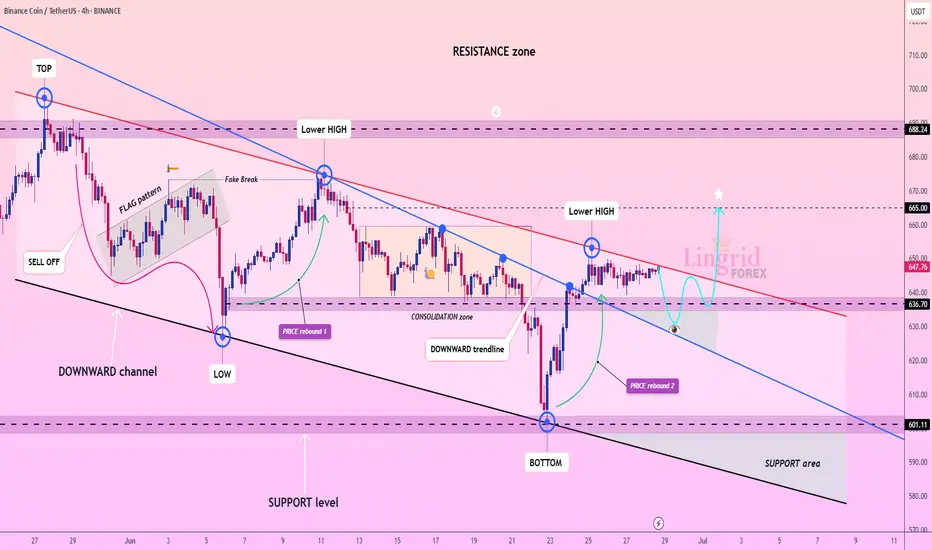
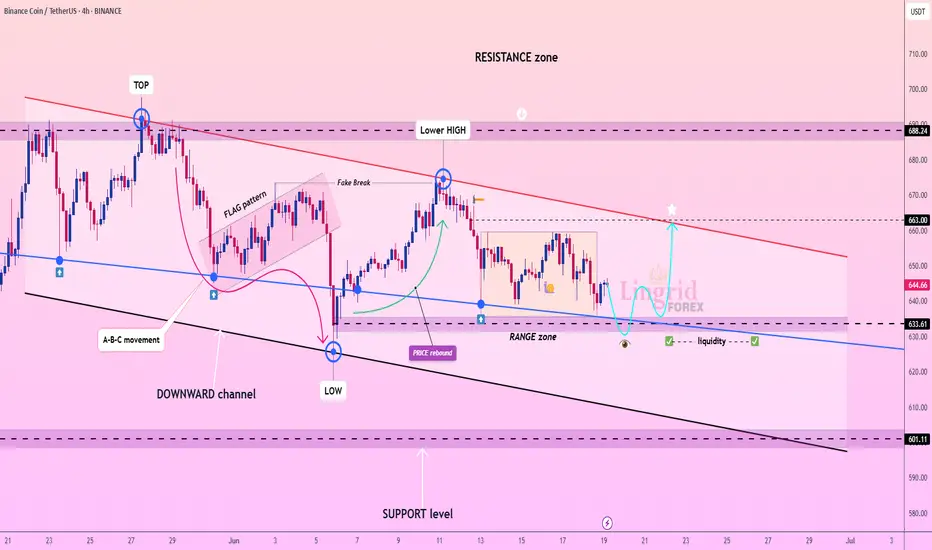
Lingrid | BNBUSDT breakout Setup. Preparing for Bullish Surge? BINANCE:BNBUSDT is facing strong resistance below the red descending trendline, repeatedly forming lower highs as it struggles to break above 650. The price is coiling between the 636 and 648 zones, hinting at a potential breakout or breakdown move. A clean rejection could drag price back to the 601 support area, while a surge above 650 opens the path toward 665.
📈 Key Levels
Buy zone: 636–640
Sell trigger: rejection from 648 or breakdown below 636
Target: 665
Buy trigger: breakout and close above 650 with volume
💡 Risks
Range continuation may trap breakout traders
Failure to hold 636 could accelerate downside
Resistance at 665 may cap bullish move short-term
If this idea resonates with you or you have your own opinion, traders, hit the comments. I’m excited to read your thoughts!
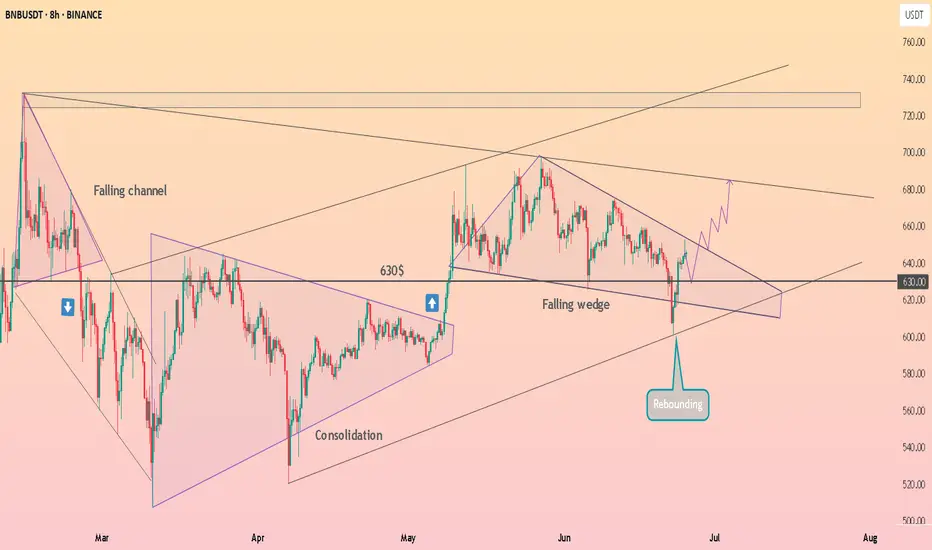
HolderStat┆BNBUSD forming the falling wedgeBINANCE:BNBUSDT on the 8h chart rebounded from a falling wedge and reclaimed the $630 support. Price structure shows growing strength as it aims for $680 next. Watch for a breakout confirmation to ignite a push toward $740.
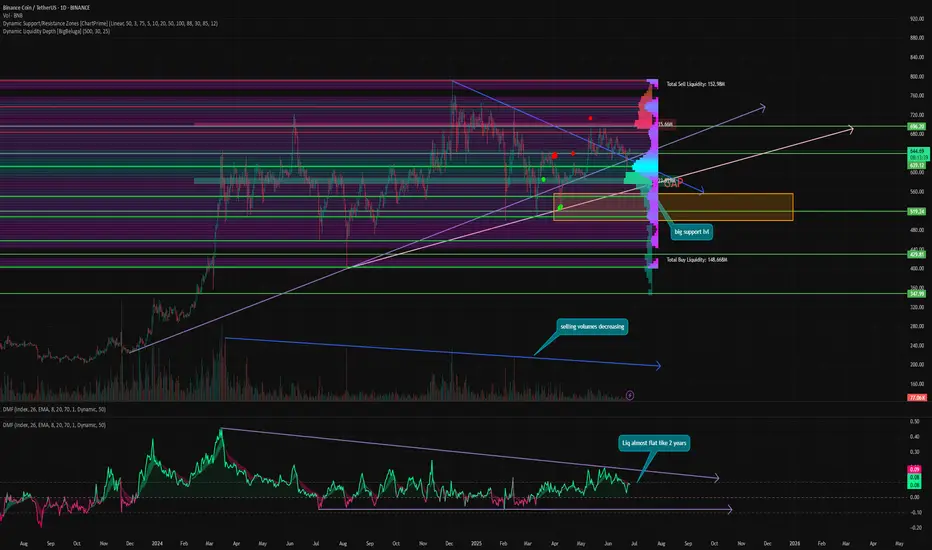
Does anyone trade this at all?⚡️ Hello, everyone! I decided to do a review of BNB. It's practically a stablecoin. But does the token have any potential other than being used for airdrops on Binance? Let's find out!
BNB has now closed the gap above, and now there is a large gap below at the $556 - $499 levels. And as we know, 99% of gaps close sooner or later.
⚙️ Metrics and Indicators:
Money Flow - is the joke about stablecoins not a joke? Liquidity has been virtually unchanged for about two years. There is a slight closing of positions, but this is not critical. Liquidity remains in a stable neutral zone.
Liquidity Depth - there is approximately the same amount of liquidity at the top and bottom. Since this token is not highly speculative, this is not surprising.
Volume - sales volumes continue to decline. Even within the correction, and when retesting the same level, volumes are already significantly lower.
Support/Resistance - the level of $611 is a strong support. It is clear that there is high buyer interest at this level.
📌 Conclusion:
The only time BNB starts to be interesting is when it falls so low that everyone suddenly remembers it. This was the case last summer, when the price fell from $700 to $400 and everyone was like, “Oh! There is such a token as BNB and it's in the top 5! It's a bit cheap, I should buy some!”
Similarly, I have no interest in BNB until the gap closes. Which is just before the $500 level, where some whale accumulation is already beginning.
🔥 Have a nice day, everyone!
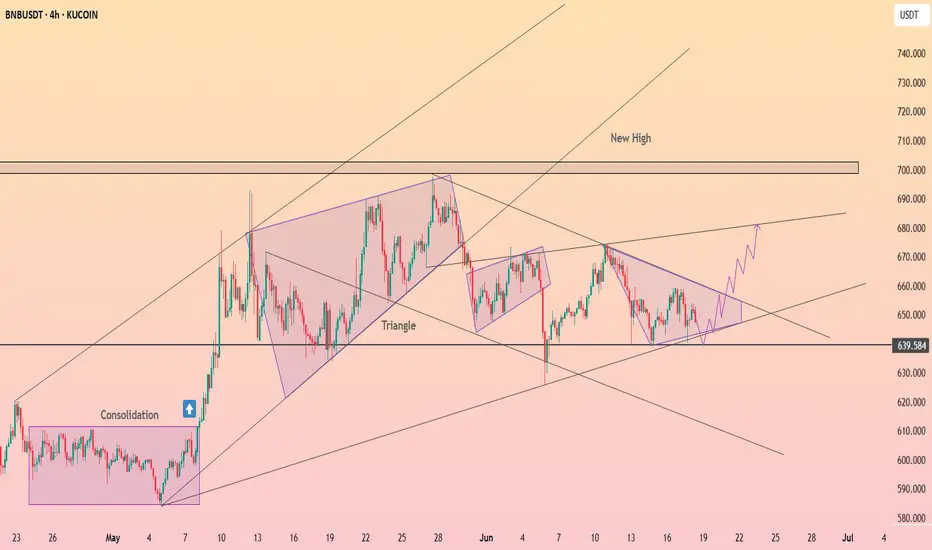
HolderStat┆BNBUSD retest of the channelBINANCE:BNBUSDT has completed a bullish reversal from the 633.4 level and is now testing upper trend resistance. A breakout from this wedge structure may lead to a rapid move toward the 680–700 region. Past triangle patterns have preceded strong rallies, and momentum indicators favor bulls. Traders will look for a breakout above 650 to confirm.
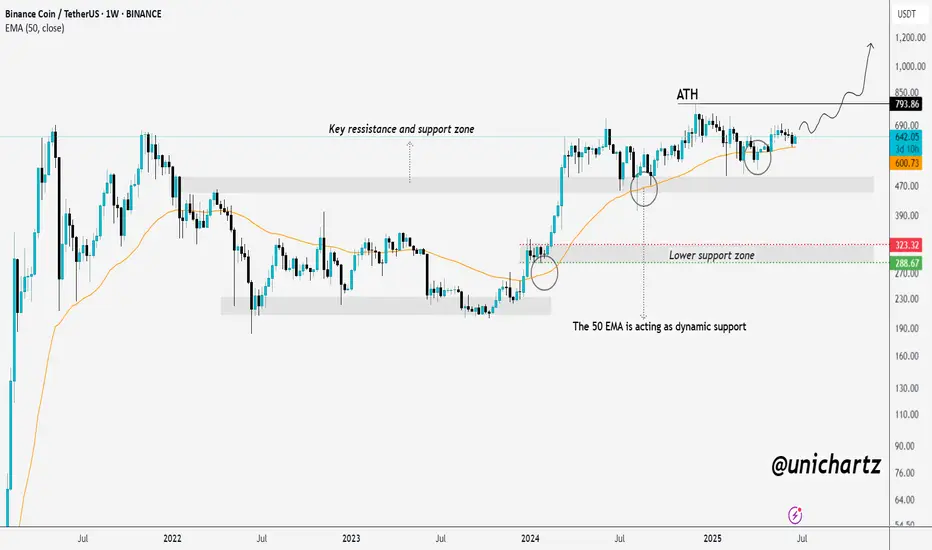
BNB to Make History Before 2026 BeginsCRYPTOCAP:BNB is setting up for something big. Price is holding strong above the rising support line, with the 50 EMA acting as dynamic support.
It's consolidating just below the all-time high — a classic sign of strength. Structure looks solid, momentum is building, and the chart favors bulls.
Mark my words — BNB will not only retest its ATH, but break it and go beyond before the year ends.
DYOR, NFA
BNBUSDT Forming Bullish Wave BNBUSDT is forming a promising bullish wave pattern that suggests a potential continuation of the upward trend in the short to mid-term. The structure is supported by consistent volume, indicating strong participation and interest from traders and investors. The price action reflects healthy higher lows and higher highs, which typically signal growing bullish momentum. Given the current setup, we can expect a conservative gain of around 10% to 20%+ as the price targets upper resistance zones.
Binance Coin (BNB), being one of the top-tier cryptocurrencies with strong utility across the Binance ecosystem, often benefits from broader market recoveries and exchange-driven demand. With overall crypto sentiment showing resilience, BNB is well-positioned to attract further inflows. The bullish wave pattern being observed could serve as a foundation for the next impulsive move upward, especially if volume continues to support the breakout structure.
The project continues to demonstrate its dominance in both fundamental and technical metrics. As market confidence in leading assets returns, BNB’s role as a utility token and its deflationary mechanisms make it particularly attractive. Technical traders will be watching for a breakout above recent highs to confirm trend continuation, ideally backed by a surge in volume and RSI strength.
BNBUSDT remains a strong candidate for traders looking for stability with upside potential. The confluence of bullish wave formation, increasing interest, and fundamental strength positions it well for a steady rise in price in the coming days or weeks.
✅ Show your support by hitting the like button and
✅ Leaving a comment below! (What is You opinion about this Coin)
Your feedback and engagement keep me inspired to share more insightful market analysis with you!
BNBUSDTPersonally, I see BNB struggling to break above that key resistance zone near 648–649. The rejection from that level, especially with decreasing momentum, makes me lean bearish in the short term. We’ve seen this zone hold back price before, and unless there's a strong breakout with volume, I think there's a higher chance we see a pullback toward the 616–618 area. I’m just watching price action closely and waiting for a clean confirmation—no need to rush a position when the structure’s already signaling hesitation.
BNB Analysis (Crypto)Here is my analysis on BNB, the native token of Binance. I'll be using ICT concepts, primarily liquidity, efficiency, PD Arrays, and premium/discount/OTE.
Hope you find it insightful in knowing where price is going to go!
- R2F Trading

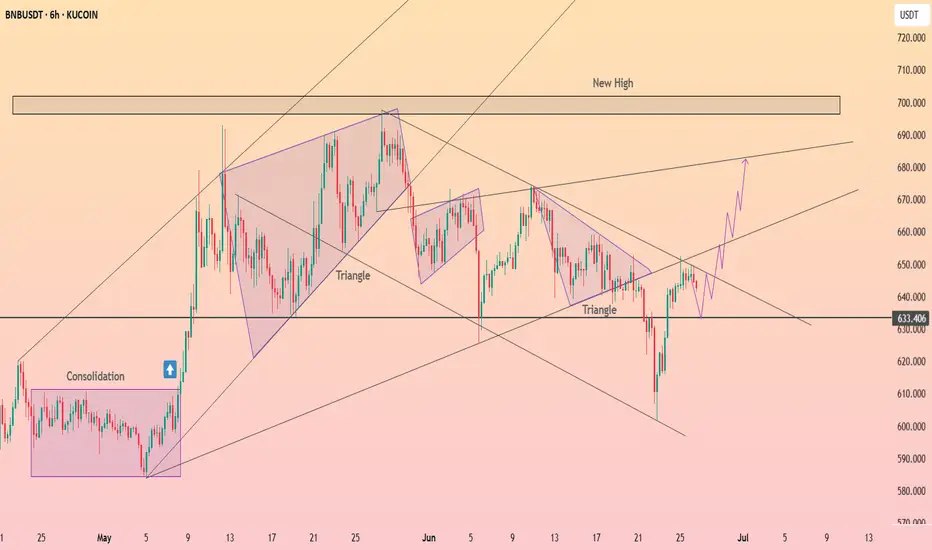
HolderStat┆BNBUSD held supportKUCOIN:BNBUSDT keeps coiling inside a contracting wedge above the $639 launchpad. A 4-h close over 650-655 can spark a thrust to 680 and revive the 700–710 “new-high” box; slip-back under 630 delays the breakout but leaves the structure intact 🚀
Lingrid | BNBUSDT buying Opportunity in Consolidation PhaseBINANCE:BNBUSDT is forming a reactive base inside the lower boundary of its descending channel, just above the 633 support zone. The current range structure suggests consolidation, with a potential for a false breakdown before an upward move. A breakout through the red descending trendline could target the 663 liquidity area.
📈 Key Levels
Buy zone: 633–638
Sell trigger: sustained move below 633
Target: 663
Buy trigger: bullish engulfing near support + breakout above range
💡 Risks
Failure to hold the 633 level could resume the channel downtrend
Rejection from the red trendline may reinforce bearish pressure
Broader market weakness could invalidate the upward scenario
Traders, if you liked this idea or if you have your own opinion about it, write in the comments. I will be glad 👩💻
BNB/USDT: Poised for a Bullish Rebound?BNB/USDT: Poised for a Bullish Rebound?
BNB has tested the 640 support zone for the third time in recent days, signaling potential strength in this area.
This level may mark the bottom of the ongoing bearish correction, with signs pointing to a possible upward movement in the coming days, as reflected in the chart.
Key upside targets to watch: 661.50, 670.50, and 678.50.
BNB has demonstrated resilience over an extended period, and the likelihood of further gains is increasing, especially with BTC maintaining strength amid rising geopolitical tensions in the Middle East.
You may find more details in the chart!
Thank you and Good Luck!
❤️PS: Please support with a like or comment if you find this analysis useful for your trading day❤️

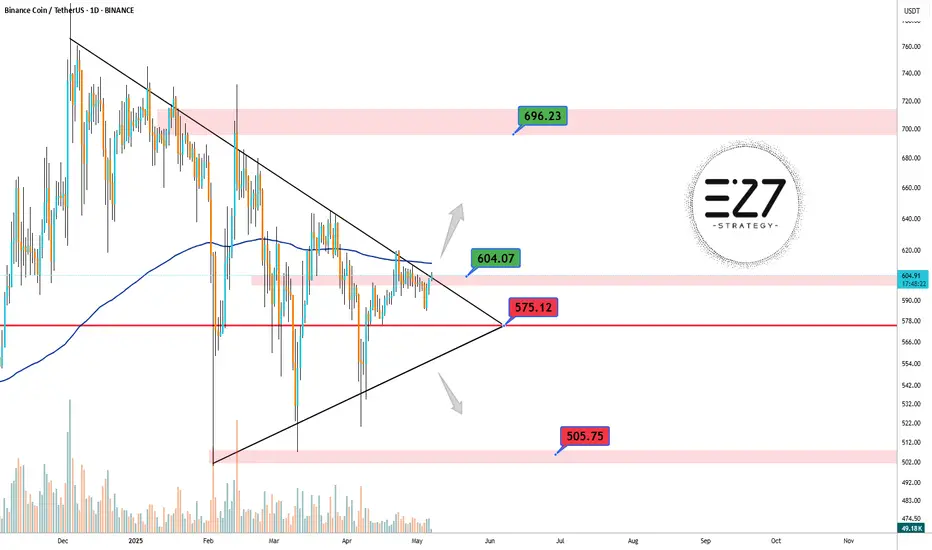
BNB Pump???On the daily chart of BNB, a symmetrical triangle has formed, and the price is approaching a breakout point. The $600–$604 zone, aligned with the 200-day moving average and the descending trendline, acts as a key resistance. A bullish breakout could push the price toward the $696 area. On the downside, the $575 support is crucial — if broken, the next potential drop could target the $505 zone. Price compression and declining volatility suggest a strong move is likely soon.
📈 A major move is coming for BNB!
🔺 Resistance: $604
🔻 Support: $575 and then $505
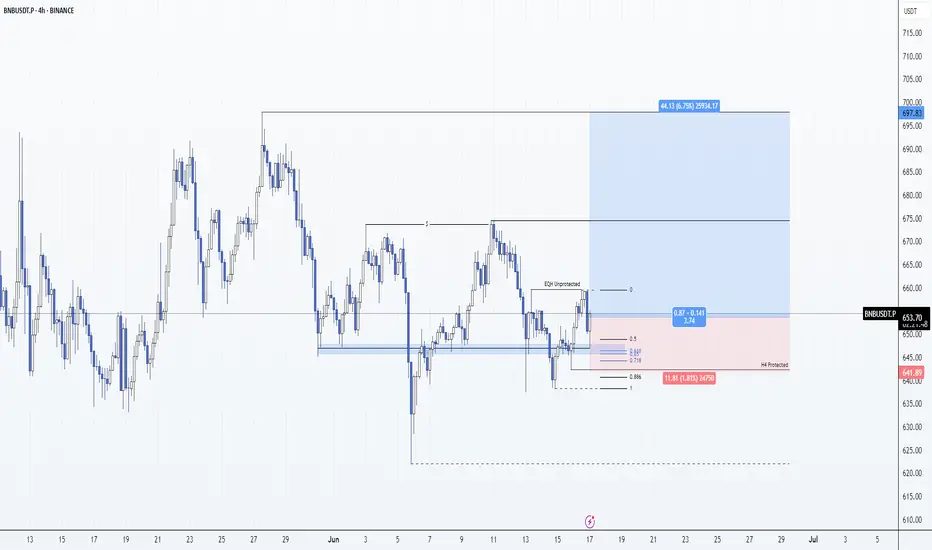
BNB: Long 17/06/25Trade Direction:
BNB Long BINANCE:BNBUSDT.P BINANCE:BNBUSDT
Risk Management:
- Risk set at approx 0.5%
Reason for Entry:
- Retrace into higher timeframe support marked
- Structure remains valid
- Unprotected equal highs DOL
- 0.5 retrace
- H1 and M30 oversold H4 Showing strength
- Banking on this being a news-based dive in price action / shakeout before continuation
- Expectation that market will continue trending higher toward $110k BTC as stated in my HTF btc chart yesterday. held 106,500 imo we now go higher.
Additional Notes:
- Risky with market being so news driven right now.
HolderStat┆BNBUSD above the $650 levelBYBIT:BNBUSDT is squeezing above the 650 breakout shelf after a flag retest, turning consolidation into up-move renewal. Maintaining 640 trend support holds bias north; clearing 670 unlocks 710-730 and blue-sky talk 🚀
BNBthe BNB weekly chart shows lack of genuine directional bias ,its best to allow the market make clear direction .
On the the weekly demand floor ,price can make a surprise visit and activate a buy.
The green buy and sell zone will be watched for potential reaction especially on the ATL AND DTL LEVELS .
WATCH 338.37
GOOD LUCK ON THE CHART
#BND #BTC #BITCOIN #CRYPTO

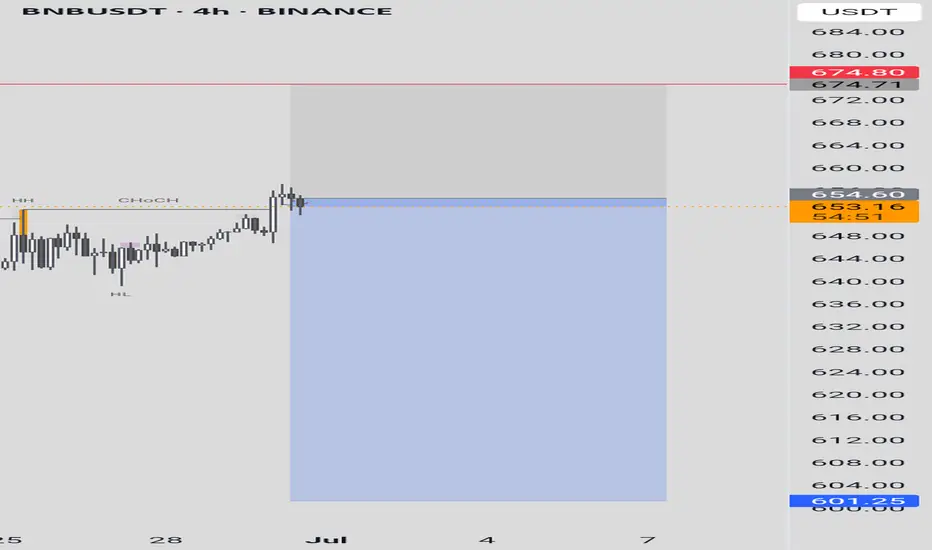
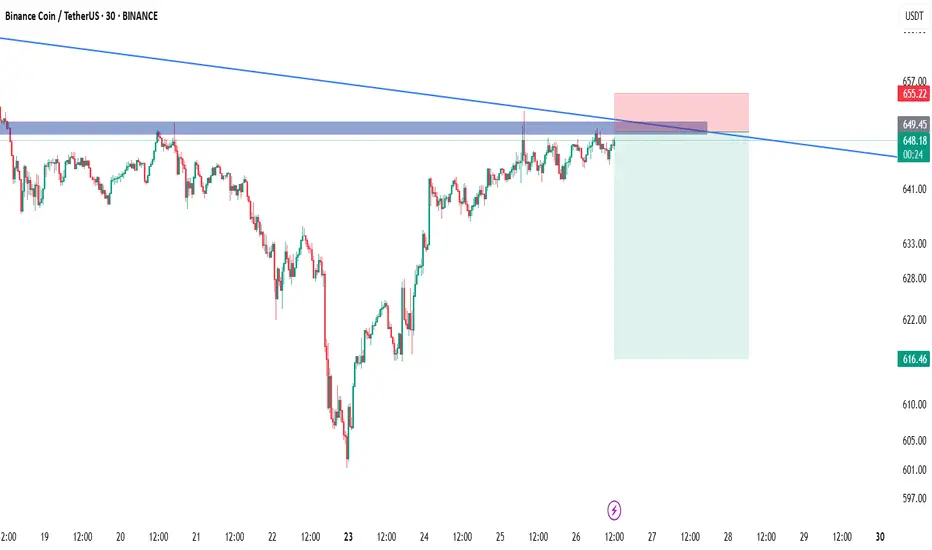
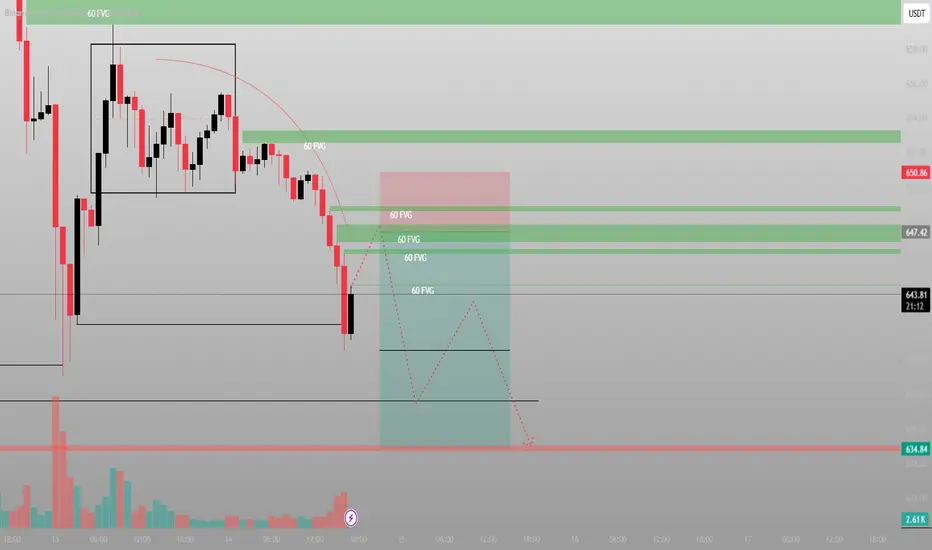
This isn’t a dump. It’s a delivery systemBNB sold off fast — but not irrationally. Look closer, and you’ll see the system at work: rejection from inefficiency, compression, and now a retest of where the last real buyers were found.
The structure:
Price swept short-term demand and wicked below local range lows with a high-volume rejection. That low was engineered — not failed.
Above us? A neatly layered series of 60-minute FVGs from 646.5 to 652.0. Every candle into that zone is a test. But the true objective is to reload short once that imbalance is filled.
Playbook:
We’re in a reactive zone now. Here’s what I’m watching:
Price pushes into the FVG cluster (646–650)
Volume dries → rejection wick → return to discounted re-entry
Aggressive scalpers might long the bounce into the FVG, but the higher-probability play is fading the inefficiency once it’s filled.
Execution:
Scalp long (optional): 643.5 → TP into 648–650
Main setup: short entry from 647.4–650.5
SL above 652.2
TP1: 640.5
TP2: 634.8
Final draw: 630.0 if structure accelerates
Patience is what separates the move from the moment.
Final thought:
“This move didn’t break structure. It exposed the next one.”
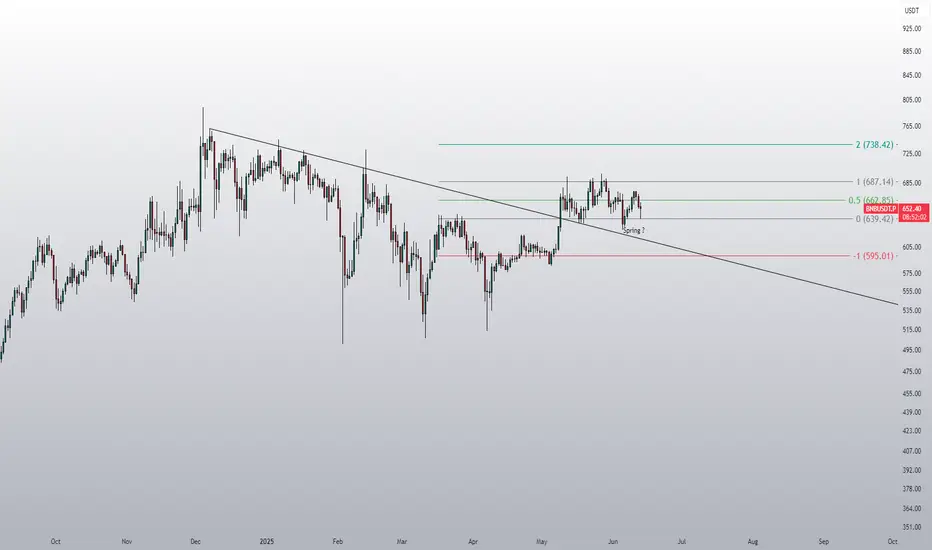
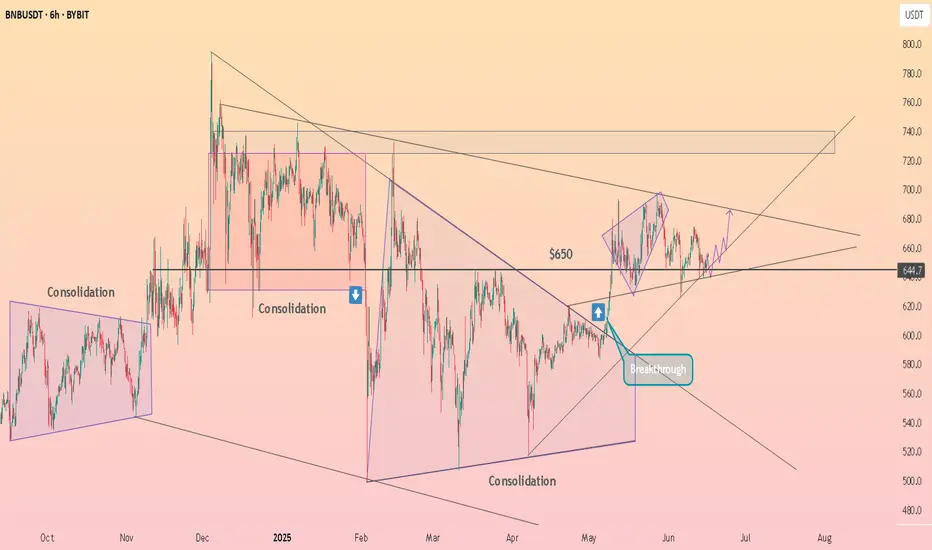
BNB as market indicator?Technically, BNB provides the perfect range setup. After forming a potential 'spring', the price went above the midband, but then retested the range low once more and has been bouncing ever since. Given that the price also broke the downtrend on the daily timeframe, the BNB chart could indicate that the altcoin correction is over. Technically...