BNB LONG TRADE SETUPBNB/USDT is currently holding at a strong support zone, with a high probability of an upward price move. Also 100 EMA is acting as support on daily time frame.
BNBUSDT trade ideas
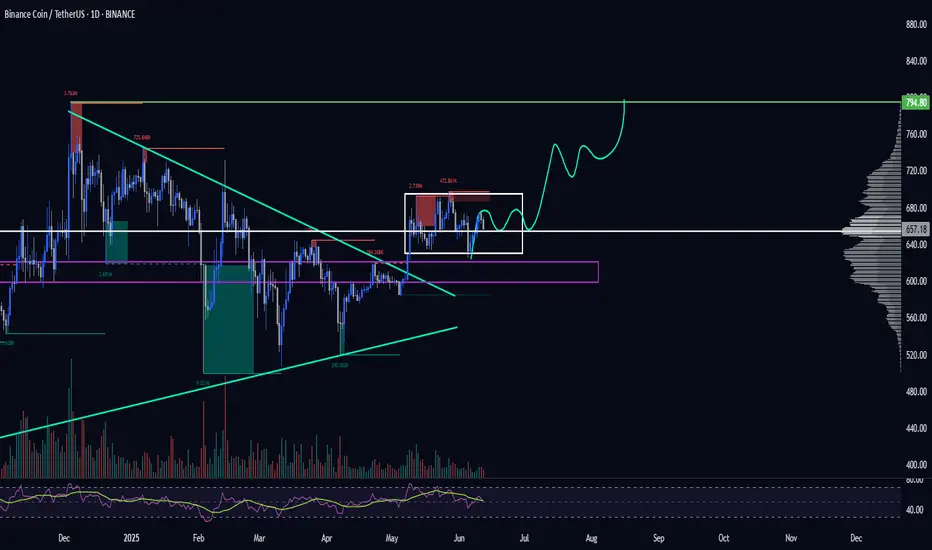
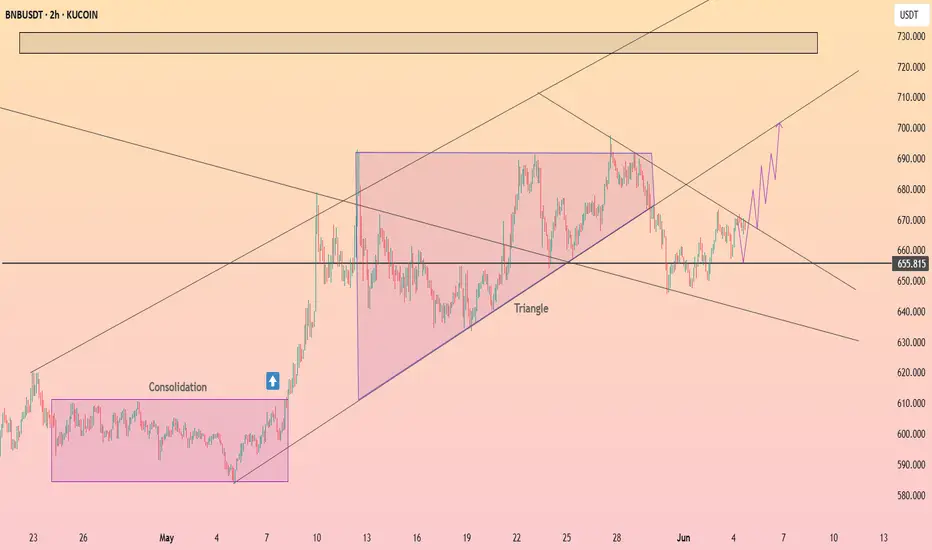
BNB 1D Ready to Explode? This Chart Says YES. 06/12/25BINANCE:BNBUSDT is forming a tight consolidation right below key resistance at $710, inside a triangle structure. Every dip into the $655–$625 support zone gets quickly bought up — showing strong buyer interest and accumulation.
Price is compressing inside the triangle with higher lows, indicating bullish pressure. A breakout above $710 would likely trigger a strong move toward $770–$780, and potentially a new ATH > $800.
As long as $625 holds — I'm bullish. I expect one more sweep of support before an explosive breakout.
Spot/futures entries: $655–$625
Targets: $710 → $780 → $820+
Invalidation: Daily close below $625.
HolderStat┆BNBUSD breakout of the $655 levelCRYPTOCAP:BNB successfully broke upward descending channel and is now above the level of 655. The triangle target was reached around 620, which gives control to bulls.
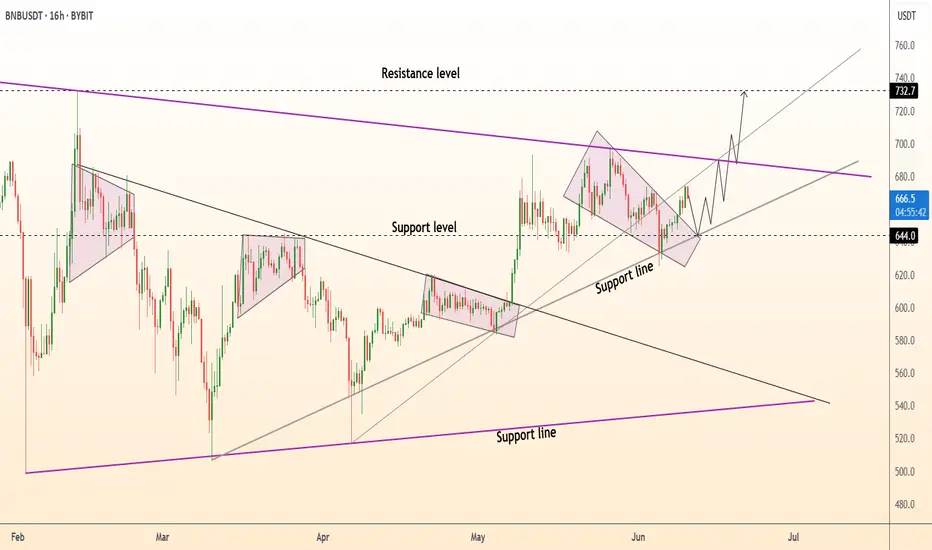
DeGRAM | BNBUSD exited from the wedge📊 Technical Analysis
● Price is respecting a fresh up-sloping channel; the last pull-back halted exactly at $644 support & the inner grey trend-line, printing a higher low and confirming the former wedge top as demand.
● Inside the channel price is carving a bullish pennant whose 1.618 swing meets the red $730-$735 resistance band and the long-term purple down-trend, while RSI holds above its mid-line—signalling persistent upside pressure.
💡 Fundamental Analysis
● BNB Chain’s June “Roll-ups” test-net cut L2 fees 90 %, boosting TVL, and Binance’s new Megadrop staking programme has pushed exchange outflows to a 4-month high, tightening circulating supply.
✨ Summary
Buy $645-$660; pennant break >$680 targets $705 → $730. Long bias void on a 16 h close below $604.
-------------------
Share your opinion in the comments and support the idea with a like. Thanks for your support!
Volatility period: around June 13 (June 12-14)
Hello, traders.
If you "Follow", you can always get new information quickly.
Have a nice day today.
-------------------------------------
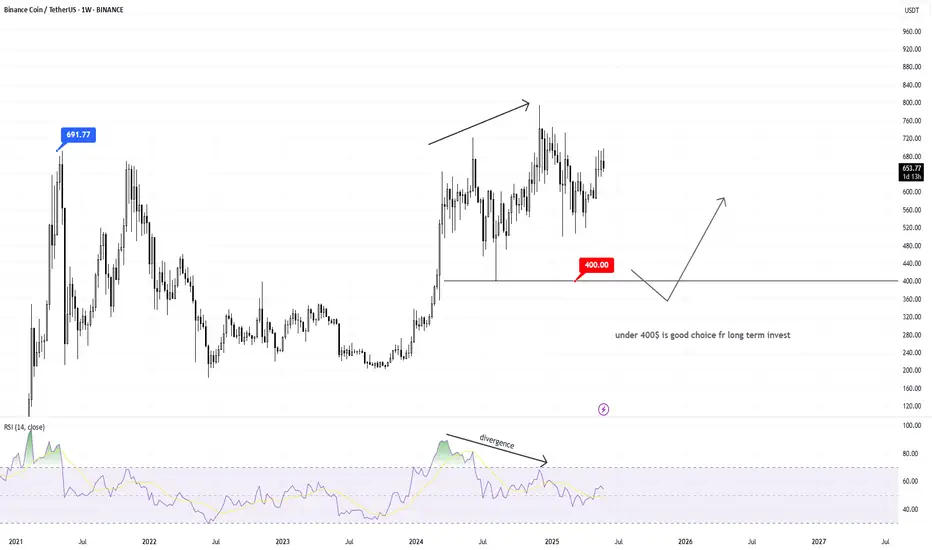
I think BNB is a coin that can be invested in the long term, like BTC and ETH.
This is because many people around the world are using it.
The exchange may close at any moment, but I think the probability of that happening is quite low, so I think it is suitable for long-term investment.
-
(BNBUSDT 1M chart)
Since the trading volume seems to have decreased significantly due to the large increase in the price, I think it is not surprising that volatility can occur at any time.
For now, the key is whether it can maintain the price by rising above 702.30.
The important support and resistance range is the 533.90-587.58 range.
Therefore, even if it falls, it is necessary to check whether it is supported near the important support and resistance range.
-
(1W chart)
In order to escape the mid-term downtrend line, the key is whether it can receive support near 661.74 and rise above 702.30.
If not, and it falls, there is a possibility that it will fall to around 58758-595.0.
Accordingly, the important volatility period is expected to be around the week of July 21.
-
(1D chart)
The key is whether it can maintain the price above 675.54 by following the short-term uptrend.
To do so, we need to see whether the price maintains above 661.74 after passing the volatility period around June 13 (June 12-14).
If it falls, it is expected to determine the trend again when it meets the M-Signal indicator on the 1W chart.
At this time, if it shows support around 583.54-595.0, I think it is a time to buy.
However, since the important section is the 533.90-587.58 section, if a strong decline occurs, it seems likely to touch the important section.
-
I think it has risen a lot to make a long-term investment.
Therefore, I think it is better to make a short-term investment and increase the number of coins (tokens) corresponding to the profit for now.
The method of increasing the number of coins (tokens) corresponding to the profit is to sell the purchase principal (+including transaction fees) when the price rises by purchase price.
In that case, the cash profit will be almost non-existent or small, but I think it is advantageous from a long-term investment perspective because the number of coins (tokens) increases.
The coins (tokens) created this way have an average purchase price of 0, so it will reduce the psychological burden of buying when the price falls.
-
Thank you for reading to the end.
I hope you have a successful transaction.
--------------------------------------------------
- This is an explanation of the big picture.
(3-year bull market, 1-year bear market pattern)
I will explain more details when the bear market starts.
------------------------------------------------------

HolderStat┆BNBUSD holds 610 baselineCRYPTOCAP:BNB steadies near the 611 baseline, riding a rising trend after a wedge breakthrough. Pushes above 660 could hunt the 690-720 supply shelf; a slip beneath 600 would tilt momentum back to the 560 demand pocket.
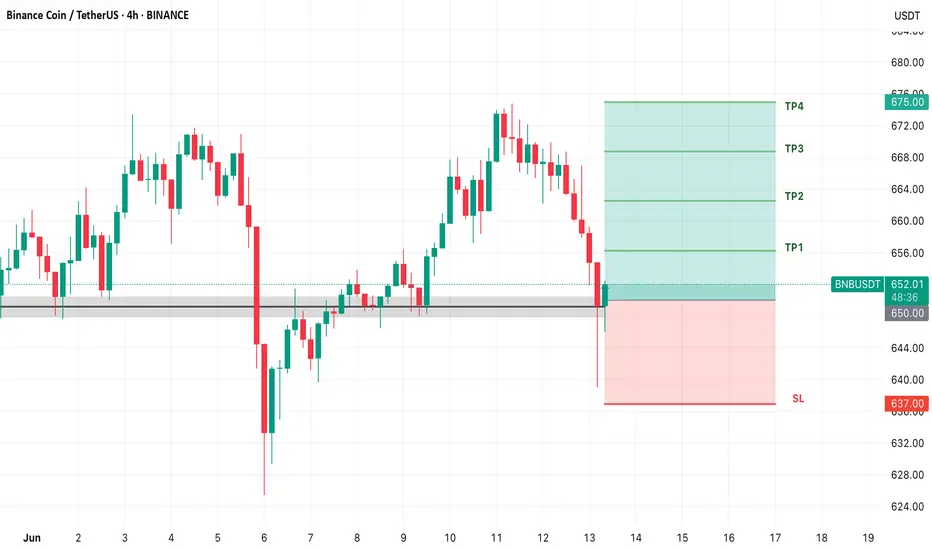
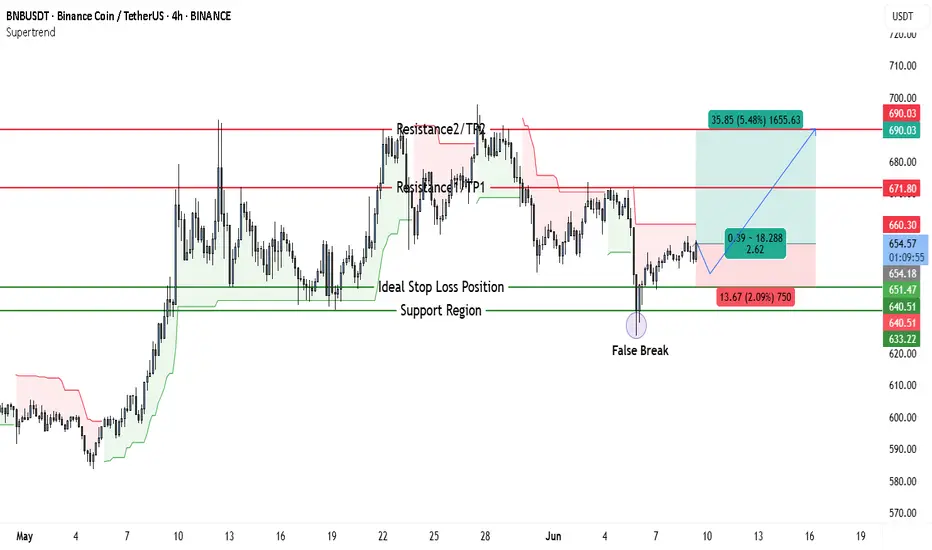
BNBUSDT 4H Analysis – Bullish Reclaim After False BreakdownBNBUSDT is showing strong bullish potential after recovering from a classic false breakdown scenario. The price structure suggests a high-probability long setup backed by solid support reclaim, clean invalidation, and clearly defined targets.
Market Context
On the 4-hour timeframe, BNBUSDT dipped below its key support zone between $640.51 – $651.47. This move triggered a false break — where price momentarily breaks below key support to trap late sellers and absorb liquidity.
What followed is a sharp recovery back above the support region, confirming the breakdown as a liquidity sweep rather than genuine bearish continuation.
Key Technical Highlights
• Support Reclaim: After the wick to $633.22, price quickly rebounded and is now holding above $651.47, suggesting strong buyer interest at that zone.
• Supertrend Flip Potential: The Supertrend zone resistance at $654.18 – $660.30 is currently under pressure. A flip here could accelerate bullish momentum.
• Well-Defined Range Structure: The move sets the stage for a return to previous range highs, with clear take-profit targets and a tight invalidation level.
Trade Setup – Long Opportunity
• Entry: Current levels around $654 – $655
• Stop Loss (SL): $640.51 (just below reclaimed support)
• Take Profit 1 (TP1): $671.80
• Take Profit 2 (TP2): $690.03
• Risk–Reward Ratio: ~2.62
Setup Type: Reclaim + Range Continuation
This trade leverages the false breakdown as a springboard for upside continuation, with the SL placed just under the support line and clear TP levels based on prior resistance zones.
Strategy Outlook
The false break around $633.22 likely flushed out weak longs and triggered liquidity collection. Now that BNB has reclaimed the support and is stabilizing within a rising demand zone, buyers may aim for previous resistance levels.
A sustained close above $660.30 would further confirm bullish control, potentially speeding up the move toward TP1 and TP2.
BNB moves in clearly descending channelAs you see in the chart, current trend is clearly bearish within a well-defined descending channel. Price is making lower highs and lower lows, respecting both channel borders. After 2 days upward swing, price is near the top of the descending channel (around 653), testing the upper boundary. That area aligns with the red resistance zone — a strong supply area. The last candles are forming small-bodied candles with upper wicks near resistance; indicates buyer exhaustion. Potential for a bearish engulfing or rejection wick, which would confirm a short entry.
Trade Plan Suggestion:
Enter: 653-655
Tp1: 640
Tp2: 630
TP3: 607
SL: 663
** Please follow your strategy and updates; this is just my Idea, and I will gladly see your ideas in this post.

BNB HODL ☆☆☆☆☆Still in accumulation zone. Good price action and waiting for bullish momentum. Hopefully btc.d will go down and BNB will ATH soon🥶.
⚠️Support on the volume profile must be maintained (602.62), if it breaks down the market may turn bearish.
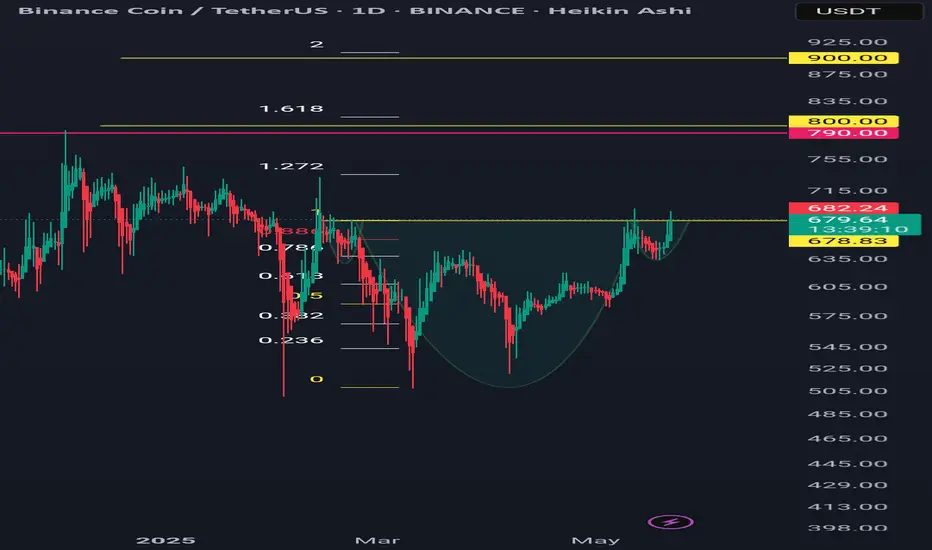
BNBUSDT#BNBUSDT 💰 A bullish pennant has formed on the Daily Chart.
**Potential Targets:** 676, 784, 909 {500% profit with 10X leverage}
As always, remember that effective risk management is crucial for sustainable trading success. 📈 Stay disciplined and protect your capital!
Bnb daily tf Bullish iH&S patternIf closes above 679 in daily tf it may activate the pattern.
Targets are 790 and 900
Invalidation if closes below the bottom of right shoulder 633.31.

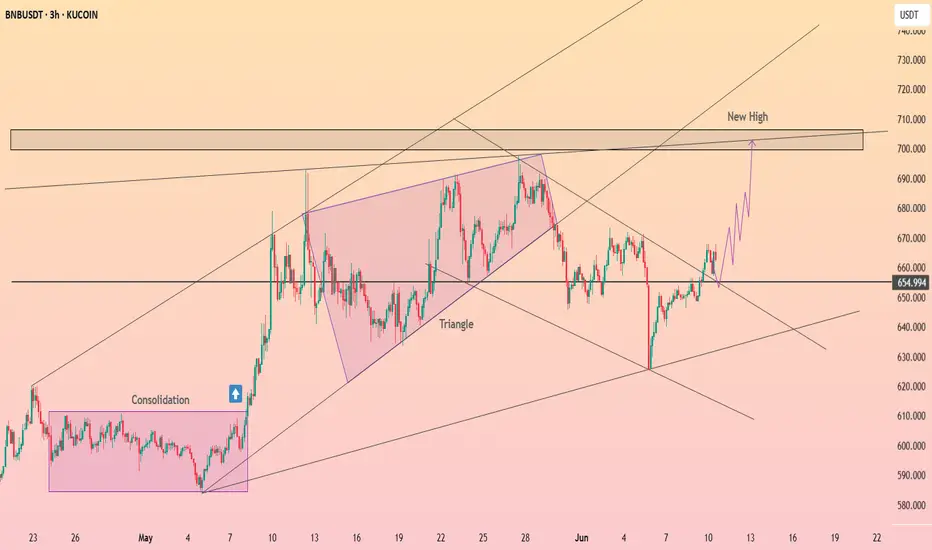
HolderStat┆BNBUSD coil at 655CRYPTOCAP:BNB compresses in a tight two-hour symmetrical triangle atop the 655 floor. Multiple consolidation shelves plus an intact rising trendline load energy for a burst toward the 700 – 730 supply band. Horizontal support dominance keeps the new-high narrative alive.
Lingrid | BNBUSDT channel Consolidation Sets Stage for Next MoveBINANCE:BNBUSDT is pulling back toward the 647–650 support area after forming a higher high inside its upward channel. Price remains above the long-term trendline, and consolidation within this zone hints at potential accumulation. A confirmed bounce from this zone could send price toward the 715 resistance target.
📈 Key Levels
Buy zone: 647–652
Buy trigger: breakout above 668 with volume
Target: 715
Sell trigger: breakdown below 640
💡 Risks
Failure to hold the channel support may trigger a deeper correction
Sideways chop below trendline weakens bullish structure
Volume divergence could signal short-term buyer exhaustion
Traders, if you liked this idea or if you have your own opinion about it, write in the comments. I will be glad 👩💻

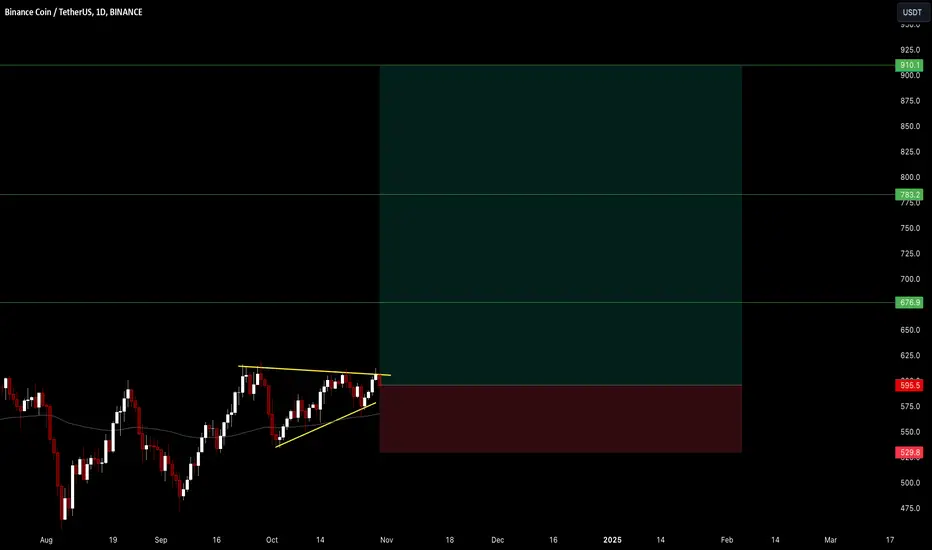
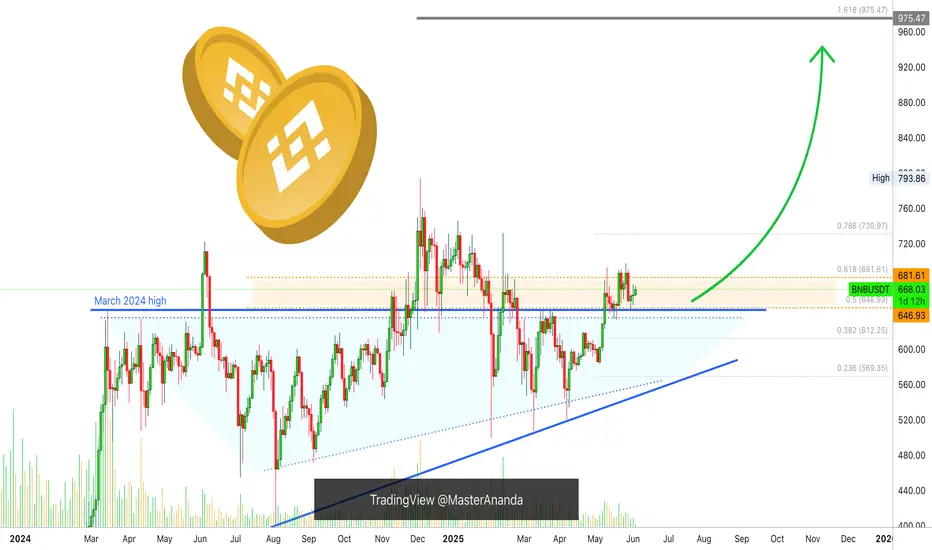
Binance Coin Consolidation Bearish or Bullish? $975 TargetThat's the question I am about to answer.
The action is happening above the March 2024 high. Binance Coin's current consolidation is considered bullish because it is happening above this level. There is also a series of higher lows since 2-Feb. 2025. There has been a strong recovery in the last four months.
The fact that the recovery is slow and extended gives it strength.
The action is sandwiched between 0.5 and 0.618 Fib. extension levels. These two levels work as immediate resistance and support.
Bullish patterns and signals are present all across this chart.
» BNBUSDT is bullish. Next strong target and new all-time high will be $975.
Thank you for reading.
Namaste.
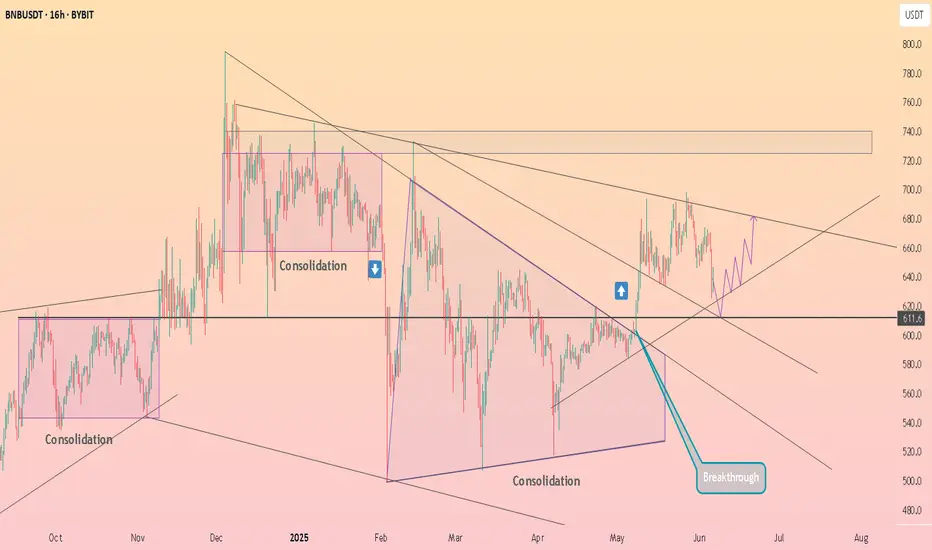
HolderStat┆BNBUSD breakout ripple effectCRYPTOCAP:BNB punched through a year-long resistance, tagged “breakthrough” and now coils above the trendline. Consecutive consolidation blocks, rising support and a freshly won channel hint at buyers pressing toward the 740 USDT supply zone, extending the crypto’s bullish narrative.

BNBUSDT long position (4h time frame)hi traders
Today we are analysing BNB on 4 hour timeframe.
BNB appears to be reversing from a prior downtrend. It is now consolidating below the resistance line indicating potential accumulation.
This can be a bullish structure as it has higher lows and tests the resistance zone which may result in pressure building for a breakout. Enter when you see the breakout occurring or you can wait for the breakout and the retest of the new support.
By doing this we have a risk reward ratio of 4.59 .

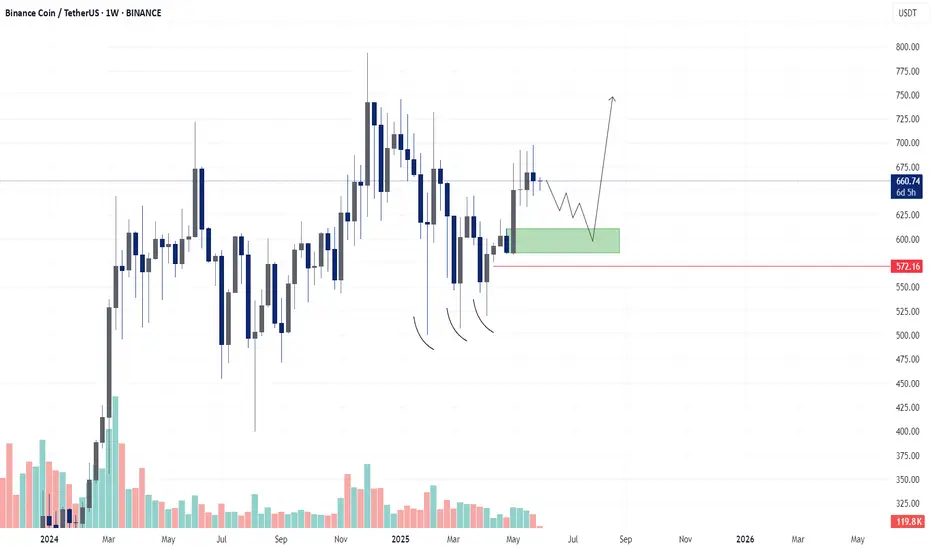
BNB - LONG SET-UPBINANCE:BNBUSDT
This is a high-probability bullish setup on the weekly timeframe
Price is coiling below resistance, and pullback into green zone gives a low-risk entry
EntrY Zone - 590 -- 610
SL Below 575
Target Above 650 -- 700++
Manage Leverage & MargiN As Per Your Risk Capacity
BNB tapped the imbalance — and I stepped in.There was no panic here. Just rebalancing.
BNB just dipped into the 0.5 level at 653.28 — right at the base of a 1H FVG and overlapping with a minor demand wick. Most won’t even notice what just happened. But Smart Money sees the shift.
The market provided liquidity for entries without breaking structure.
The 1H OB above — from 657.5 to 661.4 — is now the magnet. It’s unmitigated, and clean.
If price holds this mid-volume shelf and we reclaim above 655.2, I expect rapid delivery into the OB, potentially overshooting for premium distribution into higher inefficiencies.
Execution logic:
Entry zone: 652.9–653.3
Reclaim trigger: above 655.2
TP1: 657.5
TP2: 661.4
SL: below 651.3 (0.618) or tighter under 648.6 (0.786 if aggressive)
You don’t need a breakout.
You need balance — and the discipline to strike when it returns.

Buy### Important and main block order ### can cause a return and reaction to the level. ### In the low time frame, wait for the first ceiling to break and trade when hitting the block!!!! ###buy ###choch

BNB Breakdown or Fakeout? Key Levels AheadBNBUSDT – Possible Retest and Key Support Areas
Price has decisively broken the ascending trendline. A retest of that trendline is now likely, followed by a potential move down toward the first support zone (light blue box) between $630 and $640.
📌 Main scenario:
A strong bounce from this area could mark the beginning of a trend reversal (personally, I don’t think it will drop much further).
However, if bearish pressure continues, the key levels to watch are:
$610/$620 – the two dashed black lines inside the Fair Value Gap.
$600 – second support.
$580/$590 – final and most important support, a critical area for the trend structure.
📍 Price action to be watched closely in the coming hours.

BNB – Ascending Triangle Breakdown (4H)🟡 CRYPTOCAP:BNB has broken below its ascending triangle structure on the 4H chart.
📉 Momentum points to a potential test of lower supports, but a reversal could be in the cards too.
🔍 Keep a close watch — next moves could set the tone for this pair!
