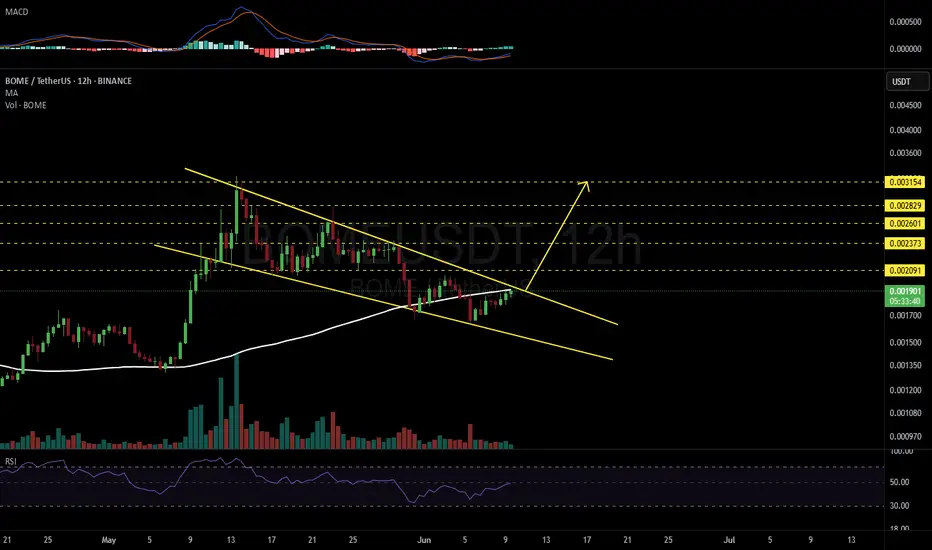
BOMEUSDT 12H#BOME — Bullish Setup in Play! 📈
#BOME is moving inside a Falling Wedge pattern on the 12H chart — a classic bullish reversal signal.
A breakout above the wedge resistance and the 12H MA100 could ignite strong upside momentum. Potential targets after breakout:
🎯 $0.002091
🎯 $0.002373
🎯 $0.002601
🎯
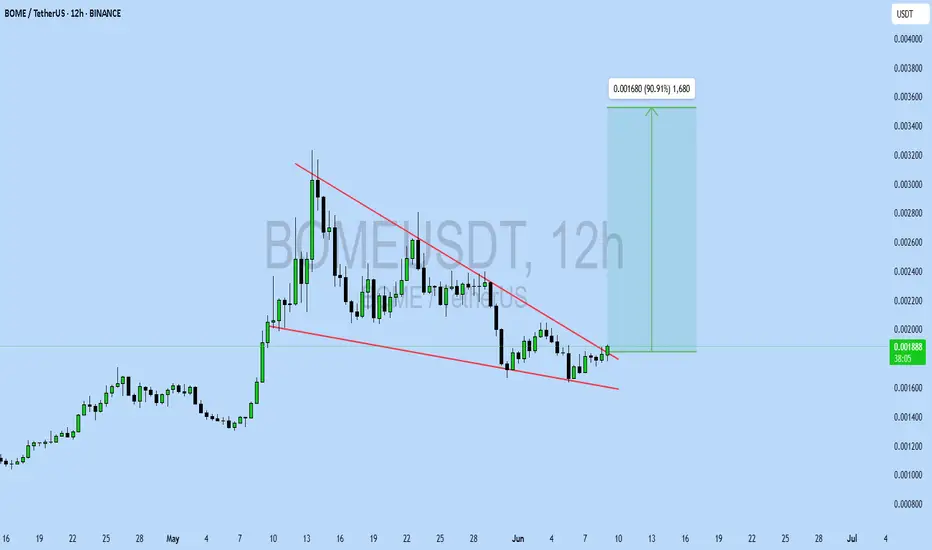
BOMEUSDT UPDATE
Pattern: Falling Wedge Breakout
Current Price: \$0.001880
Target Price: \$0.003560
Target % Gain: 90.91%
Technical Analysis: BOME has broken out of a falling wedge pattern on the 12H chart. A bullish breakout is confirmed with a close above resistance and continued higher lows.
Time Frame: 12H
R
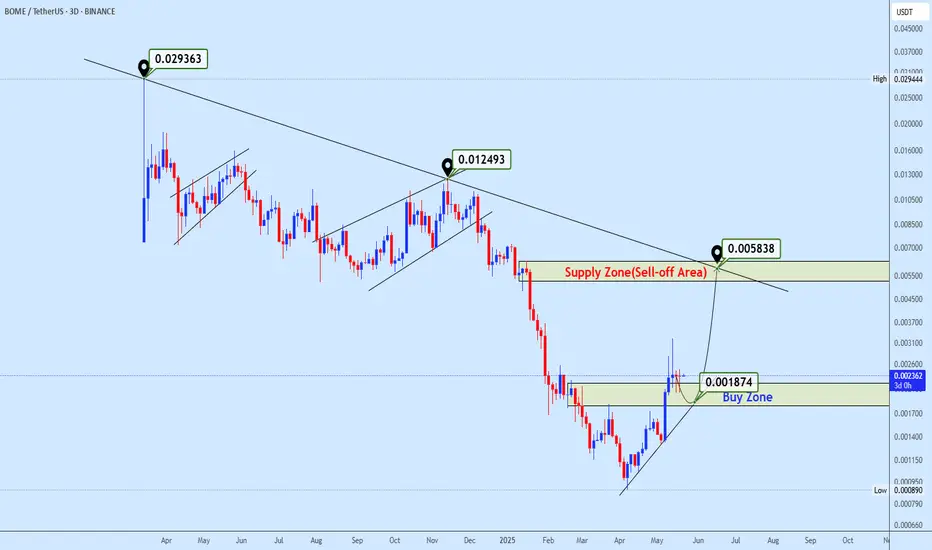
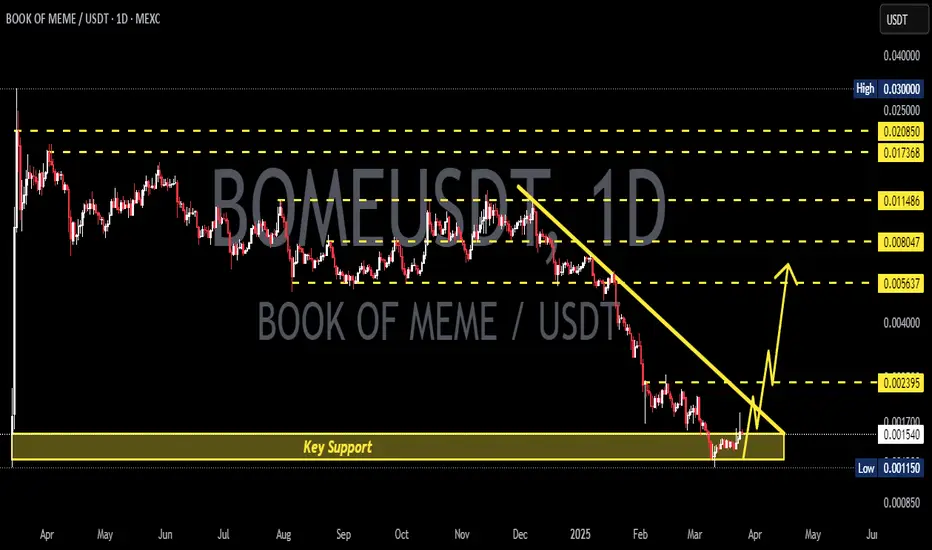
Bomeusdt Buy opporutnityBOMEUSDT continues to trade within a clear descending structure, recently bouncing from a major low and now approaching a critical decision zone.
The price reclaimed the $0.001874 buy zone after a sharp recovery and is currently forming a minor bullish channel. If this structure holds, the next bu
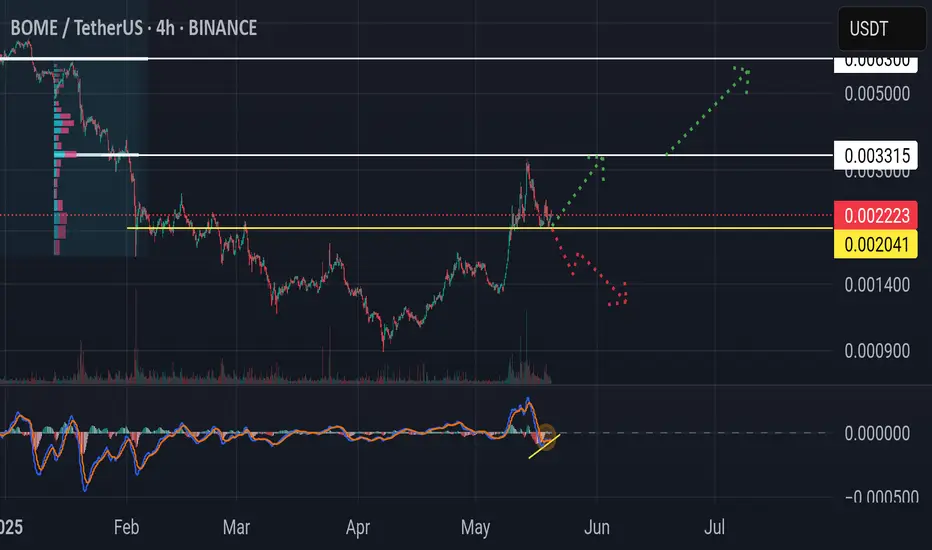
Go go BOME!!📢Price action is quite good. now standing on the yellow support line. potential to go to the white line resistance target, supported by divergence and small double bottom. I think this is a good time to take a long position📈.
⚠️Be careful if the price breakdowns the yellow line support because the
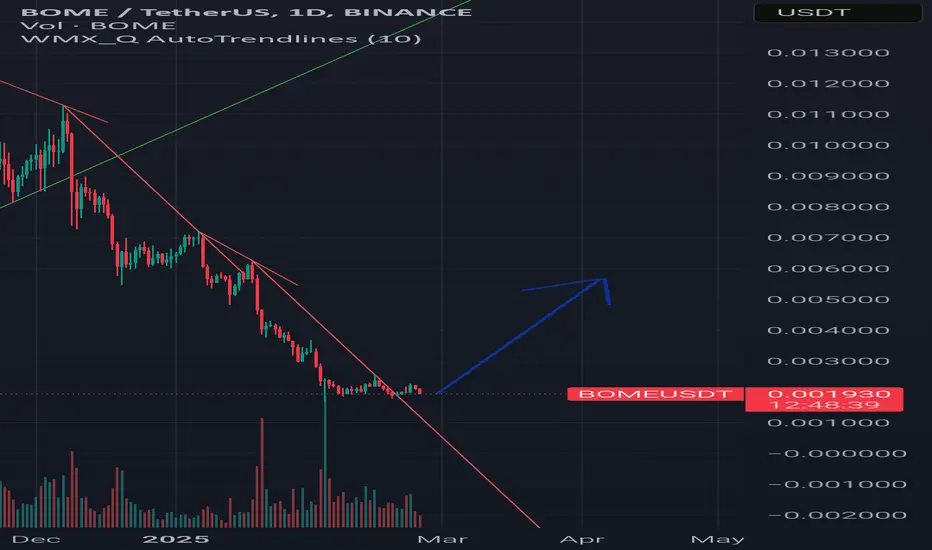
BOME/USDT BullishMeme Coin Bome bullish, break the trendline, trend is change of character.
Let's see.
BINANCE:BOMEUSDT
BOMEUSDT 1DBOME ~ 1D Analysis
#BOME This trade is very high risk. Buy gradually from here with a short -term target of at least 10%+.
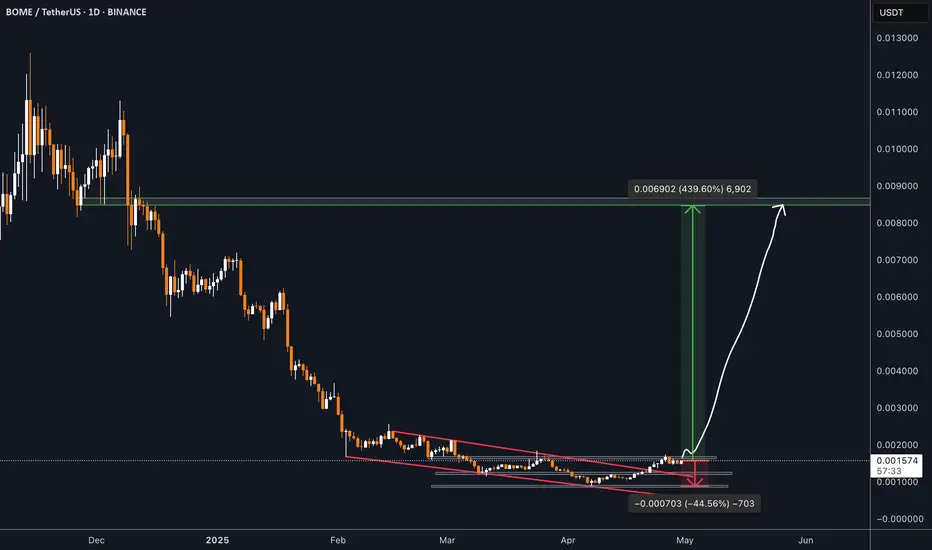
BOME to Boom 500% by end of March?Price action has corrected 85% since mid November, a number of reasons now exist to have long exposure. They include:
1) Price action and RSI resistance breakouts.
2) Regular bullish divergence. Look left.
3) Falling wedge confirmation forecasts circa 550% extension.
Is it possible price action
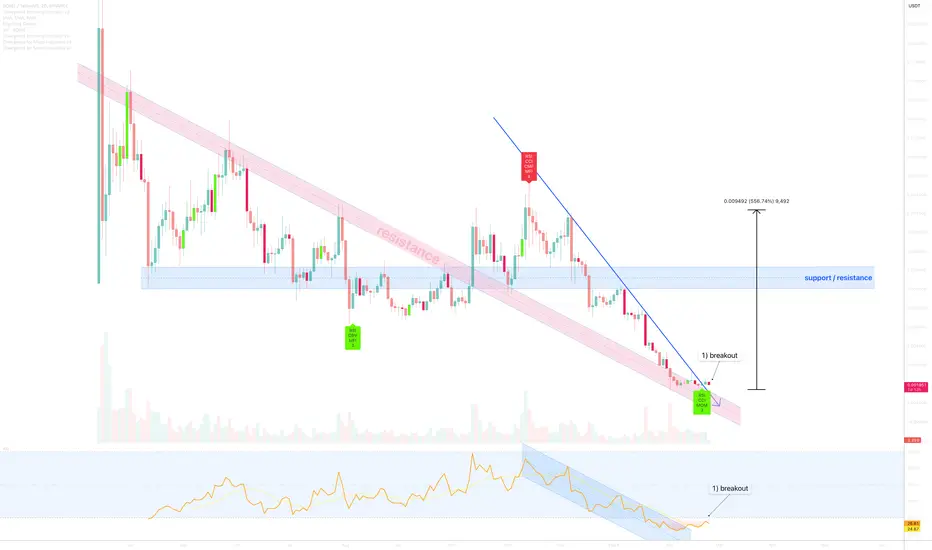
BomeusdtBOME/USDT Breaks Downtrend: A Potential Price Explosion Ahead?
BOME/USDT has successfully broken above its descending trendline on the daily timeframe, signaling a potential shift in market sentiment. Several technical and market-based factors suggest that a strong upward move could be on the horiz
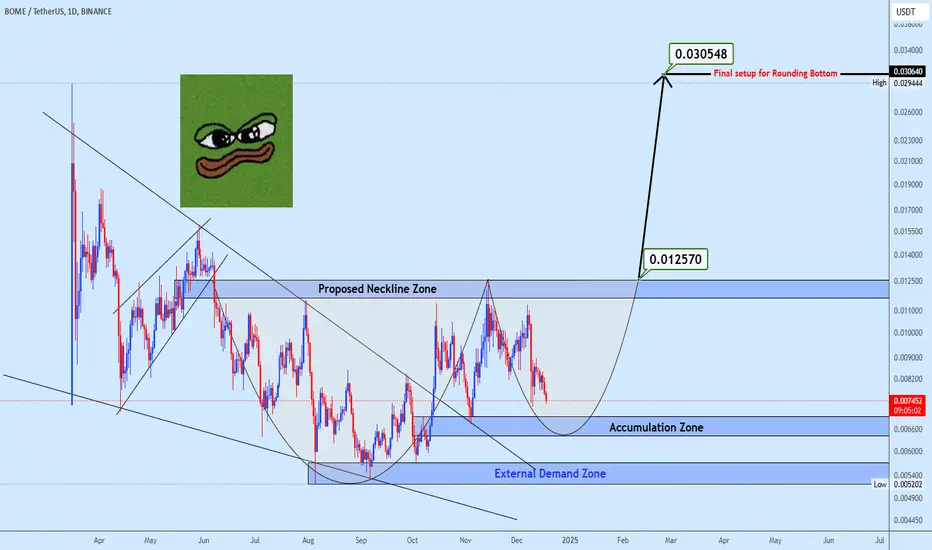
Bomeusdt trading ideaBOMEUSDT has achieved a major breakout from a falling wedge, with price stabilizing above the wedge after a pullback. The accumulation zone presents a key buying opportunity, with the immediate target aligned with the proposed neckline and the final target clearly outlined on the chart. Additionally
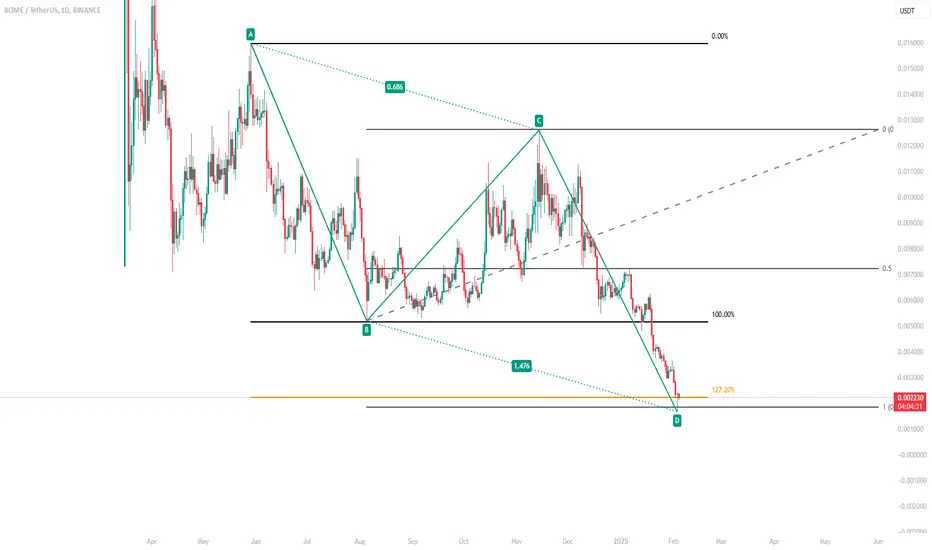
Did we hit the bottom on BOME? Is it time for a rise to 0.0105?Currently, on BOME, Smart Money has created an equality pattern AB=CD.
Point C is at the 68.8 Fibonacci level of wave AB.
Point D is at the 127.2 Fibonacci level of wave AB.
Additionally, on the D1 timeframe, we have a trend reversal candle.
At the moment, the price should bounce upwards to the 61.
See all ideas
Summarizing what the indicators are suggesting.
Oscillators
Neutral
SellBuy
Strong sellStrong buy
Strong sellSellNeutralBuyStrong buy
Oscillators
Neutral
SellBuy
Strong sellStrong buy
Strong sellSellNeutralBuyStrong buy
Summary
Neutral
SellBuy
Strong sellStrong buy
Strong sellSellNeutralBuyStrong buy
Summary
Neutral
SellBuy
Strong sellStrong buy
Strong sellSellNeutralBuyStrong buy
Summary
Neutral
SellBuy
Strong sellStrong buy
Strong sellSellNeutralBuyStrong buy
Moving Averages
Neutral
SellBuy
Strong sellStrong buy
Strong sellSellNeutralBuyStrong buy
Moving Averages
Neutral
SellBuy
Strong sellStrong buy
Strong sellSellNeutralBuyStrong buy
Displays a symbol's price movements over previous years to identify recurring trends.