BOOK OF MEME · Leverage vs Spot · Should I Plan or Not?With the log chart we can focus on growth potential, the all-time high, highs and lows, the bigger picture, the chart structure and long-term cycles.
With the linear chart, we can know the truth of a pair. Are we looking at a cycle top or bottom prices?
BOMEUSDT (BOOK OF MEME) is bullish based on
Related pairs

BOMEUSDT Forming Bullish PennantBOMEUSDT is currently shaping a bullish pennant pattern, which typically indicates a period of consolidation before the next strong upward move. This pattern, combined with rising trading volume, highlights growing momentum and increased interest from market participants. If confirmed, this setup co
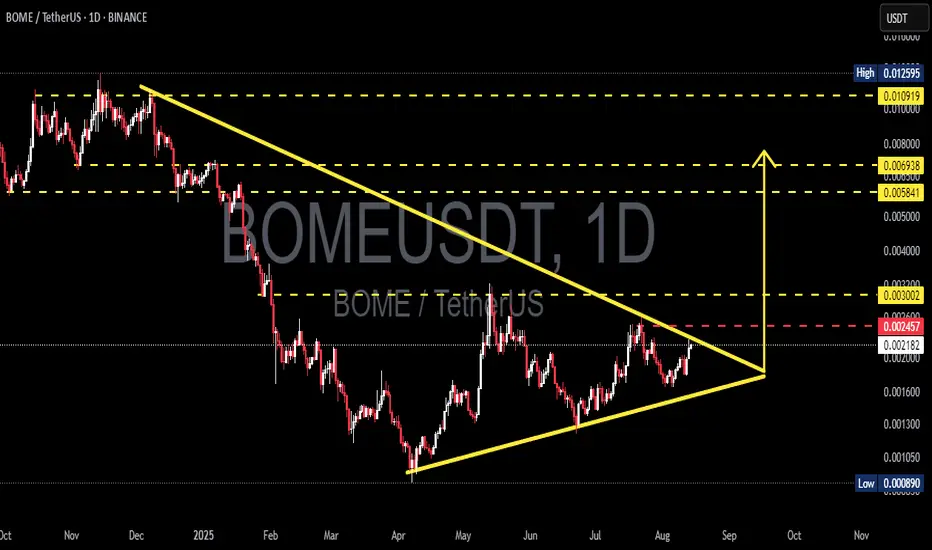
BOME/USDT — Symmetrical Triangle on the Verge of a Explosion?BOME/USDT has spent the past several months moving inside a Symmetrical Triangle pattern, formed by a series of lower highs from the peak around 0.0125 and higher lows from the April 2025 bottom at 0.000890.
This formation signals a major consolidation phase where buying and selling pressure are con

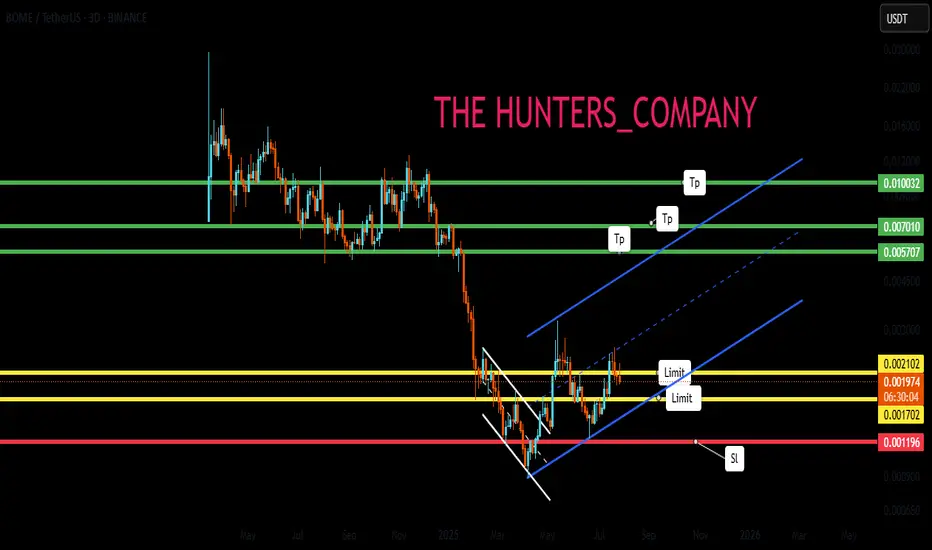
Bome Because of the high volatility that the coin has, it is still a RISK trade, but I characterize it as SWING, because the market may slow down.

The meme coin you must haveHello friends🙌
Given the decline we had, you can see that the price has exited the descending channel and entered the ascending channel. Now we can buy in steps with capital and risk management.
Follow us for more signals🔥
*Trade safely with us*
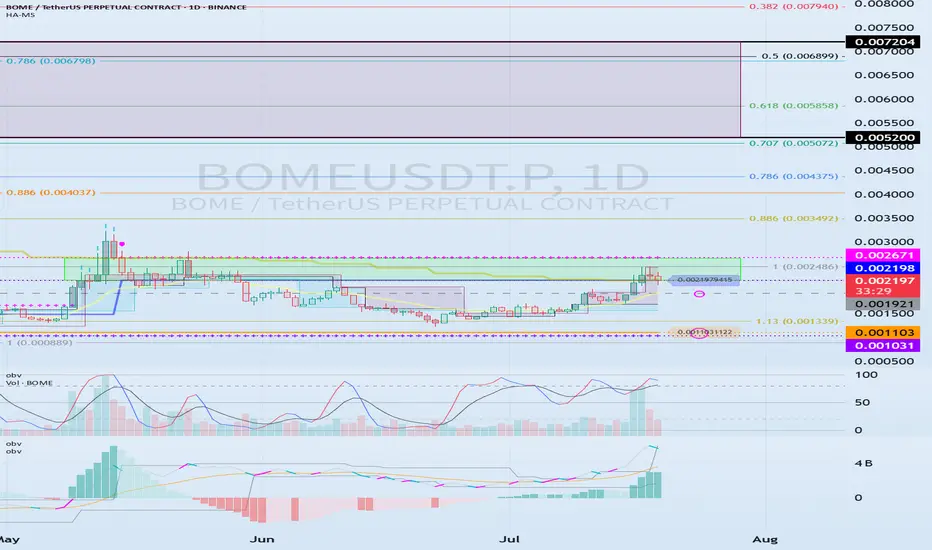
0.002198-0.002671 The key is whether it can break above
Hello, traders.
If you "Follow", you can always get new information quickly.
Have a nice day today.
-------------------------------------
(BOMEUSDT.P 1D chart)
BOME is a BOOK OF MEME, which is a meme coin and belongs to the Solana Ecosystem.
If the price breaks through the 0.002198-0.002671 se
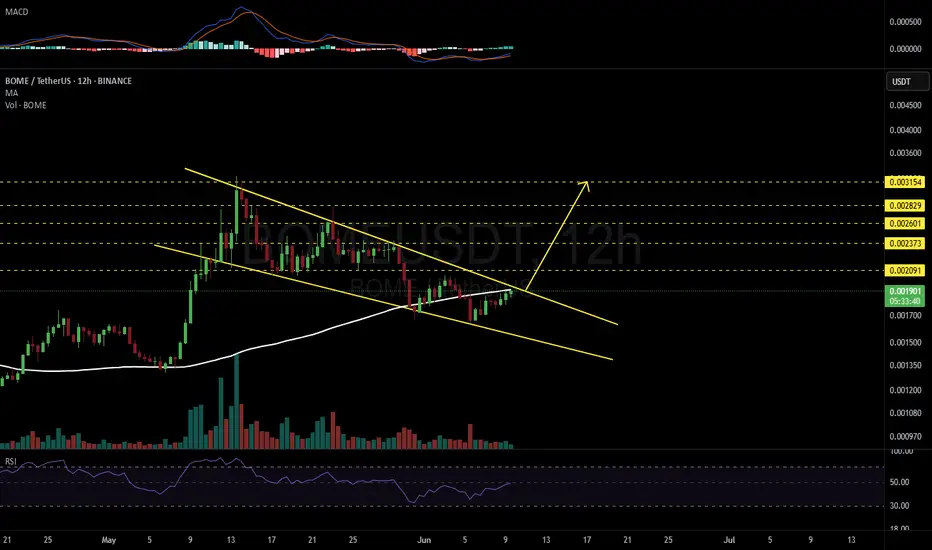
BOMEUSDT 12H#BOME — Bullish Setup in Play! 📈
#BOME is moving inside a Falling Wedge pattern on the 12H chart — a classic bullish reversal signal.
A breakout above the wedge resistance and the 12H MA100 could ignite strong upside momentum. Potential targets after breakout:
🎯 $0.002091
🎯 $0.002373
🎯 $0.002601
🎯
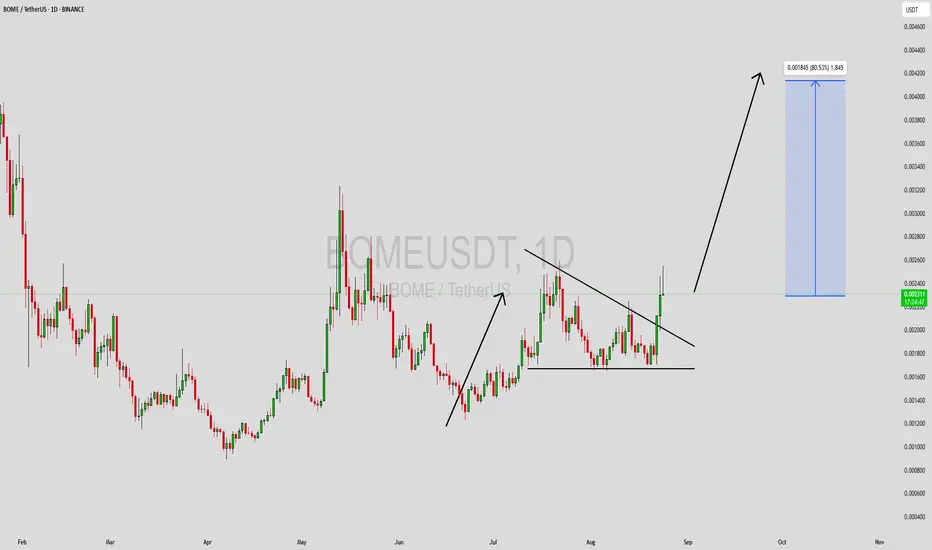
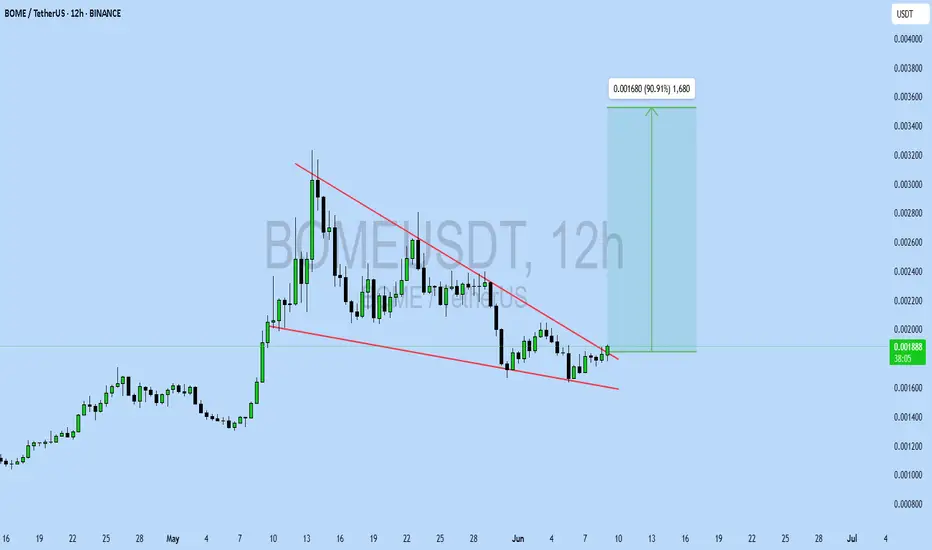
BOMEUSDT UPDATE
Pattern: Falling Wedge Breakout
Current Price: \$0.001880
Target Price: \$0.003560
Target % Gain: 90.91%
Technical Analysis: BOME has broken out of a falling wedge pattern on the 12H chart. A bullish breakout is confirmed with a close above resistance and continued higher lows.
Time Frame: 12H
R
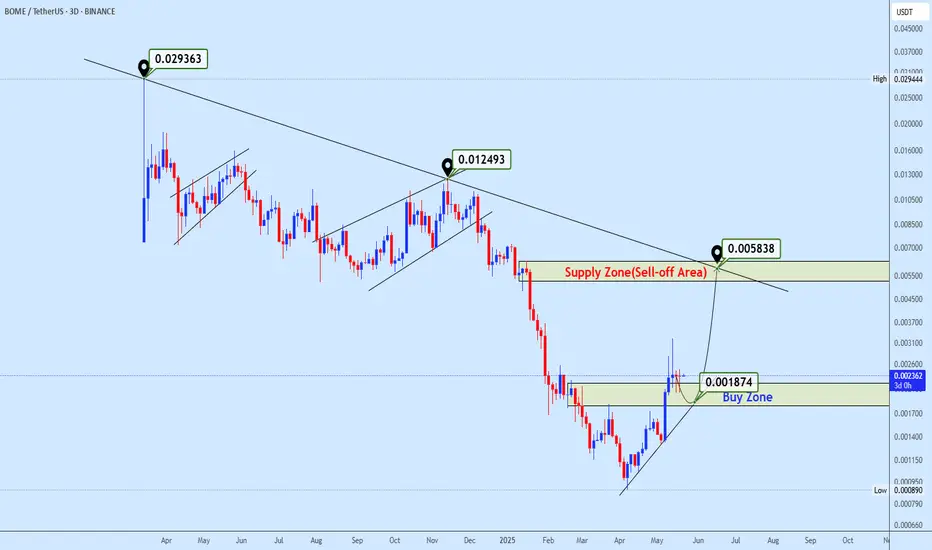
Bomeusdt Buy opporutnityBOMEUSDT continues to trade within a clear descending structure, recently bouncing from a major low and now approaching a critical decision zone.
The price reclaimed the $0.001874 buy zone after a sharp recovery and is currently forming a minor bullish channel. If this structure holds, the next bu
See all ideas
Summarizing what the indicators are suggesting.
Oscillators
Neutral
SellBuy
Strong sellStrong buy
Strong sellSellNeutralBuyStrong buy
Oscillators
Neutral
SellBuy
Strong sellStrong buy
Strong sellSellNeutralBuyStrong buy
Summary
Neutral
SellBuy
Strong sellStrong buy
Strong sellSellNeutralBuyStrong buy
Summary
Neutral
SellBuy
Strong sellStrong buy
Strong sellSellNeutralBuyStrong buy
Summary
Neutral
SellBuy
Strong sellStrong buy
Strong sellSellNeutralBuyStrong buy
Moving Averages
Neutral
SellBuy
Strong sellStrong buy
Strong sellSellNeutralBuyStrong buy
Moving Averages
Neutral
SellBuy
Strong sellStrong buy
Strong sellSellNeutralBuyStrong buy
Displays a symbol's price movements over previous years to identify recurring trends.
Frequently Asked Questions
The current price of BOME / TetherUS (BOME) is 0.002065 USDT — it has risen 4.18% in the past 24 hours. Try placing this info into the context by checking out what coins are also gaining and losing at the moment and seeing BOME price chart.
BOME / TetherUS price has risen by 5.99% over the last week, its month performance shows a 6.89% increase, and as for the last year, BOME / TetherUS has decreased by −66.54%. See more dynamics on BOME price chart.
Keep track of coins' changes with our Crypto Coins Heatmap.
Keep track of coins' changes with our Crypto Coins Heatmap.
BOME / TetherUS (BOME) reached its highest price on Mar 16, 2024 — it amounted to 0.029444 USDT. Find more insights on the BOME price chart.
See the list of crypto gainers and choose what best fits your strategy.
See the list of crypto gainers and choose what best fits your strategy.
BOME / TetherUS (BOME) reached the lowest price of 0.000890 USDT on Apr 7, 2025. View more BOME / TetherUS dynamics on the price chart.
See the list of crypto losers to find unexpected opportunities.
See the list of crypto losers to find unexpected opportunities.
The safest choice when buying BOME is to go to a well-known crypto exchange. Some of the popular names are Binance, Coinbase, Kraken. But you'll have to find a reliable broker and create an account first. You can trade BOME right from TradingView charts — just choose a broker and connect to your account.
Crypto markets are famous for their volatility, so one should study all the available stats before adding crypto assets to their portfolio. Very often it's technical analysis that comes in handy. We prepared technical ratings for BOME / TetherUS (BOME): today its technical analysis shows the buy signal, and according to the 1 week rating BOME shows the buy signal. And you'd better dig deeper and study 1 month rating too — it's neutral. Find inspiration in BOME / TetherUS trading ideas and keep track of what's moving crypto markets with our crypto news feed.
BOME / TetherUS (BOME) is just as reliable as any other crypto asset — this corner of the world market is highly volatile. Today, for instance, BOME / TetherUS is estimated as 4.77% volatile. The only thing it means is that you must prepare and examine all available information before making a decision. And if you're not sure about BOME / TetherUS, you can find more inspiration in our curated watchlists.
You can discuss BOME / TetherUS (BOME) with other users in our public chats, Minds or in the comments to Ideas.