BONKUSDT Make A Falling Wedge Pattern In 4H Chart#BONK
Make a clean bullish Falling Wedge pattern on the 4H chart & Breakout It.Now We can Get a Long Position.
My profit Target
1 Target - $ 0.0001803
2 Target - $ 0.0001929
3 Target - $ 0.0002058
4 Target - $ 0.0002205
5 Target - $ 0.0002335

BONKUSDT | Long Setup – Fib Support + Price Action Scenario📈 BONKUSDT | Long Setup – Fib Support + Price Action Scenario
I usually avoid trading meme coins from the Solana ecosystem, but many SOL-based memes are currently sitting at technically significant support levels — and BONK is one of them.
🔹 Price has retraced into the 0.618 – 0.65 Fibonacci suppo

BONK/USDT Technical Analysis (12h timeframe)This setup is based on a multi-factor method combining structure, RSI level, liquidity zones, and active narrative catalysts.
🧠 Method used:
• Identified a potential double bottom on strong historical support
• RSI < 40 on 12h TF → ideal zone for accumulation
• Price compression near key support le

BONK/USDTThis time, we reached a resistance area for this currency and I think this currency has the potential to be bullish. I have specified the target for you. Remember, this is an analysis, not an entry point. Tell me your opinion.

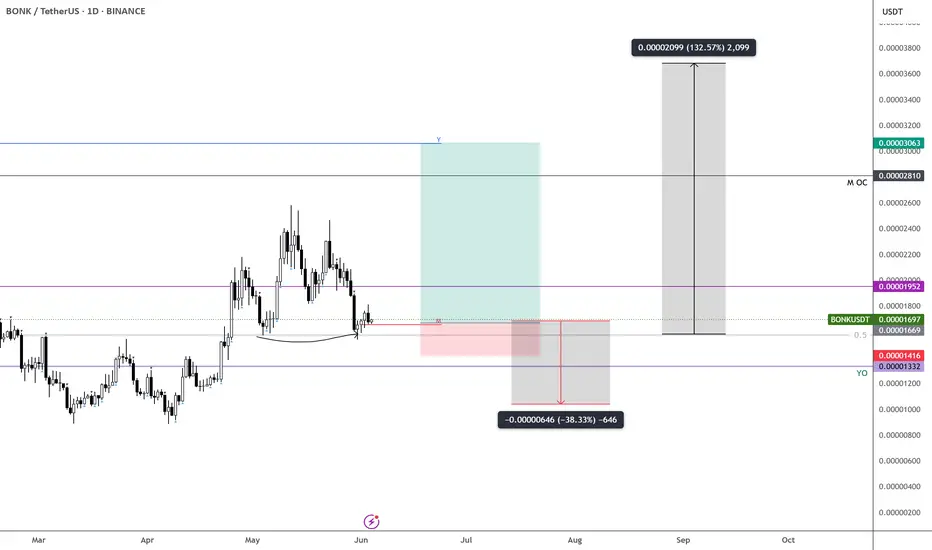
BONK – Long Here, Patience RequiredTime to go long on $BONK.
Hard not to bid at this level—the risk/reward is solid.
Still expecting some range-bound price action before the real move kicks in, so patience is key here.
First target: the yearly open—nearly a 2x from current levels. BINANCE:BONKUSDT
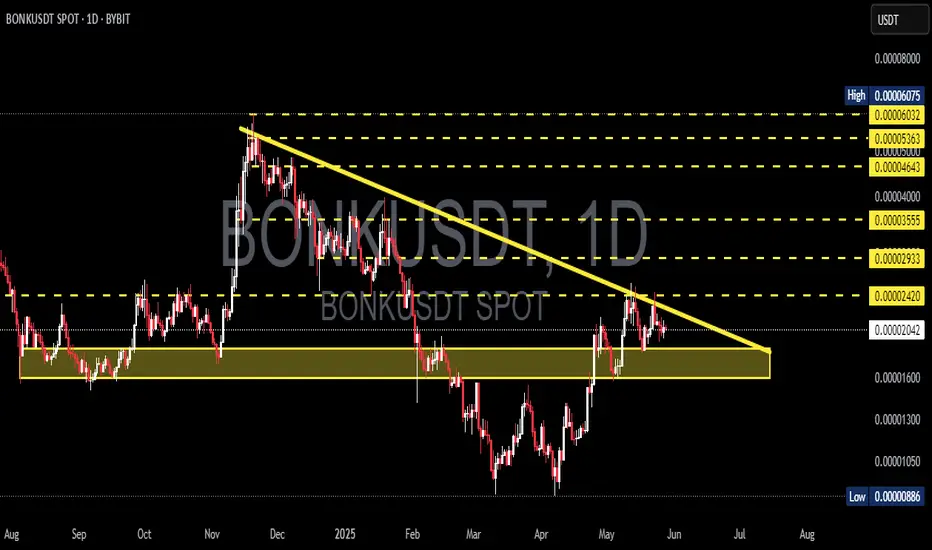
BONKUSDT 1D AnalysisBONK ~ 1D Analysis
#BONK Buy on retesting this support block or buy after successfully breaking this resistance line with a short term target of at least 15%+ and a long term target of $0.000065+
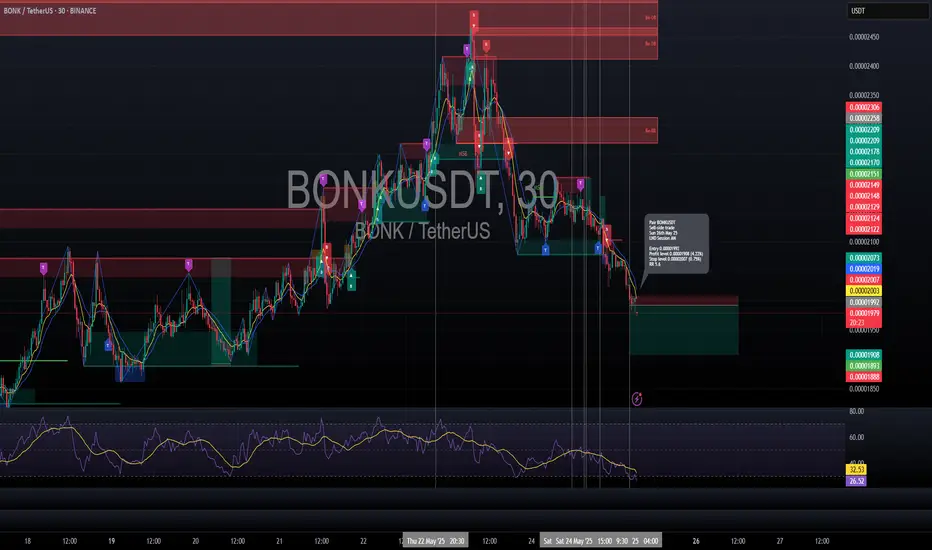
Short trade
🟥 Sell-side Trade Log
📉 Pair: BONK/USDT
🏷️ Type: Intraday | LND Session AM
🧠 Setup: Breakout
📅 Date: Sunday, 26th May 2025
🔹 Entry Price: 0.00001992
🔹 Profit Target: 0.00001908 (+4.22%)
🔹 Stop Loss: 0.00002007 (-0.75%)
🔹 Risk-Reward Ratio: 5.60
🔍 Reasoning:
This breakout trade was initiated aft
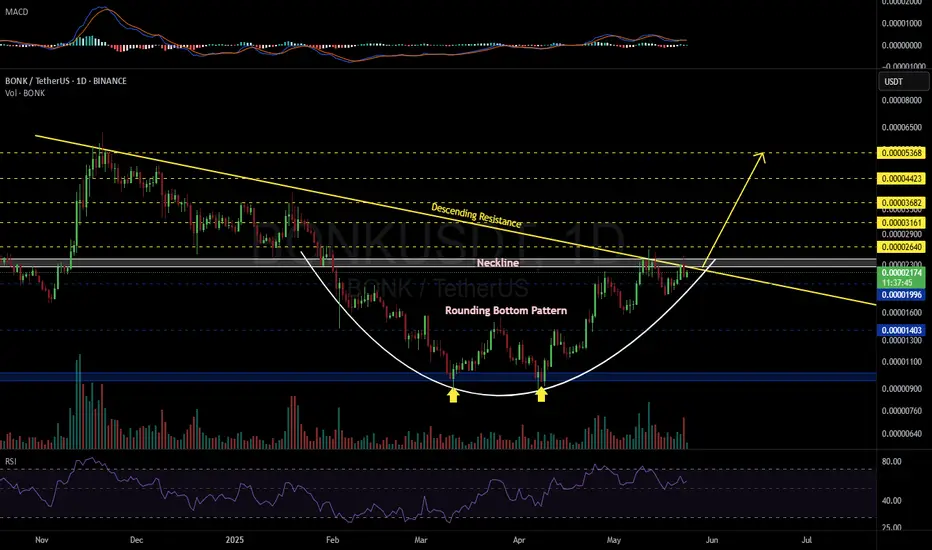
BONKUSDT 1D#BONK is on the verge of a potential breakout above the descending resistance and the neckline of the Rounding Bottom Pattern on the daily chart. A successful breakout could trigger a strong bullish move.
Targets after breakout:
🎯 $0.00002640
🎯 $0.00003161
🎯 $0.00003682
🎯 $0.00004423
🎯 $0.00005368
BONK/USDT: Bullish Market Structure with 77% Upside PotentialBONK is maintaining a strong bullish market structure, marked by a clear series of higher highs and higher lows on the chart. Price recently rejected from the point of control (POC) resistance, initiating a healthy pullback toward the 200 EMA — a common support level in uptrending markets.
This cor

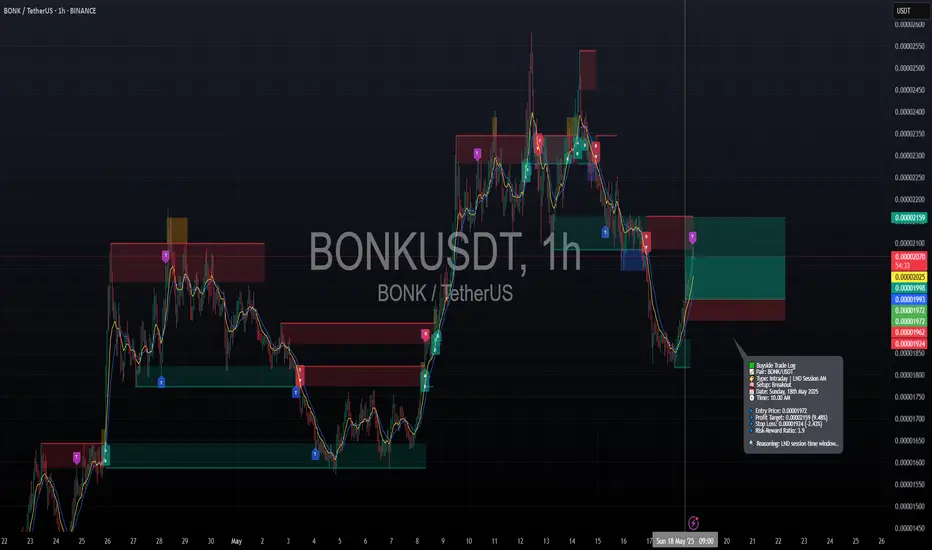
Long trade
🟩 Buyside Trade Log
📈 Pair: BONK/USDT
🏷️ Type: Intraday | LND Session AM
🧠 Setup: Breakout
📅 Date: Sunday, 18th May 2025
🕥 Time: 10:00 AM
🔹 Entry Price: 0.00001972
🔹 Profit Target: 0.00002159 (+9.48%)
🔹 Stop Loss: 0.00001924 (-2.43%)
🔹 Risk-Reward Ratio: 3.90
🔍 Reasoning:
The trade was initiate
See all ideas
Summarizing what the indicators are suggesting.
Oscillators
Neutral
SellBuy
Strong sellStrong buy
Strong sellSellNeutralBuyStrong buy
Oscillators
Neutral
SellBuy
Strong sellStrong buy
Strong sellSellNeutralBuyStrong buy
Summary
Neutral
SellBuy
Strong sellStrong buy
Strong sellSellNeutralBuyStrong buy
Summary
Neutral
SellBuy
Strong sellStrong buy
Strong sellSellNeutralBuyStrong buy
Summary
Neutral
SellBuy
Strong sellStrong buy
Strong sellSellNeutralBuyStrong buy
Moving Averages
Neutral
SellBuy
Strong sellStrong buy
Strong sellSellNeutralBuyStrong buy
Moving Averages
Neutral
SellBuy
Strong sellStrong buy
Strong sellSellNeutralBuyStrong buy
Displays a symbol's price movements over previous years to identify recurring trends.