Will BONK hit 36% gain and reach 0.000020 soon?Hello and greetings to all the crypto enthusiasts, ✌
let’s dive into a full analysis of the upcoming price potential for BONK 🔍📈.
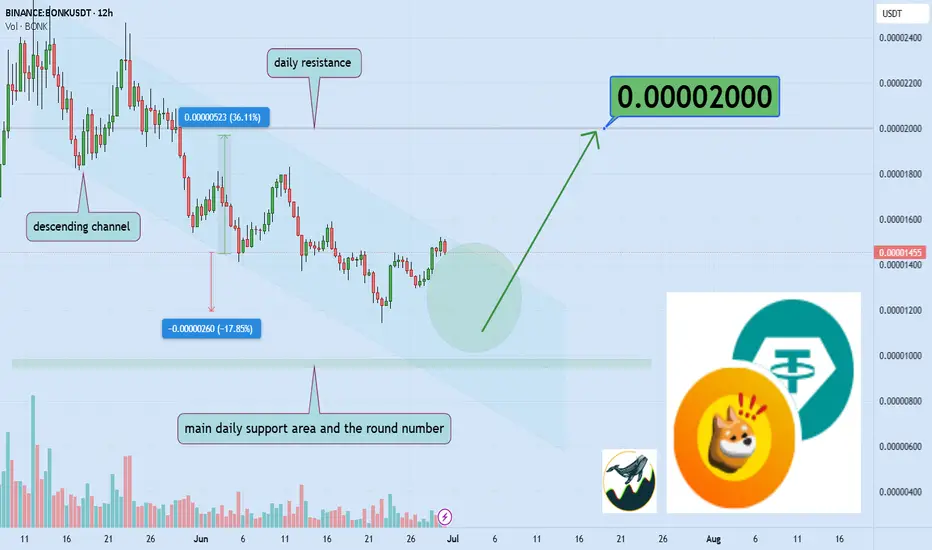
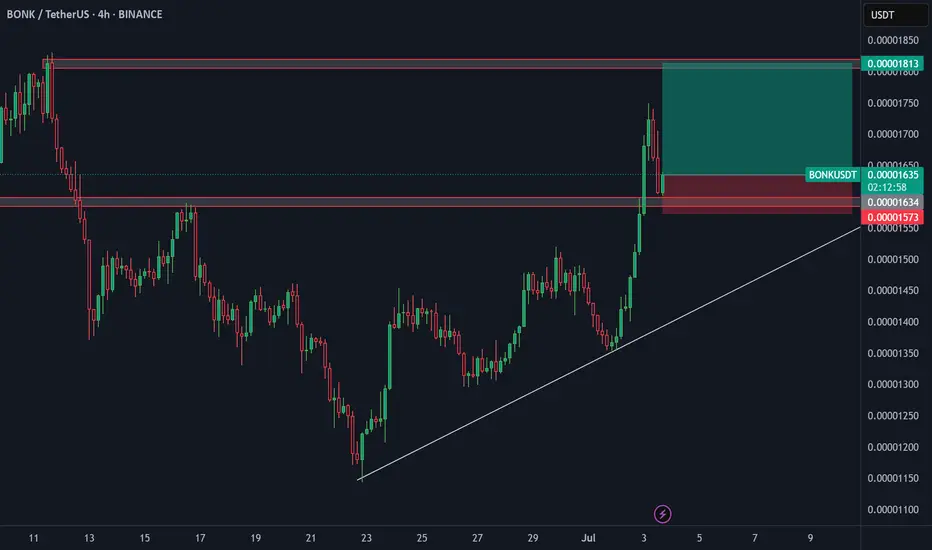
BONK shows strong potential as it approaches a key breakout point. The price is testing the upper boundary of a descending channel, and a successful breakout could push it toward the daily resistance level. 🚀 From here, the trade offers a possible upside of around 36%, with the main target at 0.000020.⚡
🧨 Our team's main opinion is: 🧨
BONK is set to break out of its downtrend with a potential gain of 36%, targeting 0.000020—get ready for a strong move upward 🚀
✨ Need a little love!
We put so much love and time into bringing you useful content & your support truly keeps us going. don’t be shy—drop a comment below. We’d love to hear from you! 💛
Big thanks , Mad Whale 🐋
BONKUSDT trade ideas
BONK/USDT Technical Analysis (12h timeframe)This setup is based on a multi-factor method combining structure, RSI level, liquidity zones, and active narrative catalysts.
🧠 Method used:
• Identified a potential double bottom on strong historical support
• RSI < 40 on 12h TF → ideal zone for accumulation
• Price compression near key support levels
• BTC correlation checked (neutral to mildly bullish)
• Ongoing community narrative: BONK Arena (engagement + visibility)
🎯 Trade plan:
• Anticipated entry zone: 0.0000136 – 0.0000142
• Breakout confirmation: Above 0.0000150 with rising volume
• Stop-loss: 0.0000129
• TP1: 0.0000160 (+12%)
• TP2: 0.0000179 (+28%)
• TP3: 0.0000220 (+50%)
📌 Objective: short-term swing (1–2 weeks max)
Invalidation: close below 0.0000129 with confirmed volume.
Watching closely for a breakout trigger above 0.0000150.

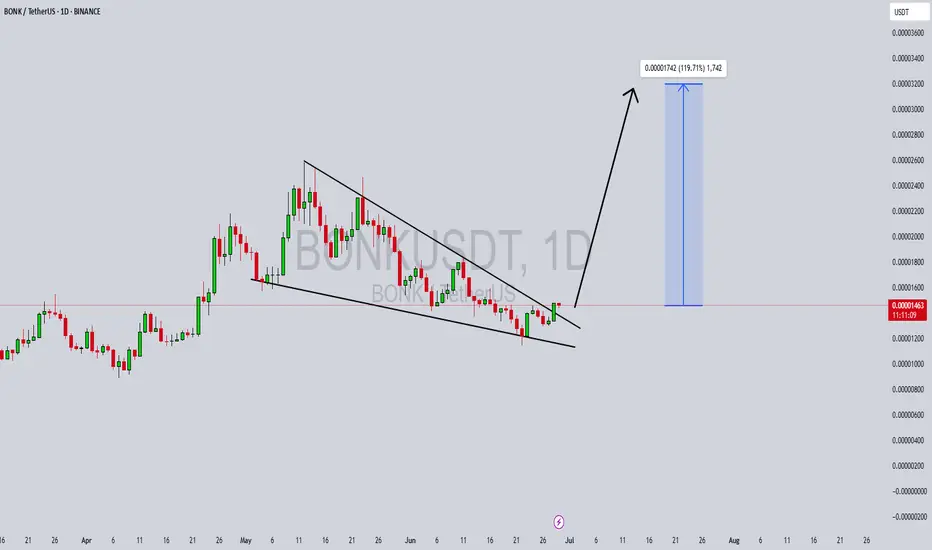
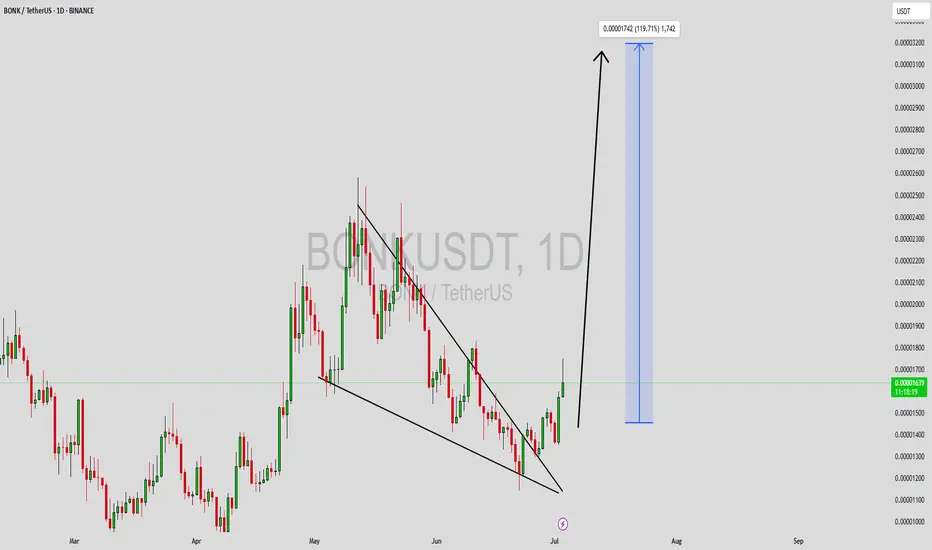
BONKUSDT Forming Falling WedgeBONKUSDT is catching the attention of savvy crypto traders as it displays a classic falling wedge pattern, a well-known bullish reversal signal. This technical setup suggests that the prolonged downtrend could be nearing exhaustion, opening the door for a significant upside move. With good trading volume accompanying recent price action, buyers are showing signs of accumulation, laying the groundwork for a potential breakout that could deliver an impressive 90% to 100%+ gain in the coming sessions.
The falling wedge pattern is one of the most reliable chart formations for spotting trend reversals in the crypto market. As BONKUSDT continues to coil tighter within the wedge, the pressure is building for a breakout to the upside. Investors are becoming increasingly optimistic as they see strong support levels being defended, indicating that the bears are losing momentum. When price action breaks out of the wedge with convincing volume, a swift rally is likely to follow, rewarding those who positioned themselves early.
BONKUSDT’s growing popularity among retail and institutional traders further adds to its bullish outlook. The project is generating a buzz across crypto communities as investors recognize its potential for high percentage returns. Combined with solid fundamentals and renewed market sentiment, BONKUSDT has what it takes to deliver a powerful move once the falling wedge confirms its breakout. Smart money is watching this pair closely for a breakout candle that could ignite a trend reversal rally.
It’s crucial for traders to keep an eye on volume spikes and daily closes above key resistance to validate the wedge breakout. Clear risk management and well-defined stop-loss placements are essential to ride this setup with confidence. If the pattern plays out as expected, BONKUSDT could become one of the top performing coins in the near term, offering traders an excellent opportunity to capitalize on this bullish momentum.
✅ Show your support by hitting the like button and
✅ Leaving a comment below! (What is You opinion about this Coin)
Your feedback and engagement keep me inspired to share more insightful market analysis with you!
BONKUSDTCryptocurrency Futures Market Disclaimer 🚨🚨🚨
Trading cryptocurrency futures involves high risks and is not suitable for all investors.
Cryptocurrency prices are highly volatile, which can lead to significant gains or losses in a short period.
Before engaging in crypto futures trading, consider your risk tolerance, experience, and financial situation.
Risk of Loss: You may lose more than your initial capital due to the leveraged nature of futures. You are fully responsible for any losses incurred.
Market Volatility: Crypto prices can fluctuate significantly due to factors such as market sentiment, regulations, or unforeseen events.
Leverage Risk: The use of leverage can amplify profits but also increases the risk of total loss.
Regulatory Uncertainty: Regulations related to cryptocurrencies vary by jurisdiction and may change, affecting the value or legality of trading.
Technical Risks: Platform disruptions, hacking, or technical issues may result in losses.
This information is not financial, investment, or trading advice. Consult a professional financial advisor before making decisions. We are not liable for any losses or damages arising from cryptocurrency futures trading.
Note: Ensure compliance with local regulations regarding cryptocurrency trading in your region.
thanks for like and follow @ydnldn
BONK longBONK bounced off the support level after the successful retest. Bullish movemen to next resistance level is expected to continue
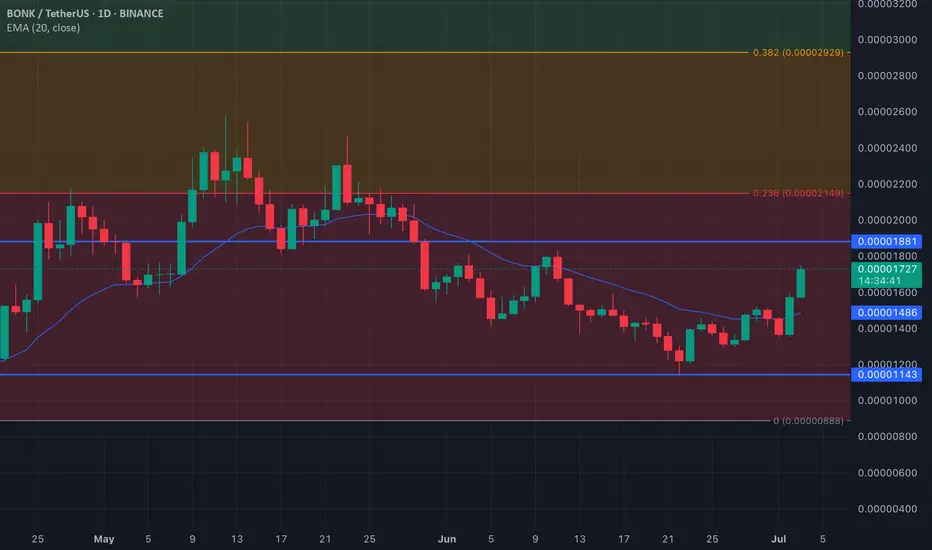
BONK Price Climbs Above 20-Day EMABONK has broken above its 20-day Exponential Moving Average (EMA), now acting as dynamic support at $0.000014. This move indicates short-term bullish momentum, as trading above the 20-day EMA typically suggests increased buying pressure.
If bulls maintain control, BONK could rally toward the $0.0000184 resistance level.
However, a drop in demand could invalidate the uptrend, with downside targets around $0.0000114.
BONKUSDT | Long Setup – Fib Support + Price Action Scenario📈 BONKUSDT | Long Setup – Fib Support + Price Action Scenario
I usually avoid trading meme coins from the Solana ecosystem, but many SOL-based memes are currently sitting at technically significant support levels — and BONK is one of them.
🔹 Price has retraced into the 0.618 – 0.65 Fibonacci support zone, which historically has acted as a strong reversal area.
🔹 This region aligns with previous liquidity grabs and provides a solid foundation for a potential trend reversal.
🔹 A developing consolidation structure here supports a scenario where price may sweep local lows before a bullish break.
🟢 Projected move:
– Some accumulation at support
– Gradual structure shift with higher highs and higher lows
– Upside potential targeting 0.00001998
– Followed by a healthy pullback/retest
🎯 Target: 0.00001998
🛡️ Stop: 0.00001106
📈 Risk/Reward Ratio: Technically strong long setup
Despite it being a meme, I approach this trade purely from a technical perspective. Price action matters more than the narrative.
⚠️ This is not financial advice.
#BONK #MemeCoin #Solana #Altcoins #BONKUSDT #CryptoAnalysis #TradingView

BONKUSDT Forming Bullish BreakoutBONKUSDT is showing some exciting bullish signs as it pushes out of a prolonged downtrend with a clear breakout setup. The chart you see highlights how this pair has been consolidating within a tight range and now seems ready to surge higher. With good volume supporting the current move, BONK is catching the eyes of traders looking for undervalued coins that have the potential for rapid upside. The price action shows a textbook breakout above resistance levels, which is often the first step for a sustained rally in the crypto market.
This pair has already attracted attention due to its unique community-driven nature and meme coin appeal, which tends to create sudden spikes when momentum builds up. As BONKUSDT attempts to deliver an expected gain of 90% to 100%+, it becomes an appealing choice for short-term swing traders and high-risk, high-reward portfolios. Many investors are betting on its potential to break through key price levels, which could trigger a wave of fresh buying volume.
As the crypto market continues to reward coins that demonstrate both technical strength and community hype, BONKUSDT stands out as one of those trending assets that could surprise to the upside. With a clear breakout from its falling wedge structure and the market sentiment turning positive, traders should keep a close eye on how it behaves around its current levels. Any strong candle closures above resistance could pave the way for an accelerated move.
✅ Show your support by hitting the like button and
✅ Leaving a comment below! (What is You opinion about this Coin)
Your feedback and engagement keep me inspired to share more insightful market analysis with you!
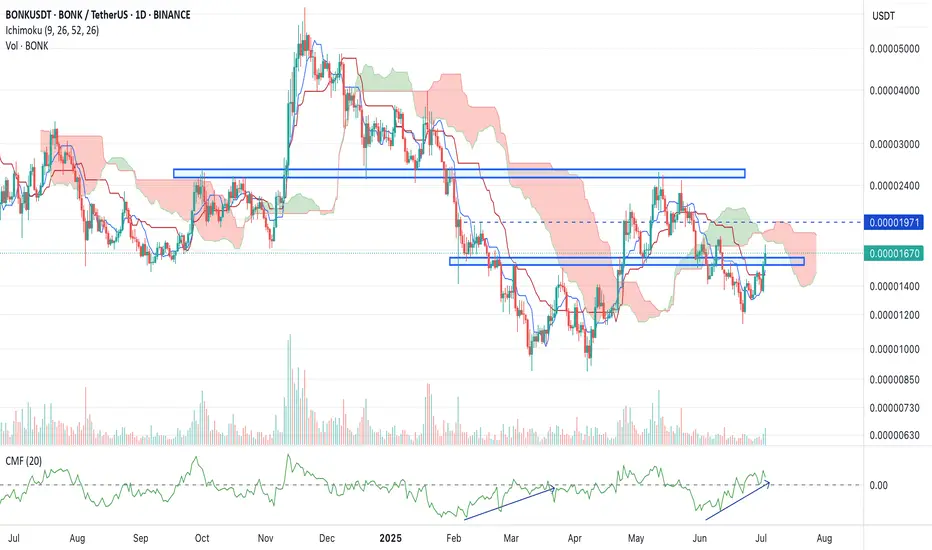
BONK/USDT Reaches Critical Juncture-Will it Rise?Bonk bulls prevented an excessive price plunge and triggered a rebound from $0.00001152, surging by over 50%. Currently, the memecoin has risen above a pivotal resistance zone, and a daily close above the levels may validate the start of a bullish trend. However, the bears are extracting the profit, which may cause prices to drop slightly.
The conversion and base lines of the Ichimoku Cloud have undergone a bullish crossover, suggesting a short-term upswing, while the Lead span A also displays a bullish divergence, which hints towards a long-term potential upswing. However, the price remains below the cloud, which suggests the bears are still in play.
The Chainkin Mony Flow, or CMF, underwent a steep upswing and surged above 0, hinting towards the growing strength in the market. Besides, this is complemented with a rise in the price, pointing towards a bullish continuation
Therefore, the BONK price is required to rise above $0.00001971 before the weekly close, which may secure a strong bullish trend for the upcoming days
Targets
Resistance 1: $0.00001971
Resistance 2: $0.00002206
Resistance 3: $0.00002500
Support 1: $0.00001449
Support 2: $0.00001302
Support 3: $0.00001147
BONK/USDTThis time, we reached a resistance area for this currency and I think this currency has the potential to be bullish. I have specified the target for you. Remember, this is an analysis, not an entry point. Tell me your opinion.

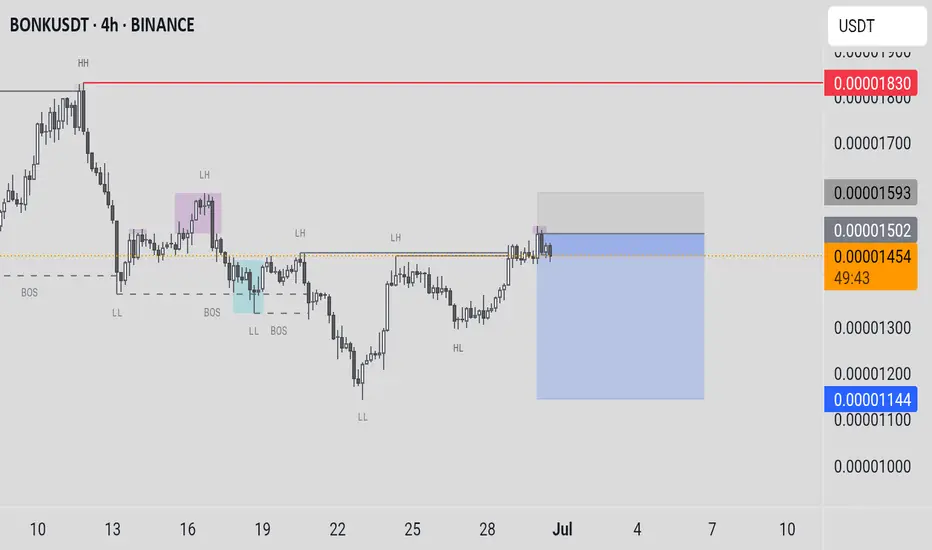
BONKUSDT Make A Falling Wedge Pattern In 4H Chart#BONK
Make a clean bullish Falling Wedge pattern on the 4H chart & Breakout It.Now We can Get a Long Position.
My profit Target
1 Target - $ 0.0001803
2 Target - $ 0.0001929
3 Target - $ 0.0002058
4 Target - $ 0.0002205
5 Target - $ 0.0002335

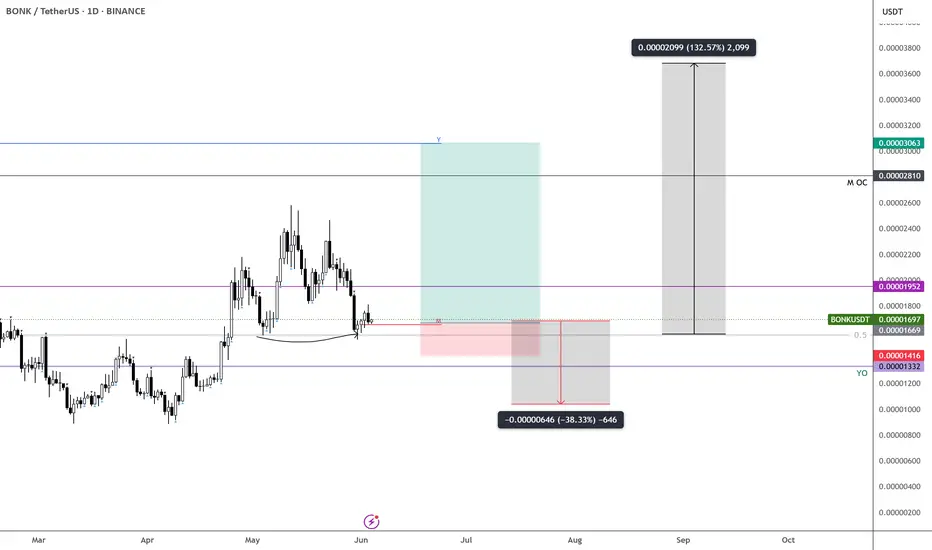
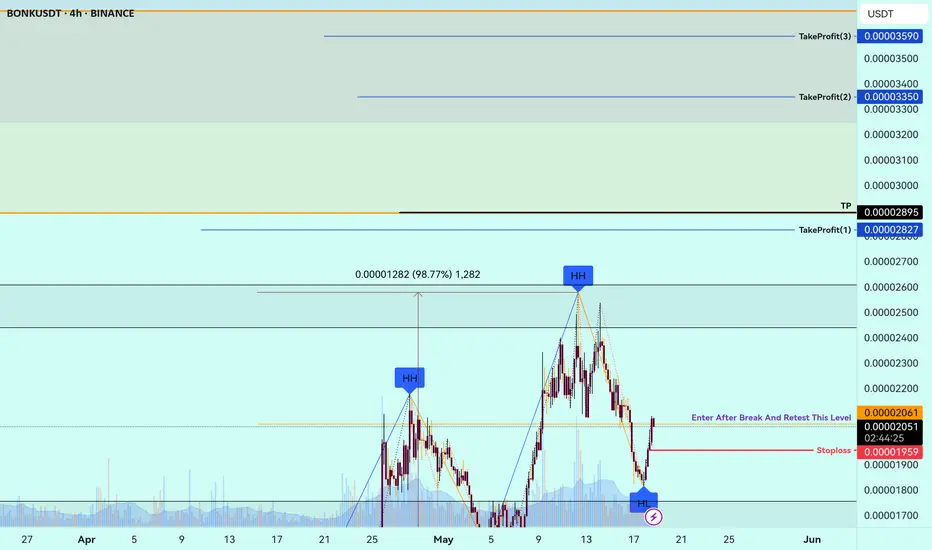
BONK – Long Here, Patience RequiredTime to go long on $BONK.
Hard not to bid at this level—the risk/reward is solid.
Still expecting some range-bound price action before the real move kicks in, so patience is key here.
First target: the yearly open—nearly a 2x from current levels. BINANCE:BONKUSDT
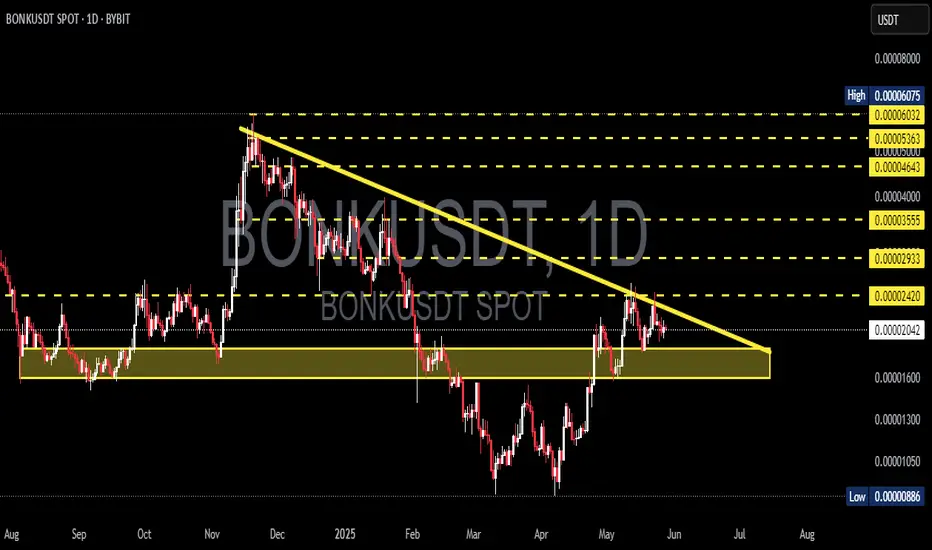
BONKUSDT 1D AnalysisBONK ~ 1D Analysis
#BONK Buy on retesting this support block or buy after successfully breaking this resistance line with a short term target of at least 15%+ and a long term target of $0.000065+
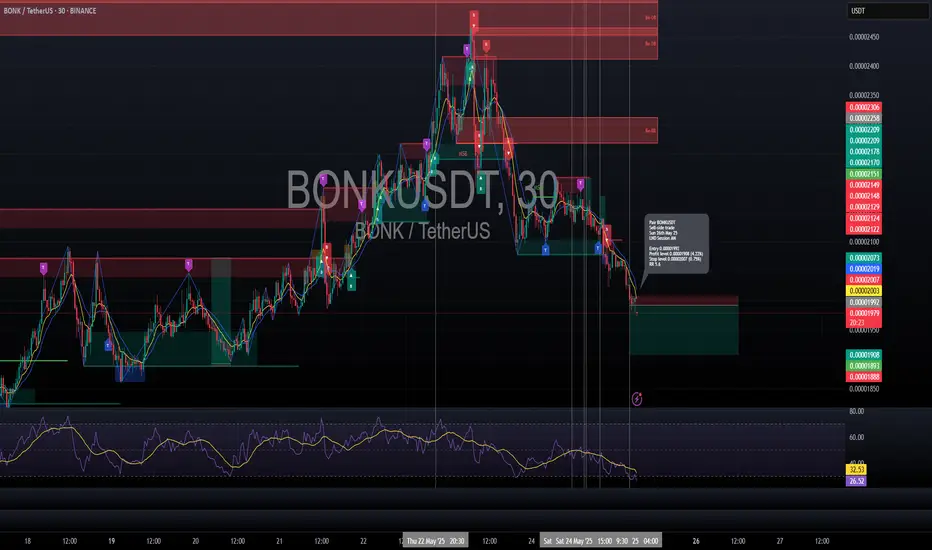
Short trade
🟥 Sell-side Trade Log
📉 Pair: BONK/USDT
🏷️ Type: Intraday | LND Session AM
🧠 Setup: Breakout
📅 Date: Sunday, 26th May 2025
🔹 Entry Price: 0.00001992
🔹 Profit Target: 0.00001908 (+4.22%)
🔹 Stop Loss: 0.00002007 (-0.75%)
🔹 Risk-Reward Ratio: 5.60
🔍 Reasoning:
This breakout trade was initiated after BONK/USDT failed to sustain its rally and formed a lower high structure. The price broke below a key intraday support zone during the LND AM session, signalling a shift in directional order flow.
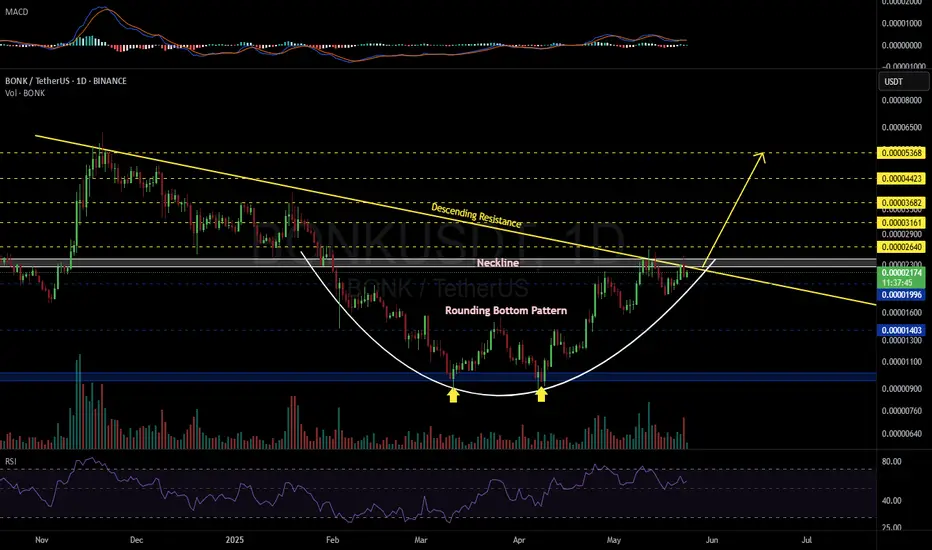
BONKUSDT 1D#BONK is on the verge of a potential breakout above the descending resistance and the neckline of the Rounding Bottom Pattern on the daily chart. A successful breakout could trigger a strong bullish move.
Targets after breakout:
🎯 $0.00002640
🎯 $0.00003161
🎯 $0.00003682
🎯 $0.00004423
🎯 $0.00005368
⚠️ Use a tight stop-loss.
BONK/USDT: Bullish Market Structure with 77% Upside PotentialBONK is maintaining a strong bullish market structure, marked by a clear series of higher highs and higher lows on the chart. Price recently rejected from the point of control (POC) resistance, initiating a healthy pullback toward the 200 EMA — a common support level in uptrending markets.
This corrective move is currently finding strong support at a confluence zone that includes the 200 EMA, a key daily support level, and the 0.618 Fibonacci retracement. This level is acting as a high-probability support region, where price action is now forming a range and confirming accumulation on lower timeframes.
The establishment of this range suggests that demand is present, and buyers are stepping in to defend the trend. Importantly, the higher low being put in here would keep the bullish structure intact and signal a potential continuation towards new highs.
From a volume profile standpoint, each leg higher has been accompanied by increasing volume — a healthy sign for continuation. Bulls remain in control, and if price holds this level and breaks above the POC resistance on a closing basis, a move toward higher resistance levels becomes increasingly likely.
The upside target from this potential continuation is approximately a 77% gain, aligning with previous swing highs and projected Fibonacci extensions.
In summary, BONK remains bullish, with the current pullback offering a possible higher low setup. Watch for a confirmed breakout above the POC resistance — that will likely be the catalyst for the next impulsive move higher.

Long trade
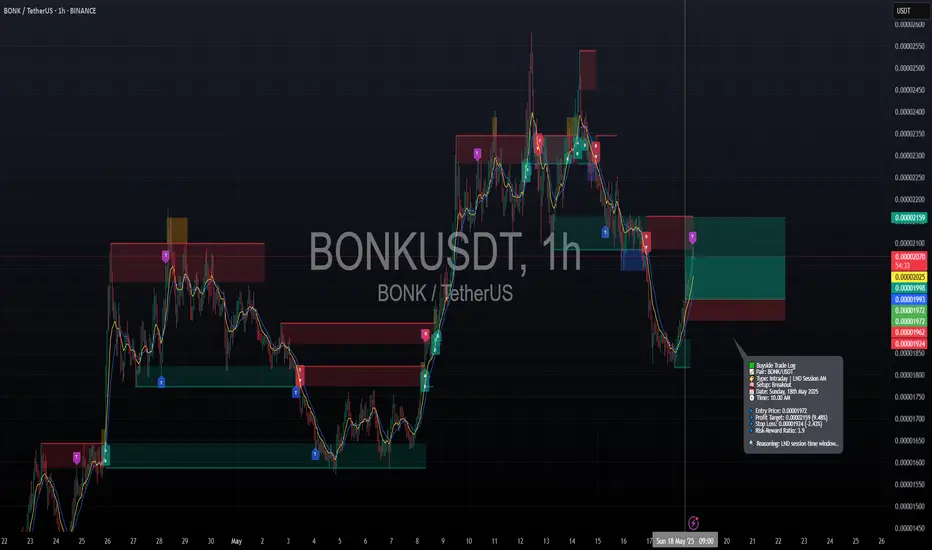
🟩 Buyside Trade Log
📈 Pair: BONK/USDT
🏷️ Type: Intraday | LND Session AM
🧠 Setup: Breakout
📅 Date: Sunday, 18th May 2025
🕥 Time: 10:00 AM
🔹 Entry Price: 0.00001972
🔹 Profit Target: 0.00002159 (+9.48%)
🔹 Stop Loss: 0.00001924 (-2.43%)
🔹 Risk-Reward Ratio: 3.90
🔍 Reasoning:
The trade was initiated during the LND session AM window, where price action showed a clear breakout from short-term resistance. Momentum aligned with a surge in volume, suggesting strong buyside intent.
Buy Trade Strategy for BONK: Riding the Solana Meme Token WaveDescription:
This trading idea is based on BONK, a meme-based cryptocurrency launched on the Solana blockchain, gaining massive community support and attention for being Solana’s answer to Dogecoin and Shiba Inu. BONK stands out for its vibrant, decentralized community and deflationary tokenomics, which aim to encourage long-term holding and discourage excessive speculation. With strong grassroots momentum and integration across various Solana-based DeFi and NFT platforms, BONK has established itself as more than just a meme, becoming a symbol of community resilience and innovation within the Solana ecosystem.
However, despite its popularity, BONK remains a highly speculative asset. Meme coins are particularly sensitive to market sentiment, social media hype, and broader crypto trends. As such, price movements can be extremely volatile and unpredictable.
Disclaimer:
This trading idea is intended for educational purposes only and does not constitute financial advice. Cryptocurrencies like BONK carry high risk, including the potential for total capital loss. Always conduct thorough research, evaluate your risk tolerance, and consult a licensed financial advisor before investing. Past performance is not indicative of future results.
BONKUSDT: The Meme Coin Ready to Bounce! 📊 Key Stats (Live Update)
- Current Price: $0.000022
- Volume: $1.33M (Accumulation phase)
📈 Critical Levels
- Strong Support: $0.0000192
- Immediate Resistance: $0.000027
- Breakout Target: $0.00004 (+85% upside)
🔥 Why BONK Could Moon
1. Extreme Discount: 92% below ATH ($0.00003275)
2. Meme Coin Rally: WIF +12% today showing sector strength
3. Technical Setup: Bullish divergence forming
🎯 Trading Plan (Updated)
- Ideal Entry: $0.000019-$0.000020 zone 🚀
- Scalp Targets:
→ $0.000025 (+13.2%)
→ $0.000027 (+22.2%)
- Swing Targets:
→ $0.000028 (+40%)
→ $0.000035 (+75%)
- Risk Management:
→ Stop Loss: $0.000018
→ Position Size: 1-3% of portfolio
⚠️ Crucial Notes
1. High volatility expected - set alerts
2. Watch BTC dominance for market direction
3. Smaller exchanges may have price discrepancies
📌 Unique Opportunity
At current levels, BONK offers one of the highest risk/reward ratios in meme coins with:
- 80%+ upside potential to ATH
- Limited downside to strong support
🔍 Live Metrics to Watch
1. 4H RSI: 52 (neutral)
2. Volume Spike: $2M+ needed for breakout
3. Exchange inflows/outflows
---
NOT FINANCE ADVICE | DYOR always 💡 Visual Enhancements
Ready for the BONK resurgence? Would you like me to adjust the entry strategy for more conservative traders? 🐶

BONK looks ready to pivot—clear skies aheadLiking the price action so far. It’s flipped above the mid-level, which aligns with key pivots across multiple timeframes.
Ideally looking for a week of consolidation here before the next major move.
Entry around 0.0000158
Targeting 0.000028 if things unfold as expected
SEED_DONKEYDAN_MARKET_CAP:BONK BINANCE:BONKUSDT
#BONK/USDT#BONK
The price is moving within a descending channel on the 1-hour frame, adhering well to it, and is on its way to breaking it strongly upwards and retesting it.
We are seeing a bounce from the lower boundary of the descending channel. This support is at 0.00002070.
We have a downtrend on the RSI indicator that is about to break and retest, supporting the upward trend.
We are looking for stability above the 100 moving average.
Entry price: 0.00002205
First target: 0.00002287
Second target: 0.00002404
Third target: 0.00002551

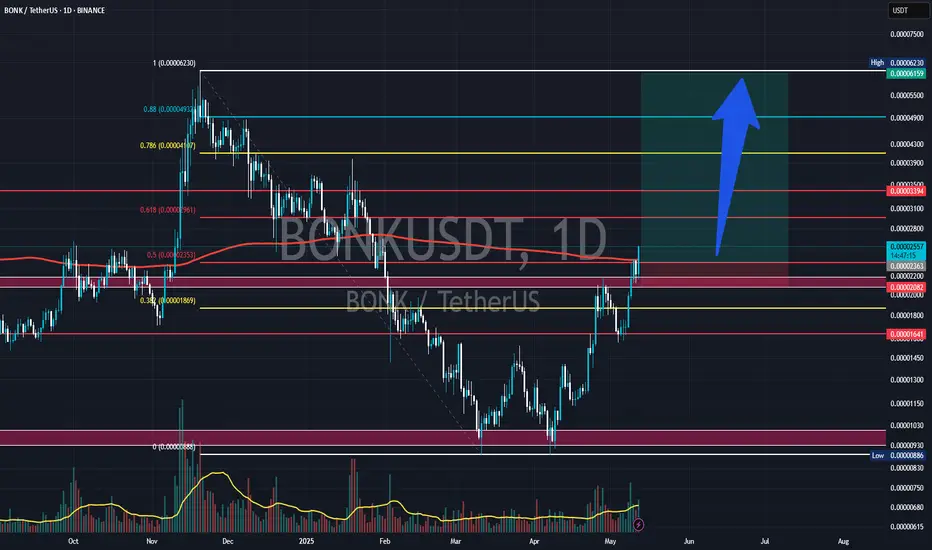
BONK/USDT Bullish Analysis 🚀 BONK/USDT Bullish Analysis 🚀
📈 Key Bullish Factors: 🔹 📊 Fibonacci Levels: Price near 0️⃣ (0.0000885)—potential targets 0️⃣.382 (0.0001869) & 0️⃣.618 (0.0002961) 🔹 📈 Volume Spike: Increased trading activity = strong market demand 🔹 📉 Moving Averages: A breakout above 200-day MA confirms bullish trend 🔹 🔥 Candlestick Pattern: Strong bullish candles = High buying pressure
💡 Bullish Scenario: ✅ If 0.000035 resistance breaks → targets 0.00004 then 0.0000485 💥 ✅ If surpasses 🚀 0.0000485, next major milestone ✨ 0.0000623
🛡️ Support Levels: 🔸 Correction → Key support at 0.000022 💎 Hold = Bullish momentum continues
⚡ Momentum is building! Are we ready for liftoff? 🚀🌕💰
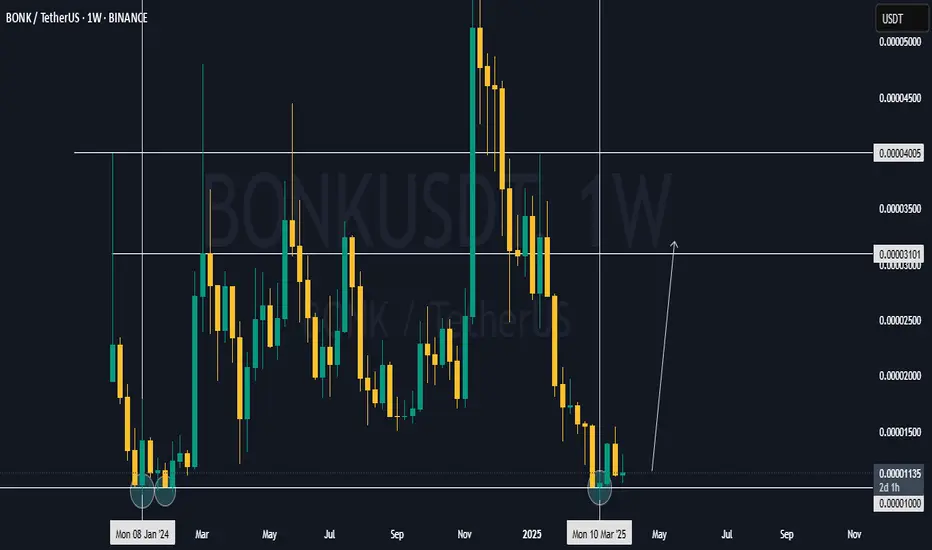
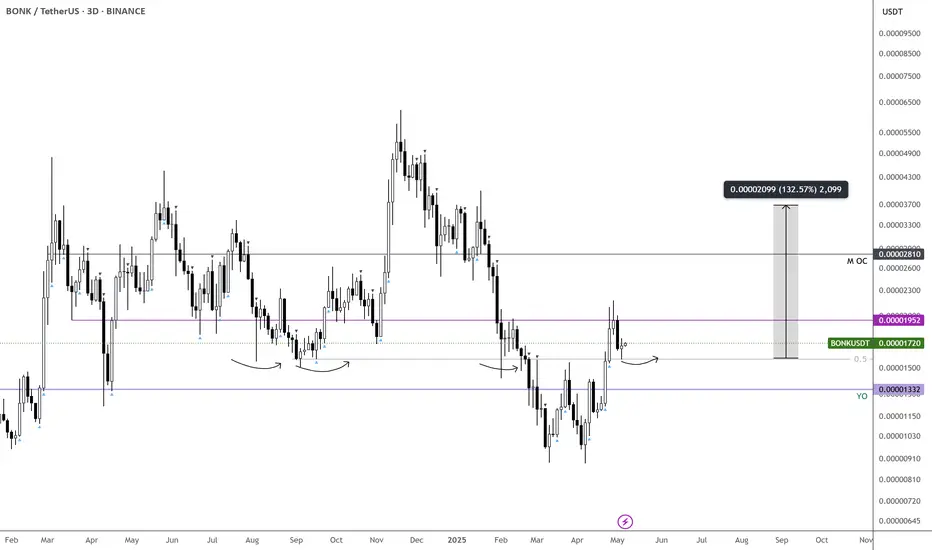
Bonk at Floor Price - 2x to 3x Pump Incoming?SEED_DONKEYDAN_MARKET_CAP:BONK has retested its 2024 floor price at $0.00001 - a zone that previously triggered strong upward moves. Could this be a reliable support once again and spark a 2x to 3x bounce from current market price at $0.00001135?
What's your take - bounce or breakdown from here?
Share your thoughts below!
Kindly support this idea with a LIKE👍 if you find it useful🥳
Happy Trading💰🥳🤗