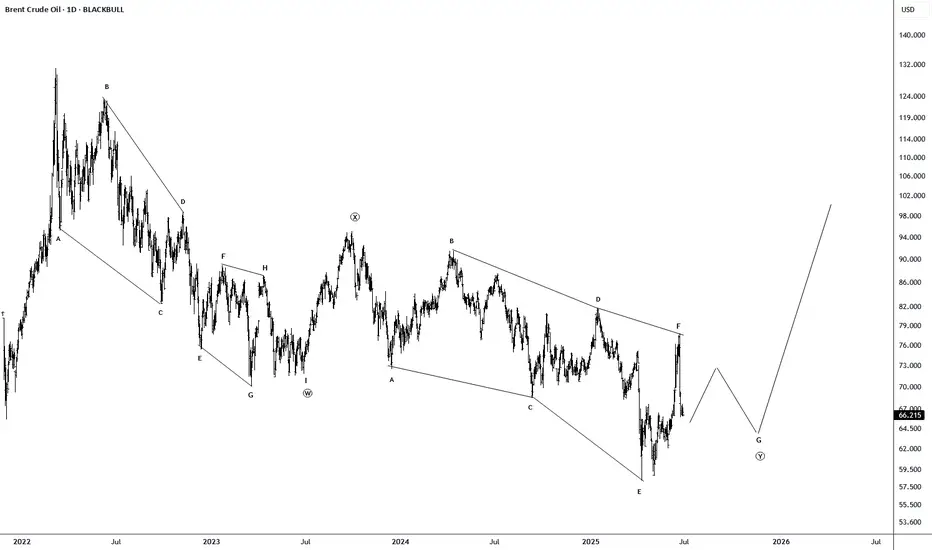
Crude oil $ukoil - Final falling oil has been a barometer of the financial market for the last decades.
I look at the formations and I see that we will see a renewal of the bottom in the coming months, I will not say the reasons, you just need to wait a little.
I've been talking about the fall for a long time, but it's not over yet.
After the final fall, I expect a renewal of the highs, due to the worsening situation in the Middle East, this will be after September
Best Regards EXCAVO
BRENT trade ideas
Middle East Tensions vs. Global Demand Hello Traders 🐺
🧠 Fundamental Insight:
Recent geopolitical developments in the Middle East — particularly tensions involving Iran, Israel, and unrest around the Red Sea shipping routes — have reignited fears of supply shocks in the oil market.
But how much of this is just market sentiment, and how much is a real, structural threat?
It’s important to note that most oil-producing nations in the Middle East are heavily reliant on oil revenue to sustain domestic budgets.
Prolonged disruption in oil supply would backfire economically, forcing them to eventually restore production — or risk budget deficits, currency devaluation, or inflation.
Moreover, while global efforts are pushing toward electrification and renewable energy, a large portion of electricity is still generated using fossil fuels — many of which are petroleum-based.
So even as demand shifts in form (from gasoline to electricity), crude oil remains embedded in the global energy matrix.
🇺🇸 The U.S. & 🇨🇳 China: Macro Drivers at Work
The U.S. remains the world’s largest oil producer thanks to shale output. Any significant rise in Brent can be quickly counterbalanced by a ramp-up in U.S. production.
The Fed’s monetary policy also plays a role. A stronger USD (via rate hikes) generally pressures oil prices downward.
China, as the largest importer of crude, has a decisive influence on demand. Weak industrial output or real estate troubles in China can nullify even a strong supply shock.
Watch for China’s stimulus policies — any sign of renewed growth can boost Brent significantly.
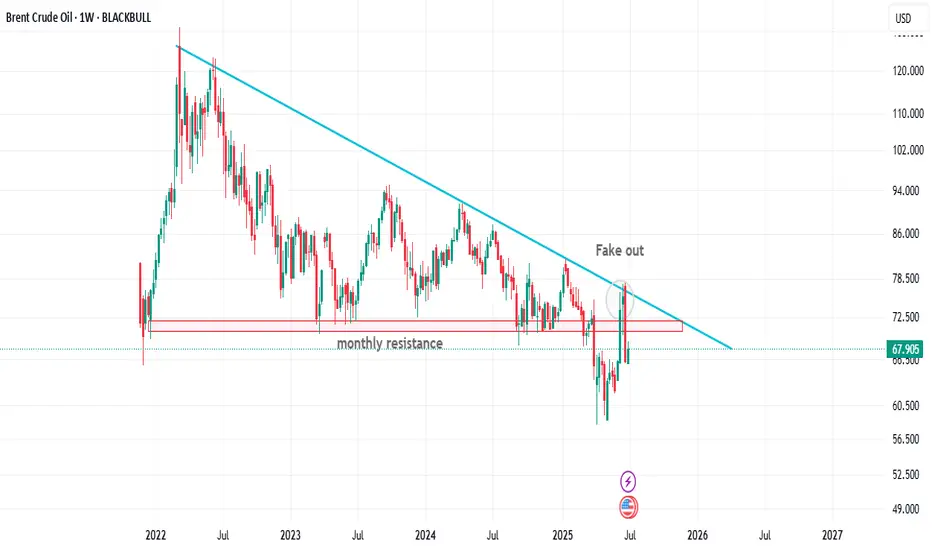
📉 Technical Outlook (Brent Crude - Weekly Chart Hypothesis):
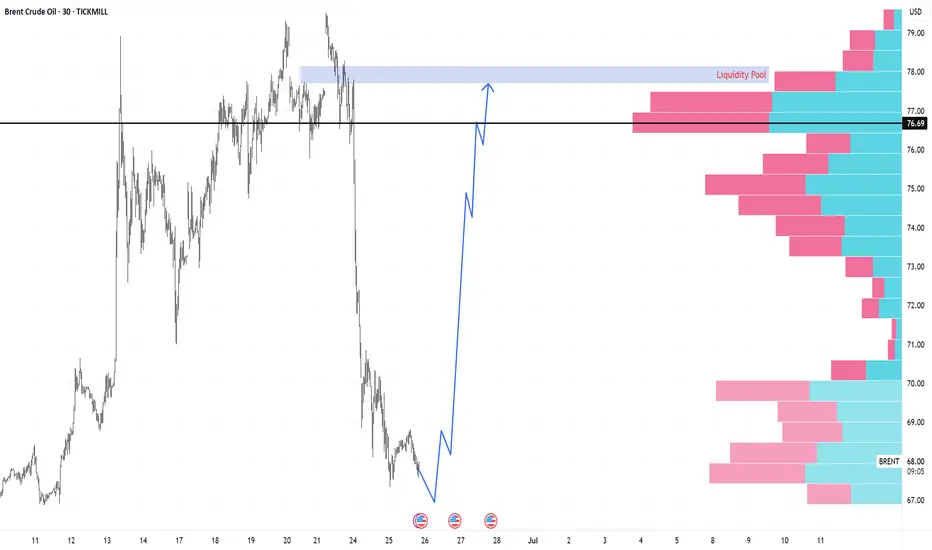
As you can see on the weekly chart , price was trying to pump above the monthly resistance area however It's turned into the fake out and all of us knows that this is a massive sign of weakness for BRENT but I still think that price is currently could goes a little bit higher than the current level and break above the blue trend line in the mid term .
Any news-driven spike (e.g., new conflict headlines) must be validated by volume and follow-through — otherwise, it's a fade opportunity.
🎯 Conclusion:
Don’t blindly buy into every geopolitical headline.
While the Middle East remains a key risk factor for Brent, true price action will depend on the balance between physical disruptions and global demand signals — particularly from the U.S. and China.
In this market, the chart reacts first, but macro confirms the move.
As traders, we must track both — not just price, but purpose.
let me know what you are thinking about the current situation in the comment section down below !
and as always remember :
🐺 Discipline is rarely enjoyable , but almost always profitable 🐺
🐺 KIU_COIN 🐺
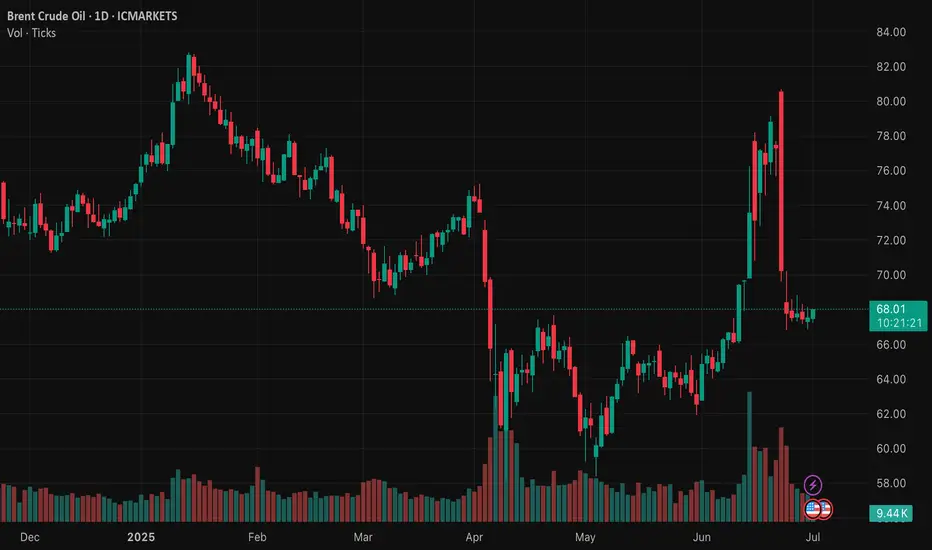
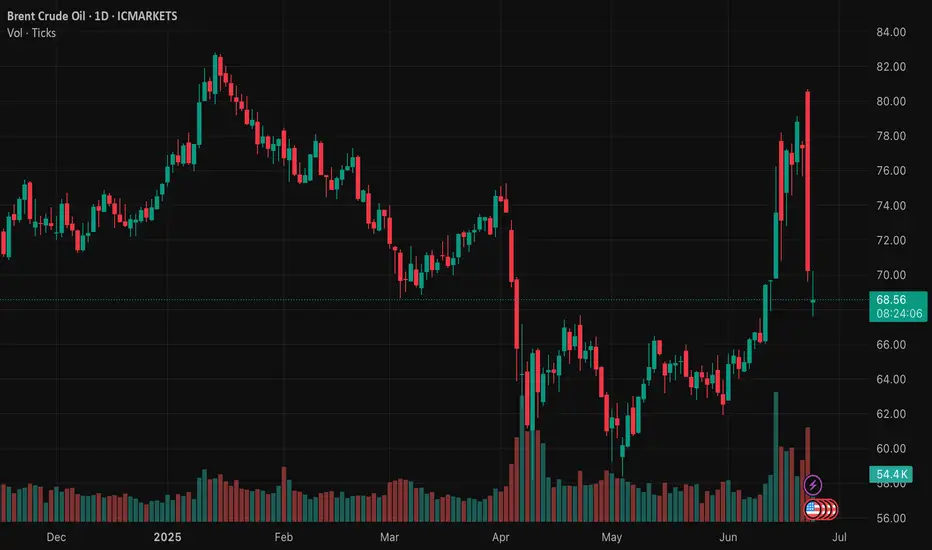
Here's why oil prices continue to slumpBrent Crude remains under pressure and has really caught our eye. The weakness in recent weeks is significant. The price recently failed to hold above its 200-day moving average, reinforcing downside risks. Without momentum, prices could revisit June lows unless short-term hurdles at US$69 and US$72 are decisively cleared.
This weakness aligns with BP's latest Energy Outlook, which is due out this week (usually in July each year). We'll be keeping a close on global wind and solar capacities, which are projected to increase eightfold and fourteenfold, respectively, by 2050. This rapid growth in renewables, coupled with declining oil demand, suggests a structural shift in energy markets.
China is leading this shift. By 2030, it is projected to install over 500 gigawatts of solar capacity annually, surpassing the United States' total annual energy production. This underscores the scale of China's renewable energy expansion.
The technical rejection at the 200-day moving average, combined with BP's forecasted demand peak, indicates a bearish outlook for oil. Unless Brent can reclaim and sustain levels above key resistance points, further declines are likely.
The convergence of technical weakness and shifting demand dynamics underscores a bearish stance on oil. Traders should monitor key technical levels and remain cautious amid these evolving market conditions.
The forecasts provided herein are intended for informational purposes only and should not be construed as guarantees of future performance. This is an example only to enhance a consumer's understanding of the strategy being described above and is not to be taken as Blueberry Markets providing personal advice.

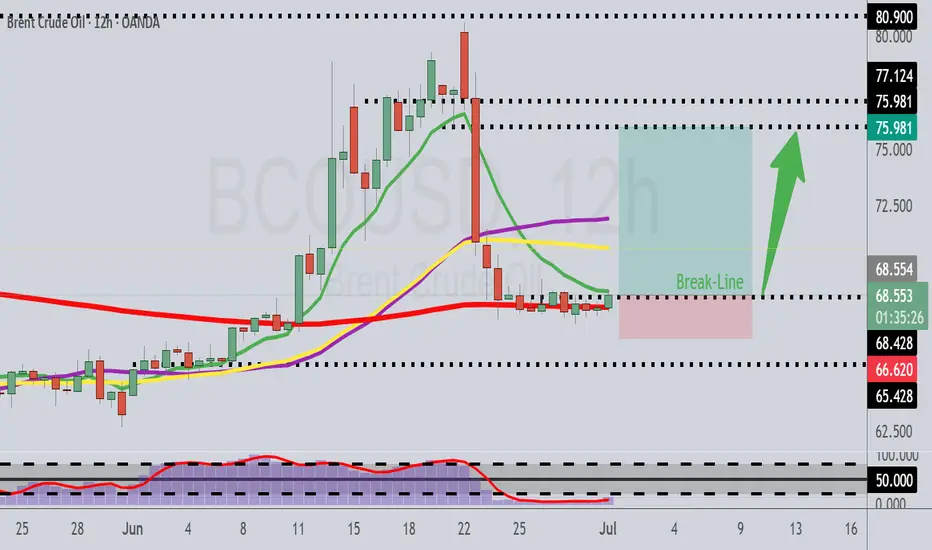
Breakout In Crude OilHey fellow traders! Looks like we could have a breakout in crude oil!
Summer's here so, no surprise we would see a rise.
Target price is 75.981 area.
Beat the summer increase in gas prices by joining in on the action and long the crude futures.
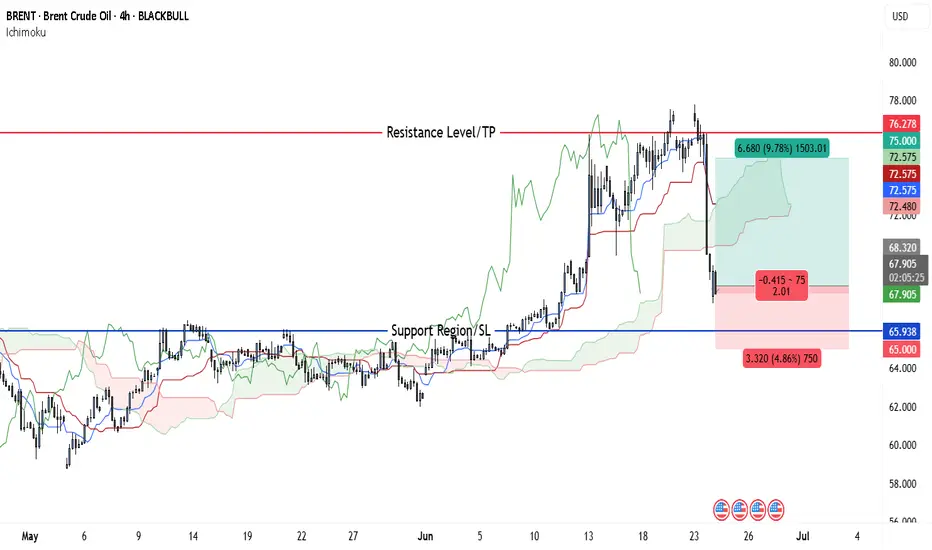
Brent Crude Oil Long Swing Setup – Support Break at Key LevelBrent Crude Oil OANDA:BCOUSD has broken to the next key support level after a cease-fire announcement in the Middle East. A long position is considered only if support holds at $69.00.
📌 Trade Setup:
• Entry Zone: $69.00
• Take Profit Targets:
🥇 $73.50 – $76.00
🥈 $79.00 – $83.00
• Stop Loss: Daily close below $67.00
#BrentCrude #OilTrading #ForexTrading #LongPosition #SupportLevel #TradeSetup #CrudeOil #MarketAnalysis #TradingOpportunities #Commodities #OilMarket #Investing #PriceAction #OilPrices #TradingStrategy #ForexCommunity #InvestmentOpportunities #MarketUpdate
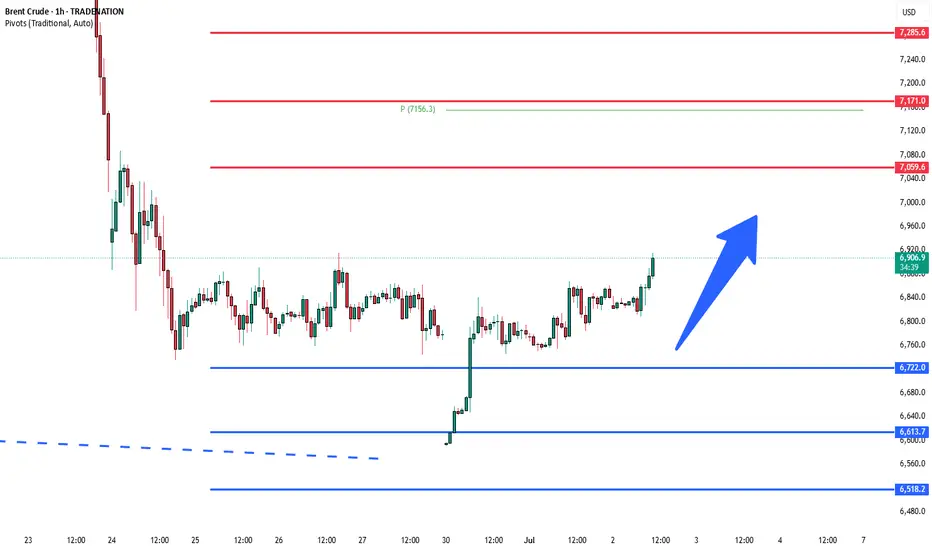
Brent Crude support at 6720Key Support and Resistance Levels
Resistance Level 1: 7060
Resistance Level 2: 7170
Resistance Level 3: 7280
Support Level 1: 6720
Support Level 2: 6610
Support Level 3: 6520
This communication is for informational purposes only and should not be viewed as any form of recommendation as to a particular course of action or as investment advice. It is not intended as an offer or solicitation for the purchase or sale of any financial instrument or as an official confirmation of any transaction. Opinions, estimates and assumptions expressed herein are made as of the date of this communication and are subject to change without notice. This communication has been prepared based upon information, including market prices, data and other information, believed to be reliable; however, Trade Nation does not warrant its completeness or accuracy. All market prices and market data contained in or attached to this communication are indicative and subject to change without notice.
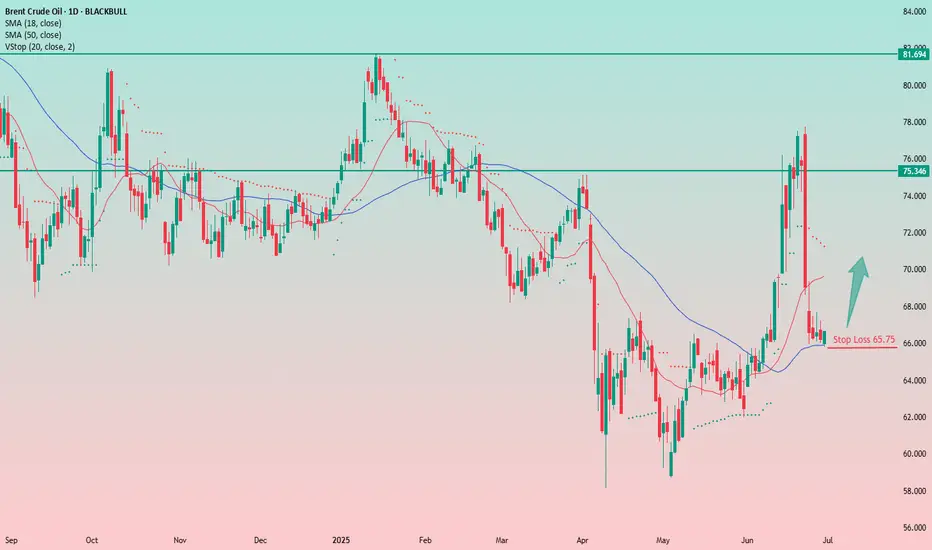
Crude Oil Bounce PlayAn interesting setup in crude oil with a tight stop at $65.75 and the first target in the $70–71 range.
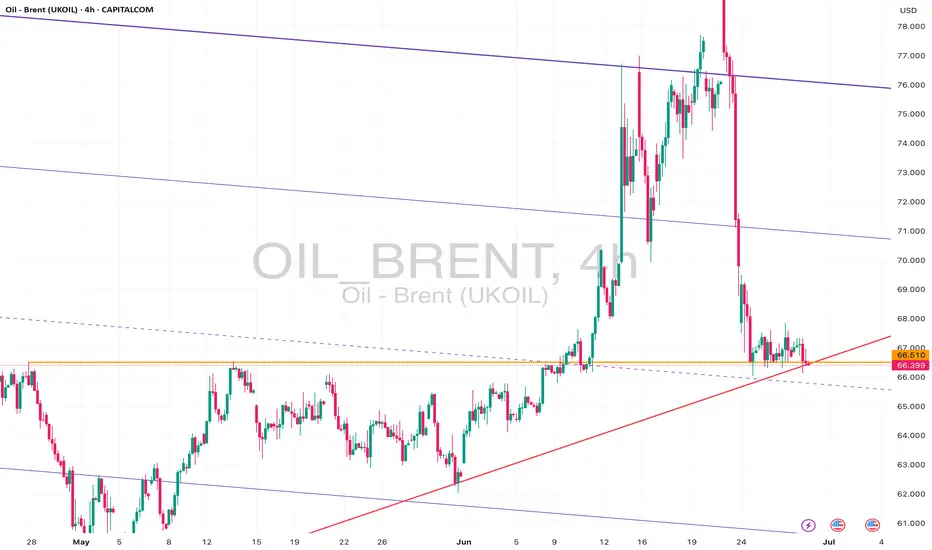
It’s a bounce play. I'm usually not a big fan of these, but here I like the tight stop, the broader macro context, the sharp drop from the $76 level, and the subsequent consolidation around $66.5.
Let’s see how it plays out — I’ve entered long!
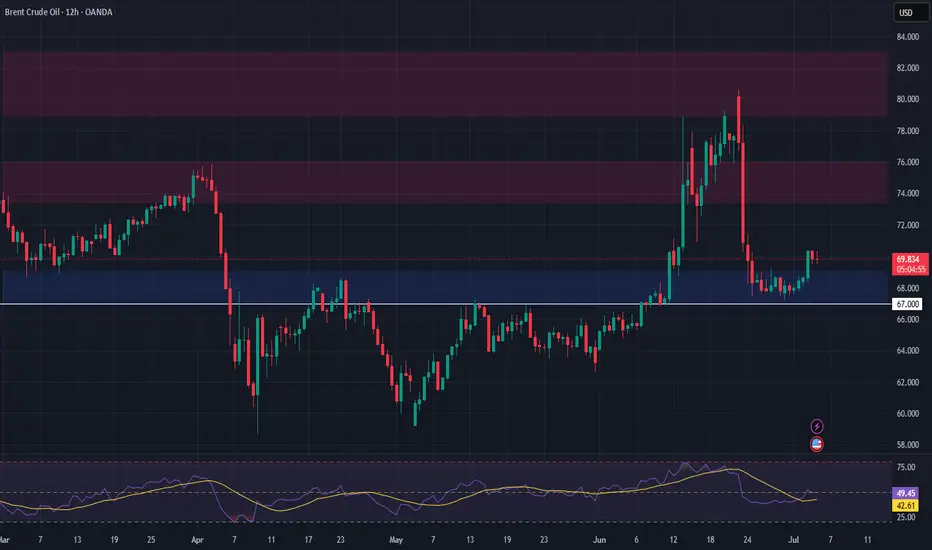
XBRUSD is testing the Support Level 66.10 👀 Possible scenario:
Oil prices were steady on July 1 as investors awaited the expected OPEC+ decision to raise output by 411,000 bpd in August. If confirmed at the July 6 meeting, it would bring this year’s total increase to 1.78 million bpd—over 1.5% of global demand.
The move, led by Saudi Arabia, aims to curb overproduction and regain market share. Meanwhile, easing geopolitical tensions and weak Chinese manufacturing data added downward pressure. Trade talks also remain in focus ahead of Trump’s July 9 tariff deadline, which could raise global trade uncertainty. Morgan Stanley sees Brent falling to $60 by early 2026 on oversupply and waning risks.
✅ Support and Resistance Levels
Now, the support level is located at 66.10.
Resistance levels are now located at 77.50 .
Brent crude: why I'm not trading oil right nowBrent crude surged earlier this month on war headlines, and our trade setups nailed the moves. But right now, the market offers no edge. Volatility is fading and price is stuck in a large triangle. Unless you have geopolitical insight, there's no clear reason to trade. In this video, I explain why I'm staying out and what I’ll look for next.
This content is not directed to residents of the EU or UK. Any opinions, news, research, analyses, prices or other information contained on this website is provided as general market commentary and does not constitute investment advice. ThinkMarkets will not accept liability for any loss or damage including, without limitation, to any loss of profit which may arise directly or indirectly from use of or reliance on such information.

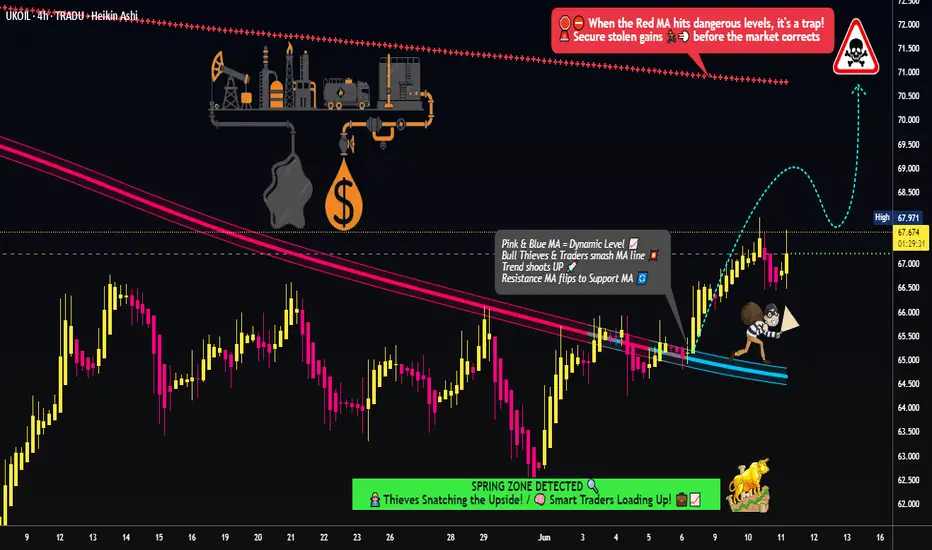
Brent Oil Robbery: The Thief’s Guide to Energy Market Profits! 🚨💰 THE OIL VAULT HEIST: UK OIL SPOT/BRENT TRADING STRATEGY 💸🔫
🌟Hi! Hola! Ola! Bonjour! Hallo! Marhaba!🌟
Dear Money Makers & Robbers 🤑💰💸✈️
Based on our 🔥Thief Trading style analysis🔥 (both technical and fundamental), here’s the master plan to heist the UK Oil Spot/Brent Energy Market. Follow the blueprint carefully—this strategy focuses on long entries, with a daring escape planned near the high-risk RED MA Zone where bearish robbers and consolidation traps await. 🏆💸 Take your profit and treat yourself, fellow traders—you earned it! 💪🏆🎉
🕵️♂️ Entry 📈
💥 The vault is wide open! Time to swipe that bullish loot—heist is on!
Place buy limit orders within the 15 or 30-minute timeframe, near swing lows/highs for pullback entries.
🛑 Stop Loss 🛑
📍 Thief’s SL—recent swing low and below the moving average (4H timeframe) for day/swing trades.
📍 Adjust SL based on risk, lot size, and number of orders.
🎯 Target
🏴☠️💥 70.800 (Aim for the big loot!) OR escape before the target
🔥 Market Heist Overview
The UK Oil Spot/Brent market is currently showing bullishness 🐂, driven by key factors—perfect for a day/scalping trade robbery! ☝☝☝
📰 Additional Tools & Analysis
📊 Get the Fundamental, Macro, COT Report, Quantitative Analysis, Sentiment Outlook, Intermarket Analysis, Future Targets—check our bi0 liinks 👉👉👉🔗🔗
⚠️ Trading Alert: News Releases & Position Management
📰 News can rattle the vault! 💥
✅ Avoid new trades during news releases.
✅ Use trailing stop-loss orders to protect profits.
💖 Supporting our heist plan?
💥 Smash the Boost Button 💥 to empower the robbery team.
Let’s make money every day in this market with the Thief Trading Style! 🏆💪🤝❤️🎉🚀
👀 Stay tuned for the next robbery plan, thieves! 🤑🐱👤🤗🤩
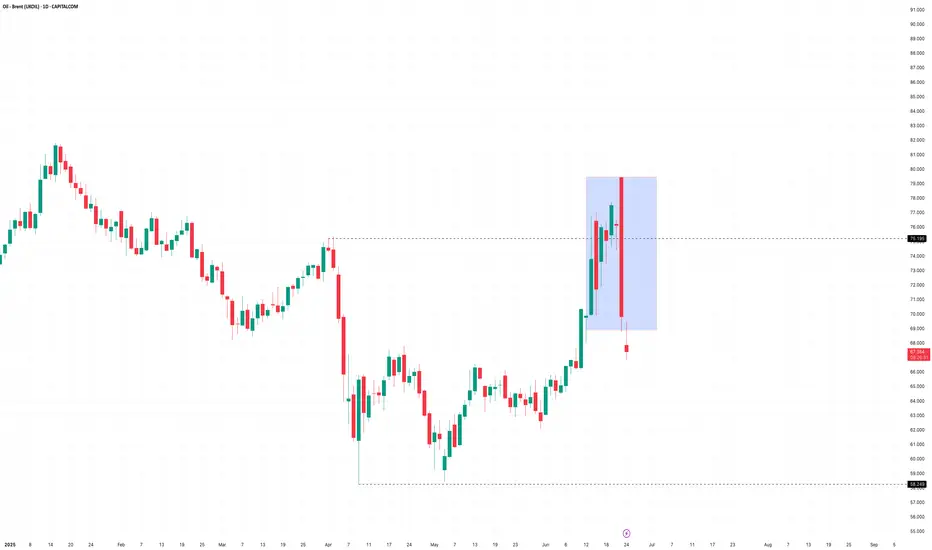
Brent Forms Bearish Engulfing Candle Amid De-escalation ShiftCrude oil’s conflict-driven rally may have run its course. After surging into resistance last week, Brent has now reversed sharply on signs of de-escalation in the Middle East.
Ceasefire Hopes Trigger a Sharp Reversal
Last week we highlighted that crude oil’s rally on the back of the Middle East conflict had taken the market right into a confluent area of resistance. While prices managed to break and hold above that resistance towards the end of the week as the conflict escalated, Monday’s session saw a sharp change in tone. The market gapped higher at the open following news of President Trump’s decision to bomb Iranian nuclear facilities, but those gains quickly unravelled.
What followed was a heavy sell-off as traders responded to rumours of a ceasefire agreement and interpreted Iran’s missile strike on a US base in Qatar as a calibrated, face-saving gesture. Market participants drew parallels with the 2020 playbook, where Tehran signalled retaliation while quietly coordinating with Washington to avoid further escalation. By the close, crude had surrendered all its intraday gains, and the conflict premium began to rapidly unwind.
Brent Crude (UKOIL) Daily Candle Chart
Past performance is not a reliable indicator of future results
Bearish Engulfing Pattern Shifts Momentum
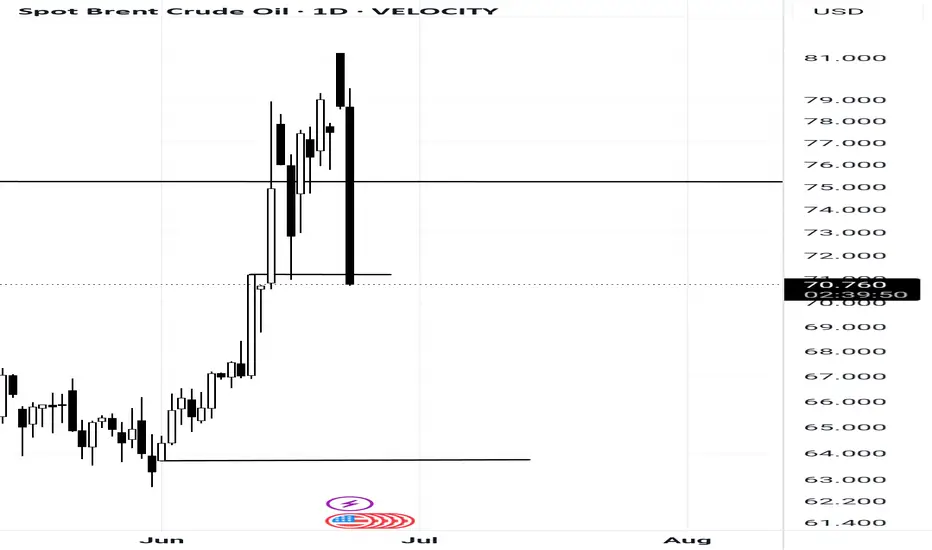
Technically, the Monday’s price action left behind a large bearish engulfing candle which is a strong reversal signal where the day’s range eclipses the trading ranges of previous sessions. In this case, the engulfing candle swallowed the prior six days of price action, reinforcing its importance. The structure of this move consisting of a gap higher followed by a persistent sell-off suggests that buyers were caught offside and forced to capitulate.
The top of Monday’s candle now marks a key short-term high. It is the point where the rally met decisive selling pressure and provides a clear reference level for traders tracking short-term momentum. With the broader trend still defined by a series of lower highs and lower lows, the failure at resistance realigns the short-term outlook with the bigger picture.
That said, this remains a highly volatile and fluid situation. Geopolitical tensions can flare up again without warning, and markets are likely to remain headline-sensitive. Traders should use tools like the average true range (ATR) to calibrate risk appropriately in this fast-moving environment.
Brent Crude (UKOIL) Bearish Engulfing Pattern on Daily Candle Chart
Past performance is not a reliable indicator of future results
Disclaimer: This is for information and learning purposes only. The information provided does not constitute investment advice nor take into account the individual financial circumstances or objectives of any investor. Any information that may be provided relating to past performance is not a reliable indicator of future results or performance. Social media channels are not relevant for UK residents.
Spread bets and CFDs are complex instruments and come with a high risk of losing money rapidly due to leverage. 85.24% of retail investor accounts lose money when trading spread bets and CFDs with this provider. You should consider whether you understand how spread bets and CFDs work and whether you can afford to take the high risk of losing your money.
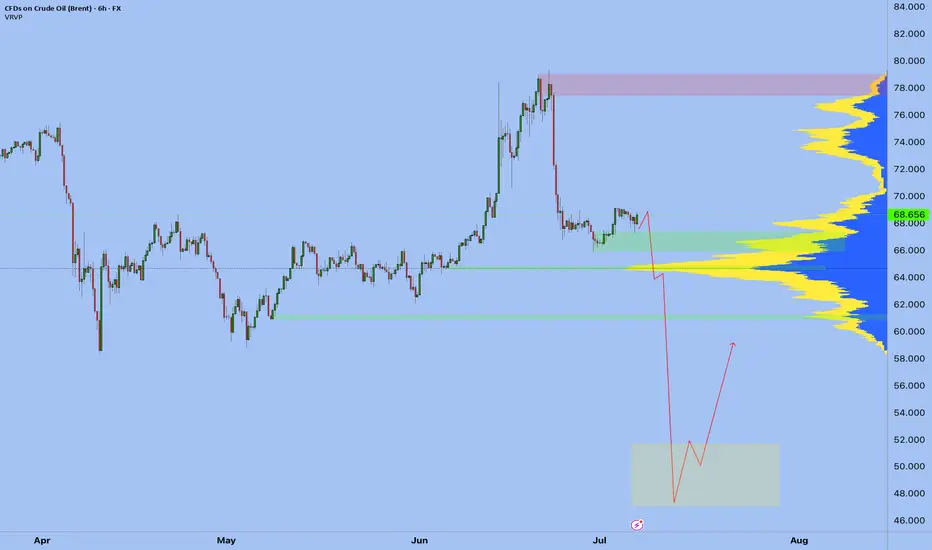
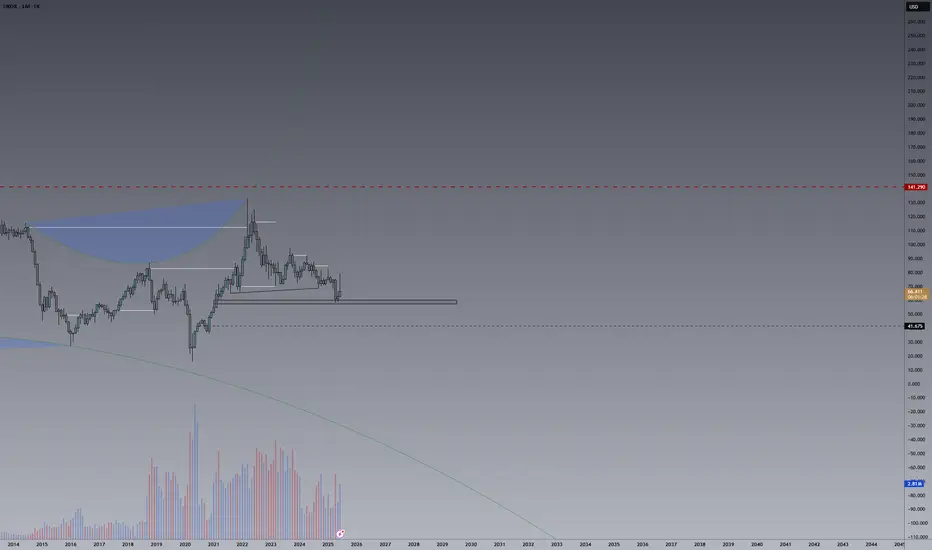
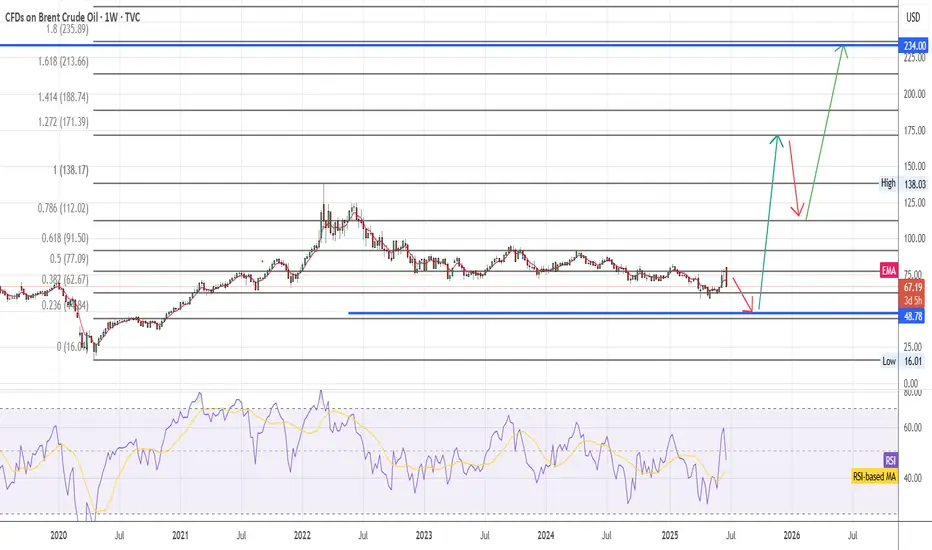
Brent Update - fall to 48$ area before trend reversalIn my updated view brent long term bearish trend has not stopped to 58$ area I expect in the short term a fall to 48$ area then the reversal my targets are 171$ and 234$
Brent Oil – Bearish Break or Bounce from Long-Term Support?Brent Oil is hovering just above critical support near 66.00, with a clear bearish structure visible across timeframes:
🔎 15m & 1h:
Price action is consolidating near the ascending support trendline drawn from early June lows. Short-term price structure shows lower highs and lower lows, suggesting continued downside pressure.
📉 4h & 1D:
The recent sell-off from above 78.00 has pushed Brent back into the lower region of the broad descending channel. Daily and 4h charts show price testing confluence between the horizontal support at ~66.00 and a long-term rising trendline. A confirmed close below this level could accelerate bearish momentum towards 64.00 or even 62.00.
⚠️ Key Levels:
• Support: 66.00, 64.00, 62.00
• Resistance: 67.00, 69.00
• Bias: Bearish – price remains in a clear downtrend unless buyers reclaim above 67.50 with strong volume.
📌 Outlook:
As long as Brent holds below 67.00 and the descending trendline caps rallies, my bias is bearish. A breakdown of 66.00 on higher timeframes would open the door for a move towards lower channel support levels. However, if buyers defend and push back above 67.50, we could see a short-term relief rally.
OILI think this scenario can be considered for oil. Could the reason be the ongoing military conflict between Iran and Israel?
BRENT likely to reach 77.73 levelBRENT moved higher level due to war situation. BRENT is currently in downtrend and consolidating.
After consolidation BRENT is likely to rise back to 77.73 level.
This is for educational purpose only. Not an investment or financial advise.
Brent Crude still in controlled yr 2025 range ~ 75 - 71 - 63 USThe Brent crude oil price today underwent a technical correction in the D1 / Day time frame as seen from a technical analysis standpoint. It has not yet broken out to indicate Panic in markets of while being within controlled thresholds .
2025 opening price level : USD 75 ;
MAY face support at USD 71 which is JUNE resistance ; can range around this price line
Next drop below June 2025 opening price : USD 63
Experience in markets also say that in order to go Up , markets need a timely Correction (preliminary down move )too !!
Time to Wait and Watch !
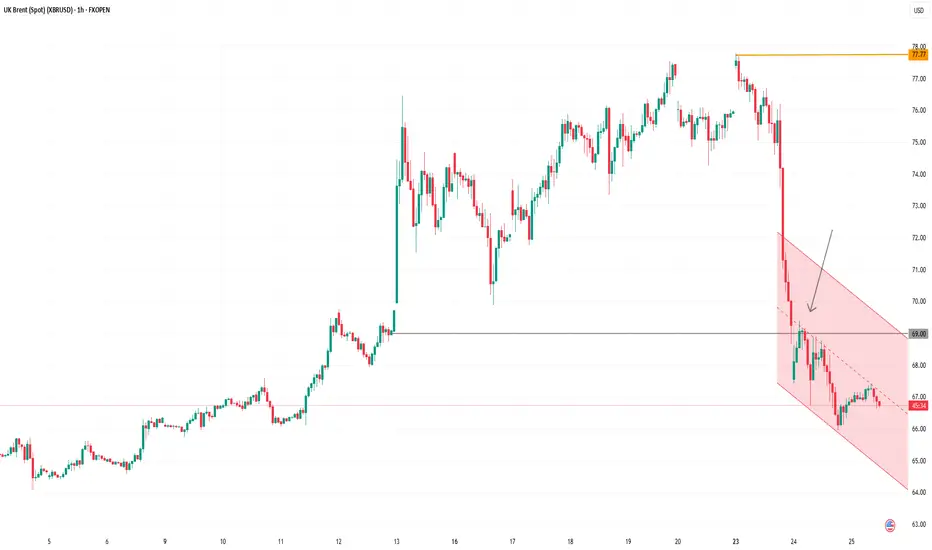
Oil Price Falls Below $69Oil Price Falls Below Pre-Escalation Levels of Middle East Conflict
According to the XBR/USD chart:
→ Prior to Israel’s airstrikes on Iran on 13 June, the price of Brent crude was hovering around the $69.00 mark;
→ Following US bombings in Iran, the price spiked at the Monday market open, reaching a high of approximately $77.77 (as we reported on 23 June).
However, after President Trump announced a ceasefire between Iran and Israel — later confirmed by statements from both sides — oil prices dropped sharply. This morning, Brent is trading around $68, which is even lower than the level seen before the initial strikes.
Media outlets report that analysts broadly agree that fears have eased, even if the ceasefire appears fragile. Market participants seem to view the likelihood of the conflict escalating into a full-scale ground war — involving US troops and the closure of the Strait of Hormuz — as low. Shipping through the strait is reportedly returning to normal.
Technical Analysis of the XBR/USD Chart
Interestingly, the $69 level — from which prices surged on 13 June — acted as resistance yesterday (as indicated by the arrow on the chart).
It can be assumed that the longer the ceasefire holds, the less relevant the fears that have served as bullish drivers. In that case, Brent crude prices may continue fluctuating within a downward channel, outlined in red, with the possibility of a short-term rise toward its upper boundary.
Nevertheless, the key drivers for oil prices will remain the fundamental backdrop and official statements regarding the situation in the Middle East and other geopolitical factors.
This article represents the opinion of the Companies operating under the FXOpen brand only. It is not to be construed as an offer, solicitation, or recommendation with respect to products and services provided by the Companies operating under the FXOpen brand, nor is it to be considered financial advice.
Crude Could Rally to $75 — Entry Opportunity Still Alive at $68Brent Crude Oil is setting up for a potential bullish continuation on the 4-hour timeframe. After a sharp pullback from its recent high near $76.28, price found support around the $65.93–$66 zone—an area that previously acted as strong resistance and now serves as a bullish flip level. The price is consolidating above this reclaimed support and forming a base within the Ichimoku cloud, indicating a possible accumulation phase before the next leg higher.
Ichimoku components support the bullish outlook: the cloud remains green, the Tenkan-sen is curling upward, and price is stabilizing above both the Kijun-sen and the flat Senkou Span A. These are typically early signs of a bullish continuation. The bullish thesis is further strengthened by broader geopolitical risks, particularly Iran’s increased influence over the Strait of Hormuz, which remains a critical oil transit route. Any disruption in this corridor could immediately pressure global supply and send oil prices higher.
This aligns with recent bullish projections (not exactly with the pricing but with the intent): Citi forecasts Brent could reach $75–78 if Iran related disruptions cut 1.1 mbpd, while Goldman and JPMorgan warn $100–120+ spikes if the Strait of Hormuz is threatened. The Guardian notes the shipping chokepoint transports ~20% of global oil, and even brief disruptions could add $8–30 / barrel in volatility.
Trade Setup:
• Entry: $67–$68
• Stop-Loss: $65
• Take Profit: $75
This provides a risk-reward ratio of 1:4, with nearly 12% upside potential. Given the convergence of strong technical structure and real-world catalysts, this setup offers a compelling opportunity for bullish Brent traders aiming to catch the next breakout.
Geopolitics vs. Technical: Will Oil Correct -7%?Oil ( FX_IDC:USDBRO ) rose more than +20% after the start of tensions between Iran and Israel on Friday . I hope this tension ends as soon as possible because tensions have no winners.
The behavior and price movements of oil will certainly depend on the increase or decrease of tensions in the Middle East , but for the coming hours we can have a technical view .
Oil is currently moving in the Resistance zone($78.70-$74.70) and near the Resistance lines and the Yearly Pivot Point .
In terms of Elliott Wave theory , it seems that Oil has completed the second five-impulse waves . So that wave 5 is Truncated .
I expect Oil to decline in the coming hours, this decline could be -7% .
Note: If the USA is added to the Middle East tensions, Oil prices could rise again, so pay more attention to capital management.
Note: Stop Loss: $79.00
Please respect each other's ideas and express them politely if you agree or disagree.
U.S. Dollar/ BRENT CRUDE OIL (USDBRO), 4-hour time frame.
Be sure to follow the updated ideas.
Do not forget to put a Stop loss for your positions (For every position you want to open).
Please follow your strategy and updates; this is just my Idea, and I will gladly see your ideas in this post.
Please do not forget the ✅' like '✅ button 🙏😊 & Share it with your friends; thanks, and Trade safe.

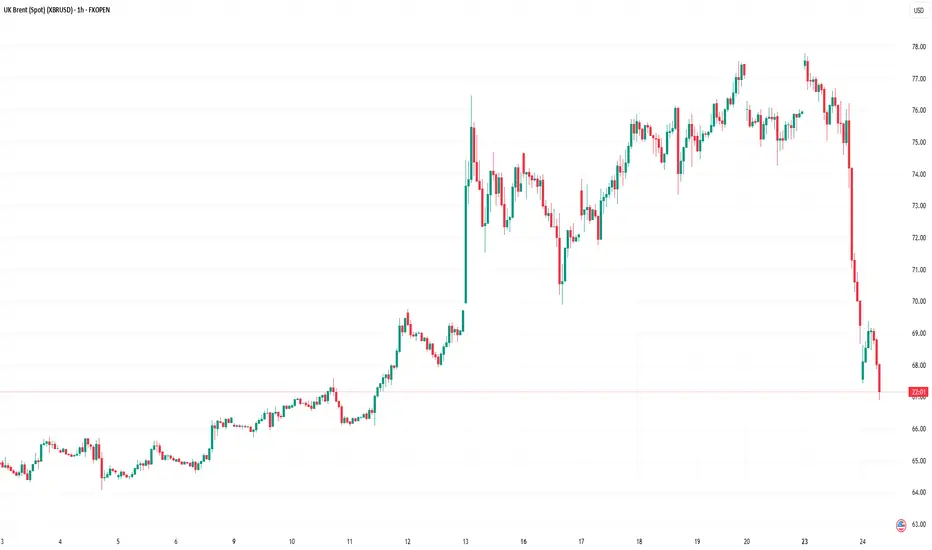
XBRUSD broke the Support Level 69.90 👀 Possible scenario:
Oil prices dropped more than 3% on June 24 after U.S. President Donald Trump brokered a ceasefire between Israel and Iran, easing fears of a wider conflict disrupting Middle East oil flows.
Analysts said the risk premium built into oil prices has quickly faded, with focus shifting away from threats to the Strait of Hormuz. Macquarie expects U.S. crude stocks to fall by just 0.9M barrels last week—down sharply from the prior 11.5M-barrel draw. Exports likely dropped by 0.6M b/d, while imports rose by 0.7M b/d. Gasoline, distillate, and jet fuel inventories are all expected to have increased.
✅Support and Resistance Levels
Now, the support level is located at 66.10.
Resistance levels are now located at 77.50 .
3 Line Strike Pattern: What It Means and How to Use It3 Line Strike Pattern: What It Means and How to Use It in Trading
Candlestick patterns are crucial tools for traders, offering valuable insights into market sentiment and potential price movements. Among these patterns, the Three Line Strike setup is particularly sought after by traders in forex, stock, commodity, and index markets. This article explores the intricacies of the Three Line Strike, explaining how to identify it on charts, highlighting its unique characteristics, and discussing how to incorporate it into trading strategies.
Three Line Strike Pattern: An Overview
The Three Line Strike is a candlestick pattern used in technical analysis to trade trend continuations. However, it often appears ahead of trend reversals. The pattern consists of four candlesticks and can be found in up- and downtrends.
Bearish Three Line Strike
The bearish 3 Line Strike candlestick pattern suggests a continuation of a downtrend. It starts with three consecutive bearish candles, each opening and closing lower than the previous one. This is followed by a large bullish candle, which opens lower and closes above the open price of the first bearish candle. This pattern reflects the strength of the downtrend. Still, it may appear at the bottom of the downtrend and signal a trend reversal.
Bullish Three Line Strike
The bullish 3 Line Strike candlestick pattern suggests the potential continuation of a solid uptrend. It starts with three consecutive bullish candles, each opening and closing higher than the last. This is followed by a large bearish candle, which opens higher and closes below the close of the first bullish candle. This pattern indicates that the solid uptrend may continue, but it may signal the market will turn down if it’s formed at the peak of the uptrend.
Analysing Three Line Strike Patterns
As the Three Line Strike pattern can provide both reversal and continuation signals, it’s vital to combine it with other analytical tools, including trend indicators like moving averages and oscillators like the Relative Strength Index. Also, traders consider the overall trend on higher timeframes.
- Entry: To enter a trade using the Three Line Strike, traders identify the overall trend. They may wait for the pattern to be formed and the following candle to close. If the following candle is bearish, traders usually open a sell position. If it is bullish, they consider an opportunity to go long. However, traders also may enter the market at the closure of the pattern’s fourth candle.
- Stop Loss: Risk management is crucial, and traders typically set their stop-loss levels above/below the fourth candle, considering the trend strength. Alternatively, they may place the stop-loss order below or above the nearest swing point or support/resistance level, considering market volatility and risk tolerance.
- Take Profit: Traders aim to secure their potential profits by setting profit targets based on the risk/reward ratio. This could be at the next significant support or resistance level or based on technical indicators, including Fibonacci retracements.
A trader finds a bullish 3 Line Strike setup on the daily chart of Qualcomm stock. However, this time, it serves as a reversal signal. They enter the short position at the close of the candle, following the pattern. Their stop loss is above the setup, with the take profit at the next support level.
A bearish Three Line Strike setup is formed on the hourly chart of Brent Crude Oil. A trader takes a long position at the close of the fourth candlestick. Their stop loss is below the formation, with the take profit placed at the next resistance level.
Psychology Behind the Three Line Strike Pattern
The effectiveness of the Three Line Strike pattern relies on understanding the underlying psychological factors influencing market participants. Greed, fear, hope, and anxiety drive buying and selling decisions.
- Initial Sentiment: The first few candlesticks in a Three Line Strike candlestick pattern represent the prevailing sentiment in the market. Typically, this sentiment is characterised by either greed (in an upward trend) or fear (in a downward trend), depending on the market direction prior to forming the pattern.
- Potential Reversal: Although this pattern is considered continuation, in most cases, it provides a reversal signal. A strong fourth candle that engulfs three smaller candlesticks reflects the change in the market sentiment. The reversal signal triggers market participants to reassess existing positions and strategies.
- Reaction: Those who were previously aligned with the old trend may feel fear or anxiety, leading them to unwind their positions to avoid potential losses. Meanwhile, contrarian traders, driven by a sense of opportunity and confidence, may enter new positions in anticipation of the emerging trend reversal, fueled by their belief that market sentiment is shifting.
Application in Trading Strategies
Applying the 3 Line strike pattern in trading strategies encompasses various elements beyond just its recognition. Let's delve into how traders implement additional steps to enhance their overall trading performance.
- Seeking Additional Confirmation: Traders often seek additional confirmation from other technical indicators such as the Relative Strength Index (RSI), Moving Average Convergence Divergence (MACD), or Bollinger Bands. These indicators offer complementary insights into market dynamics, validating the signals generated by the Three Line Strike pattern.
- Strategic Placement and Timeframe Alignment: Traders may align the pattern with key support or resistance levels on higher timeframes to validate its significance and potential reversal points. Through multi-timeframe trading, traders may gain a more comprehensive understanding of market trends to analyse future price movements.
- Entry and Risk Management: Traders should place their entry and exit points carefully. As the pattern may provide continuation and reversal signals, incorporating disciplined risk management techniques might help traders protect their capital and minimise their potential losses.
Caveats to the Pattern
High volatility periods can amplify the occurrence of false signals and erratic price movements, potentially leading to misguided trades. Conversely, during periods of low volatility, price action may be sluggish, and confirmations could be delayed. Therefore, it's important for traders to adapt their strategies accordingly.
Another important consideration is the possibility of false breakouts. Despite the apparent formation of a Three Line Strike pattern, there's a risk of the price briefly breaching the pattern's boundaries before reverting to its original direction. These false breakouts can deceive traders into entering premature trades, resulting in losses. To mitigate this risk, traders can exercise patience and vigilance, waiting for strong confirmation signals before committing to a trade.
Key Differences Between Three Line Strike and The Three Black Crows/Three White Soldiers
The key differences between the Three Line Strike pattern and the Three Black Crows/Three White Soldiers patterns lie in their trading formations and implications:
Aspect - Three Line Strike Pattern
Formation - Consists of four consecutive candlesticks, with the fourth candlestick completely engulfing the previous three.
Implication - Indicates either a trend continuation or a reversal in market sentiment, either from bullish to bearish or vice versa.
Aspect - Three Black Crows/Three White Soldiers
Formation - Consists of three consecutive candlesticks with progressively lower (crows) or higher (soldiers) closing prices.
Implication - Reflects a strong momentum in the direction of the prevailing trend, suggesting a continuation of the trend rather than a reversal.
The Bottom Line
The Three Line Strike is a complicated pattern as it may provide continuation and reversal signals. Despite its complexity, it often appears on a price chart, making it a valuable tool for traders. Mastering price action chart analysis is a gradual process. However, with skill, traders can potentially improve their trading efficiency.
FAQs
What Is the 3 Strike Rule in Trading?
The 3 strike rule in trading refers to the Three Line Strike pattern. The pattern consists of three consecutive up/down candles followed by a fourth long bearish/bullish candle that opens above/below the previous candle’s close but closes below/above the first candle's open. It’s believed to provide continuation signals, but it often appears before a trend reversal.
What Is the Three Strike Strategy?
The Three Strike Strategy refers to the 3 Line Strike candlestick pattern. It’s based on the assumption that the pattern will be followed by either a reversal or a continuation of the trend. Traders often wait for the candlestick to close above/below the pattern for an entry point, place a profit target, considering the closest resistance/support levels, and potentially limit losses by placing a stop-loss order below/above the pattern.
This article represents the opinion of the Companies operating under the FXOpen brand only. It is not to be construed as an offer, solicitation, or recommendation with respect to products and services provided by the Companies operating under the FXOpen brand, nor is it to be considered financial advice.
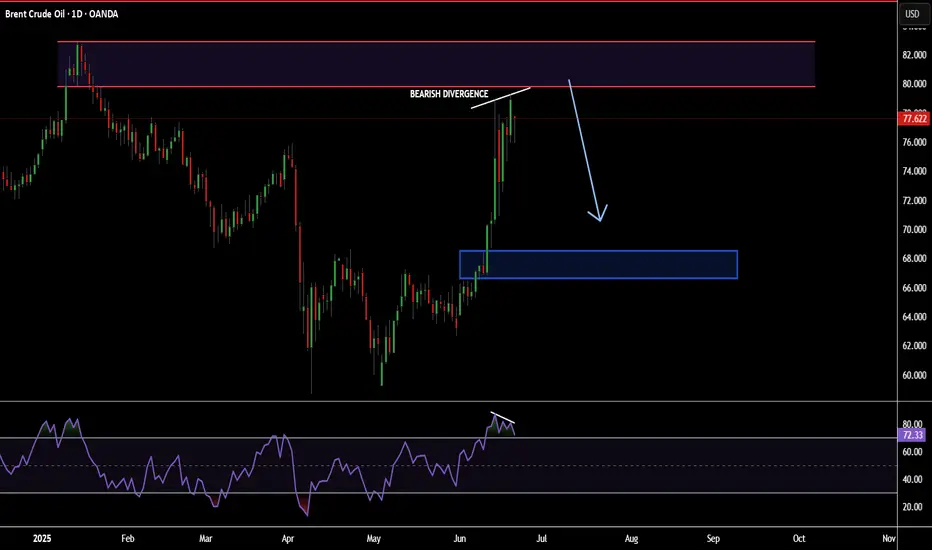
POTENTIAL SHORT OPPORTUNITY ON BRENT CRUDE OIL...SWING TRADEHey hey TradingView community!!! Hope you guys are doing amazing and having an amazing weekend! Just wanted to come make a post on a counter-trend trade I potentially see here on Brent Crude Oil. So put your seat belts on and let's dive in!!
OK so first thing first. Oil has recently seen a huge run in price from 63-80 a barrel so obviously a dramatic increase in price & USUALLY when we see these very strong decisive moves in an asset there is usually a corrective period in prices because that is how supply & demand and how markets works :) OK so let's now go to the technical reasoning!
1. Weekly price overextended/ RSI overbought
2. Daily momentum of buyers slowing down/ Bearish Divergence forming
3. Sitting around a weekly fib level
4. Hourly's lining up with this bias also mainly momentum
Very simple setup and potential here! May have to wait for that buyer to die out/ slow down a little more but keep eyes out for this move. Obviously trading against the trend is a little more "risky" but stay patient and let's see how it plays out!
Cheers!