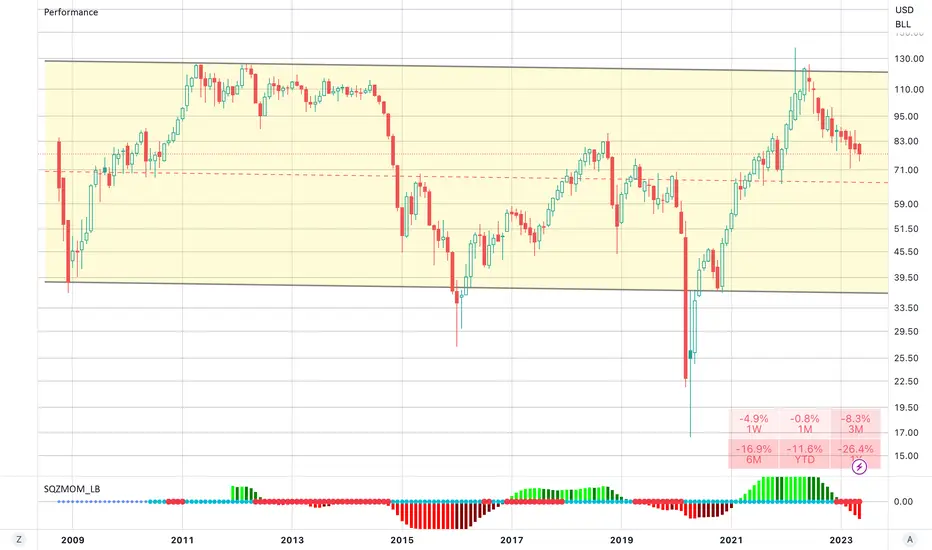
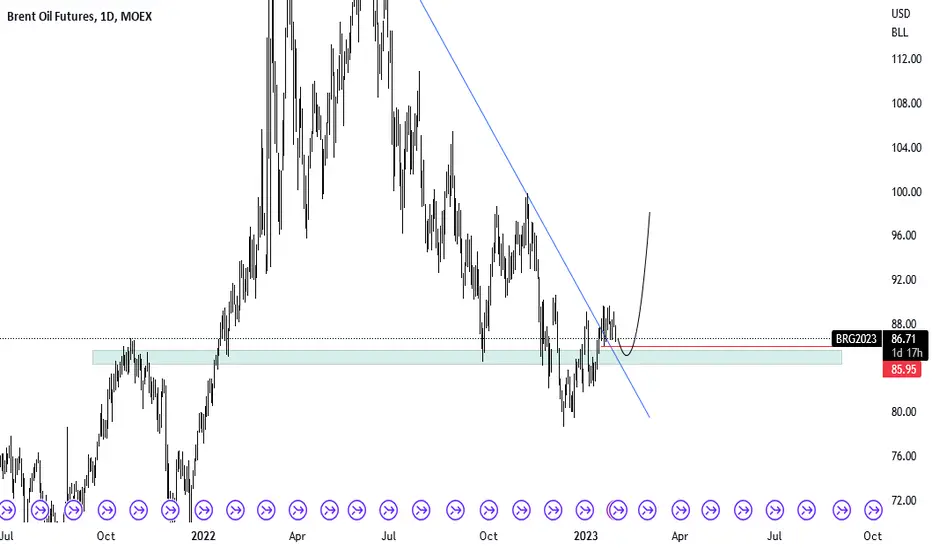
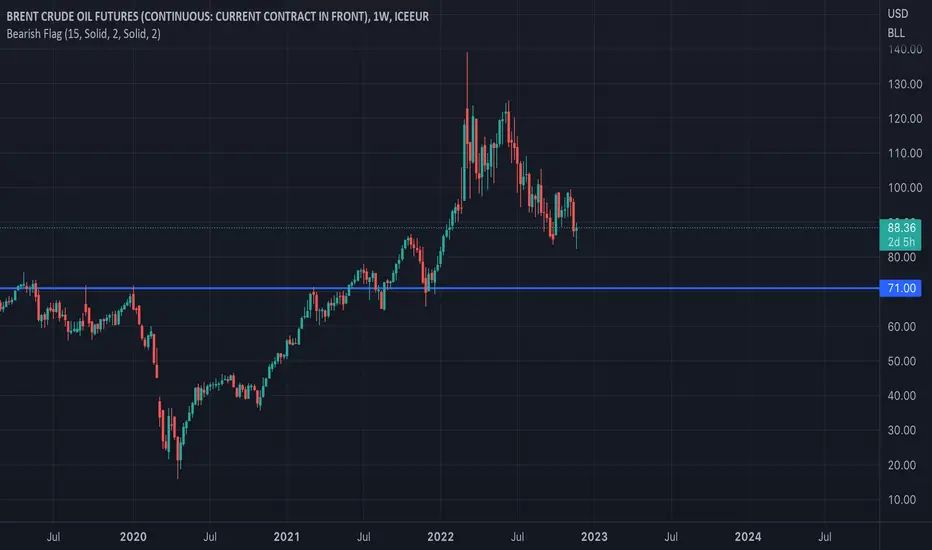
Brent FuturesThe Chart looks quite simple for a complex geo polical commodity.
OPEC Cuts, Russian War, Recession and still the Price skeeps coming down.
One year down 26.4%
BRENT3! trade ideas
OPEC’s supply cuts pre-empt economic weaknessThe Organisation of Petroleum Exporting Countries and its partners (OPEC+) producers surprised the market with a decision on Sunday 2 April 2023 to lower production limits by more than 1mn barrels per day (bpd) from May through the end of 2023. This decision was announced ahead of the OPEC+ Joint Ministerial Monitoring Committee (JMMC) meeting scheduled on 3 April and was contrary to market expectations that the committee would keep policy unchanged. Over the prior week, OPEC+ ministers were giving public assurances that they would stick to their production targets for the entire year. This cut tells us that OPEC+ is pre-empting weaker demand into the year and was looking to shore up the market.
OPEC+ announcement may have caught speculators by surprise
It is evident Sunday’s decision caught the market by surprise evident from the commitment of trader’s report which showed net speculative positioning in Brent crude oil futures at -44k contracts were 146% below the 5-year average. Sentiment on the crude oil market had been weak prior to the decision.
Demand outlook remains soft amidst weaker economic backdrop
OPEC has been markedly dovish on oil demand for some time relative to other forecasters such as the Energy Information Administration (EIA). This cut helps solve the disparity that existed between OPEC and the EIA. OPEC expects oil demand to grow by around 2mn bpd in 2023. A significant portion of this growth (nearly 710,000bpd) is reliant on Chinese oil demand . Given that such a large amount of demand hinges on a single economy poses a risk to the demand outlook as the pace of China’s recovery post re-opening has not been as robust as previously anticipated. At the same time, tightening credit conditions owing to the recent banking crisis is also likely to weigh on growth forecasts in the rest of the developed world. Global Purchasing Managers Indices (PMI) indicators suggest manufacturing activity has contracted since September 2022.
Supply outlook will be driven by new OPEC+ cuts
Since Russia has been producing less than its notional limit, the reduction on actual production will be less than 1mn bpd. But with Saudi Arabia committing to voluntary reduction of 500,000bpd we would expect the overall decline in OPEC supply to be around 900,000bpd by the beginning of May 2023. Assuming OPEC production holding at the recent 28.9mn bpd for April, our balances would point to an equilibrium in Q2 and a return to a deficit in Q3 and Q4. This deficit is largely a function of OPEC+ cuts as opposed to stronger demand globally. The front end of the Brent crude oil futures curve remains in backwardation with a roll yield of +0.4%
OPEC+ producers can also cut without the fear that they will lose significant market share to non-OPEC members. Previously, OPEC+ would be reluctant to let prices rise too high, as it would incentivise a supply response from US producers. However, US producers today appear more focussed on capital discipline and maximizing shareholder returns. The US also has limited capacity to plug the shortfall created by OPEC+ cuts owing to last year’s unprecedented release from strategic US oil reserves (now at a 40-year low).
Conclusion
In the short term, OPEC production cuts are almost always supportive evident from the recent price reaction Brent crude oil prices have risen (+6.54% ). However, over the medium term, the price response to cuts have been more mixed as they do tend to signal underlying weakness in the supply/demand balance. Either OPEC countries are expecting demand to be significantly weaker or doubt oil production in Russia will decline as sharply as forecasted.
So, with speculative positioning at currently low levels alongside further inventory draws expected later in the year, the risks are titled towards the upside for crude oil prices. However, given the uncertainty in the macro environment, we expect the upside in prices to be capped at about US$90 per barrel.
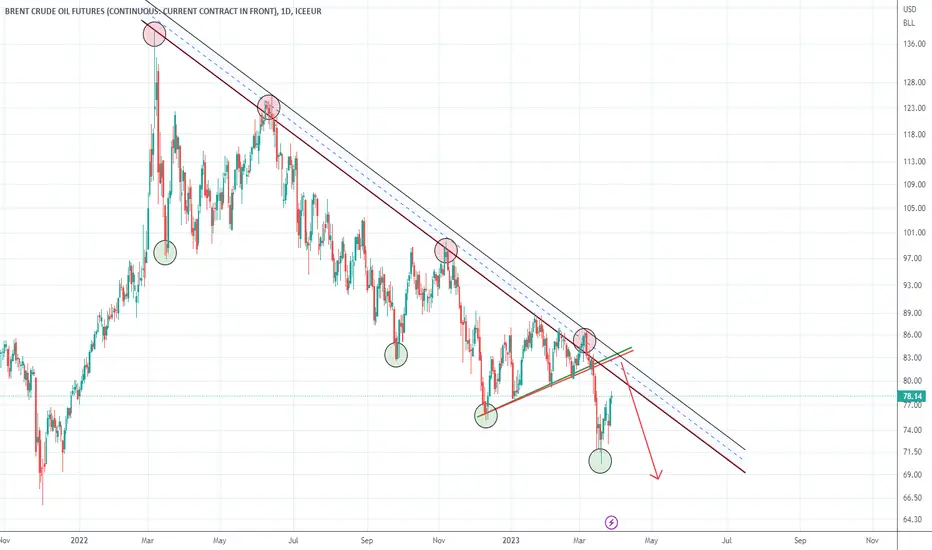
OIL SHORTWe see that oil is in a general downward trend
This trend has been respected several times and has made lower bottoms
Economic news supports the decline in oil as well
Oil prices analysisOil is in complicated situation. During second week of the March it broke the 200 EMA support without resistance. Next weekly pivot is on 64.00. Traders might be looking for short on fundamentals to the 40.00 level. But given my expertise about Oil fundamentals this trade would not work. So i'll say any position taking in oil should wait for 64.00 level and look closer on a lower timeframes.


Brent showing two strong bearish patterns to target $67.71M formation has formed over the Rising Flag.
This confirms not one but 2 bearish patterns in the making.
There is a strong chance of the price coming down. and we have other indicators confirming.
7= 21 - crossing
Price <200
RSI<50
Target $67,71

Brent showing a further plummet to $67.89 Rising Flag has formed after the downtrend with Brent.
The price has broken below the rising flag which confirms bearishness.
200 > 21 > 7 - Bearish
RSI <50
Target $67.89
FUNDAMENTALS:
We've seen the US Dollar start to strengthen a bit which is can continue to do so for the next few weeks.
A strengthening US dollar can cause Brent crude price to drop because oil is priced in dollars. When the value of the dollar increases relative to other currencies, it makes oil more expensive for buyers using those currencies, which can result in decreased demand and lower prices. Additionally, a strong dollar can also make it more attractive for investors to sell commodities, including oil, in exchange for the higher-valued currency, putting downward pressure on prices.

Inflatable Mattress With A HoleBRN1 is a power move for the bull state of mind. Now that's been said the bear was looking very healthy an Fed. This was only asserted by the growth in Q3-Q4.
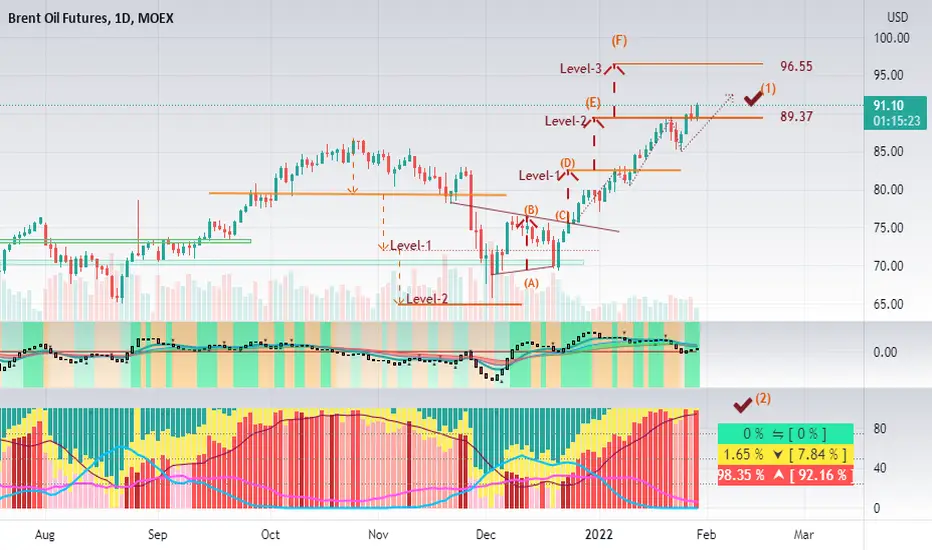
BR1! - Possible to reach TP96 Bull Up condition :
1) BRENT candlestick has BO Level-2 of Raising Stage (E), next target going to be 96.55 (Level-3)
2) Tricol+ indicator - Banker's sentiment (red) above 75%, still in bullish trend
Support & Resistance:
S : 89.37 (-1.81%)
R : 96.55 (+6.08%)
Remark:
- length of AB=CD=DE=EF
DISCLAIMER:
Analysis above SOLELY for case study purpose, not a PROFESSIONAL ADVISE. This analysis does not provide any trading advise and buy or sell. Trade at your own risk. Trade only after you have acknowledged and accepted the risks involved.
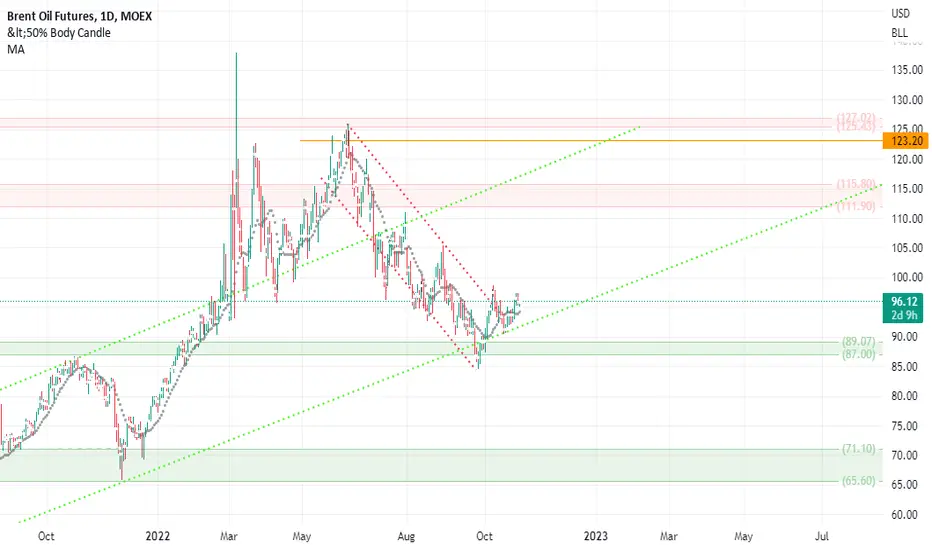
BRENT CRUDE TO SEE97/100Chart posted shows a clean 5 wave down .look for oil to rally back up over the next 3.5 to 6.2 weeks cycle high due jan 20
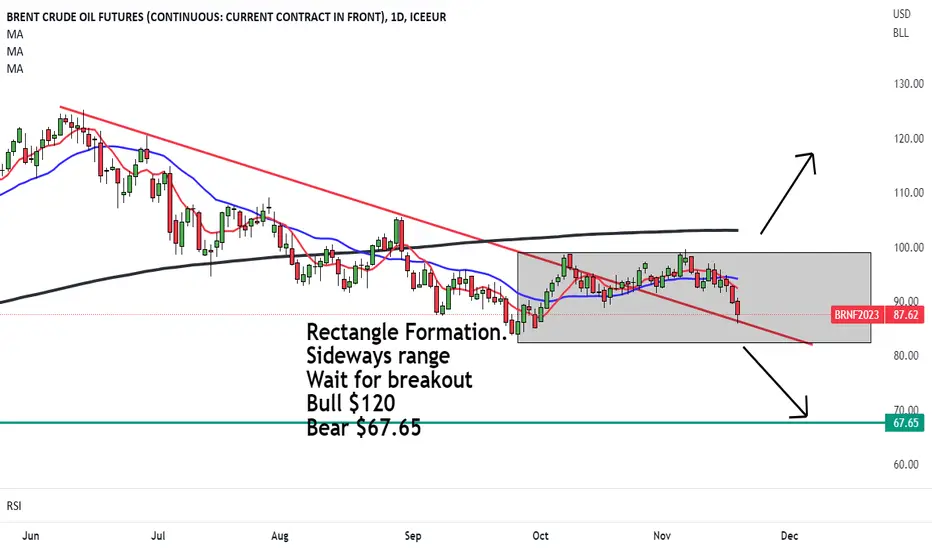
Brent is in nomans landRectangle Formation has formed on Daily and it's anyone guess where it's going.
On the bearish side, 3 Black Crows candles have formed as the price touches the medium beartrend line.
We need to wait for a breakout before we do anything...
Bull $120
Bear $67.65
Br1 | Brent Oil, LongBrent Oil looking long as well. How ever, it's not strong.
If you take it, it will go slowly up, but it will be quite week.
I prefer to wait for a short one at the last top.
POtential Ascending Triangle on Brent Crude to $122Potential Ascending Triangle on Brent Crude forming. We are just waiting for the price to break up and out of the resistance and then the first target will be around $122...
Moving Averages look good 7>21 <200

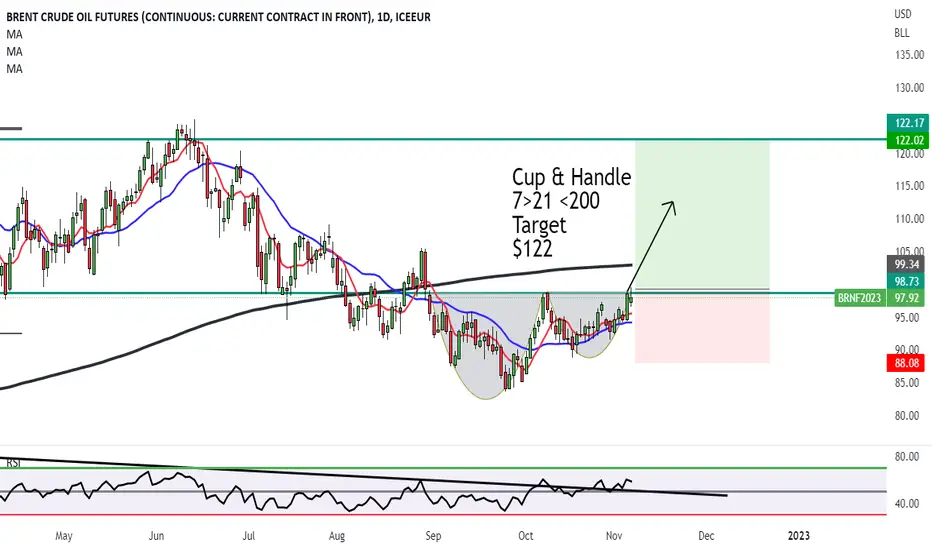
Brent Crude heading back up to $122Cup & Handle has formed on Daily and now we are just waiting for the breakout of the brim level.
7>21 <200 almost perfect. We just need the price to cross above 200MA
First target $122
Brent Oil...ShortExpect to go up a little bit more to form double top
Bear Delta divergence...
Price goes up while momentum is going down...indicator for a reversal
Gap to be filled down bellow and lows to be taken

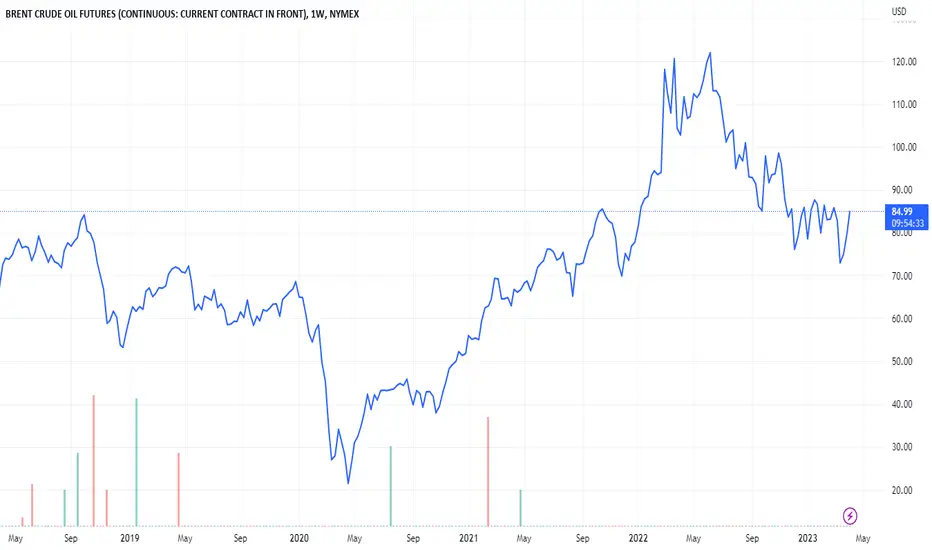
#brent #oilthe last 2 time that oil was crashed
i showed you on the chart
so i ask , what about this year??
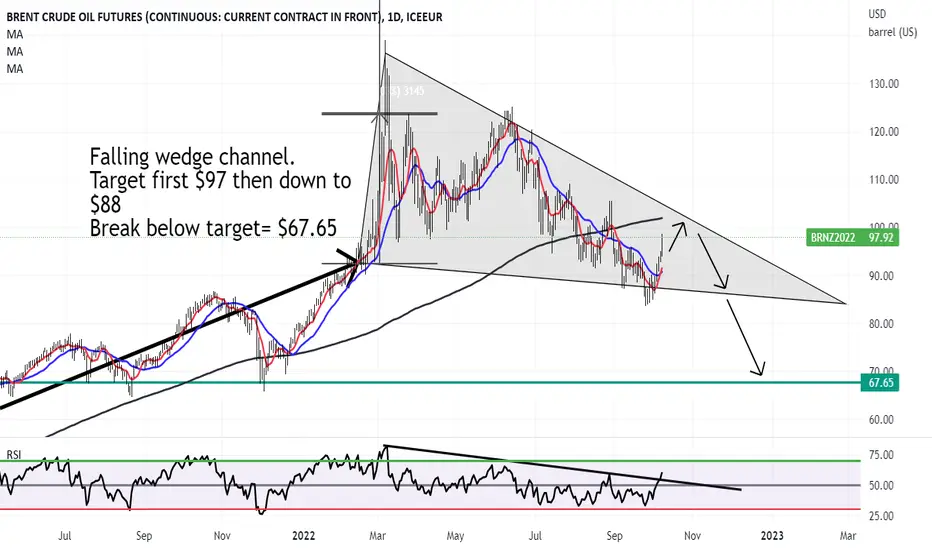
Brent tanking soonBrent is in a predominant falling wedge channel.
As I have mentioned this week, channels are always stronger than breakout patterns.
So we need the price to break below or above a certain level, before the price stops meandering...
The first target is to the top of the channel at $97 then down to $88 (channel).
If the price breaks below the channel then we could see a target of $67.65
I am bearish with Brent STILL.
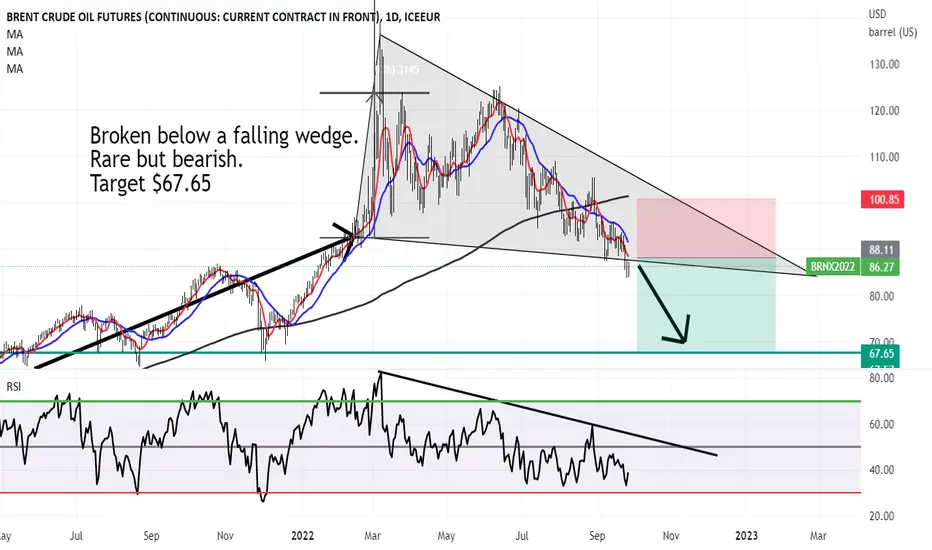
Brent Tanking Dont leave meBrent looks like it's on its way down!
Broken below a Falling Wedge (which is rare).
The RSI continues to make lower highs. and so the first target is around $67.65
Cosmic Vector on Brent Crude drop"EMA Vector" and "Smoothed Vector" both turning purple and crossing is a bearish sign (🧐) and now it's happening again (😎)

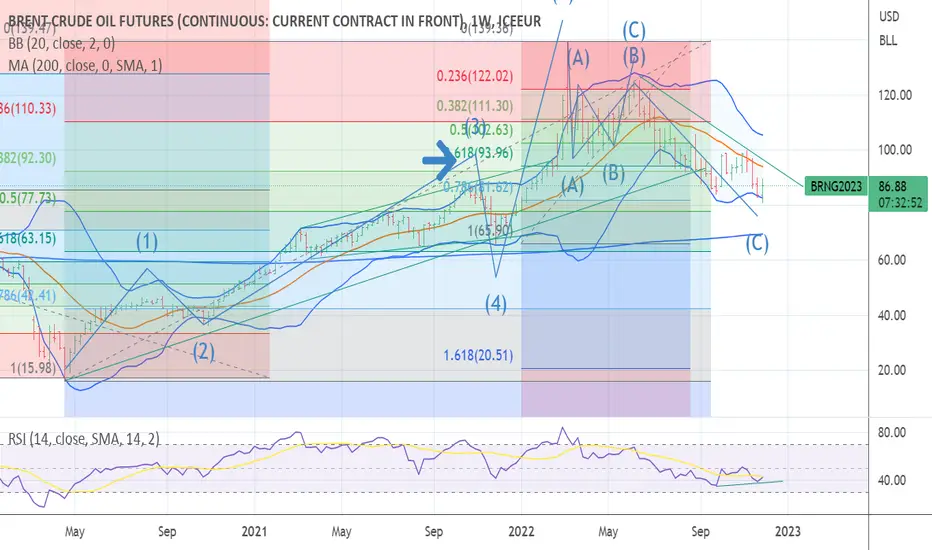
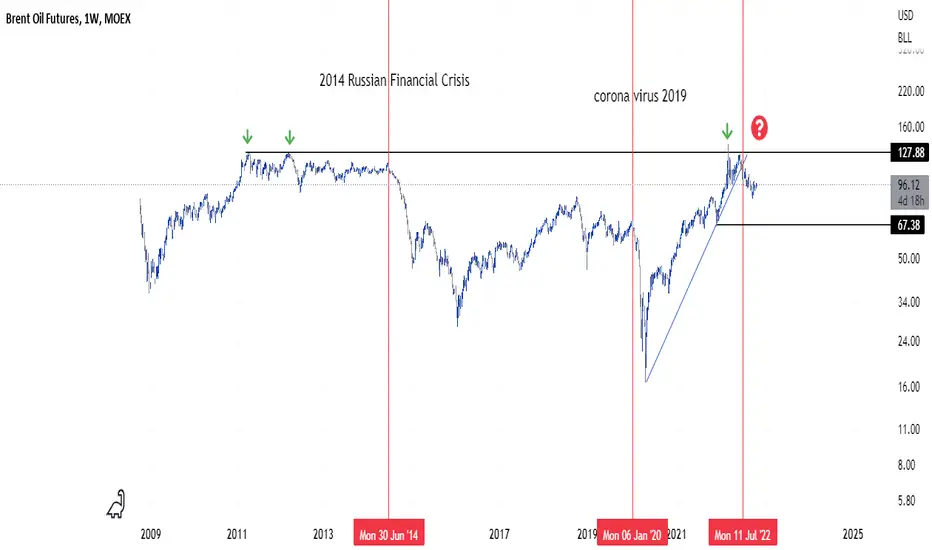
OIl on up On the weekly chart, there is ether a strong Falling Wedge in the making.
If the price breaks up and out of the Falling Wedge, we can expect the price to move up to $155.000
If Brent Crude forms an M formation (Double top), it's possible for Brent Crude to be bearish and on the way down. But we need the double top to form first.
What are your thoughts...

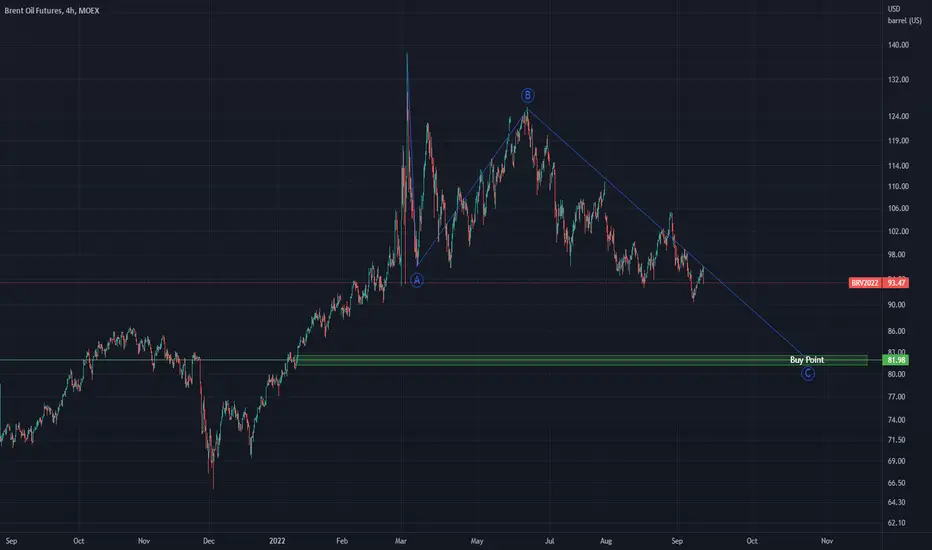
Short until entry point at 81.98$Short brent oil up to 81.98$.
As demand for oil declines globally due to coming to the recession, it is only a matter of time before the price hits $81.98.
You'r welcome ;)