ASHOKLEY 4HNSE:ASHOKLEY
Please note that we are not a SEBI Registered Investor Adviser/PMS/ Broking House.
All the contents over here are for educational purposes only and are not investment advice or recommendations
offered to any person(s) with respect to the purchase or sale of the stocks / futures and options.
You are also requested to apply your prudence and consult your advisers in case you choose to act on
any such content available as WE claims no responsibilities for any of your actions or any outcome of
such action
ASHOKLEY trade ideas
ASHOKLEY - mean reversionmean reversion accompanied by Middle Bollinger support.
There are good chances for the stock to make it till the red box.
Keep as sl as cross below middle BB (Daily TF)
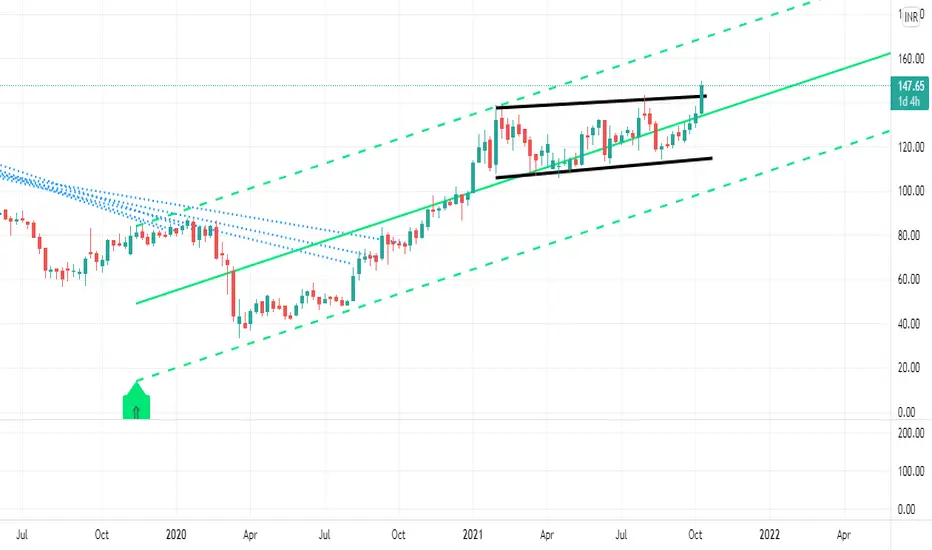
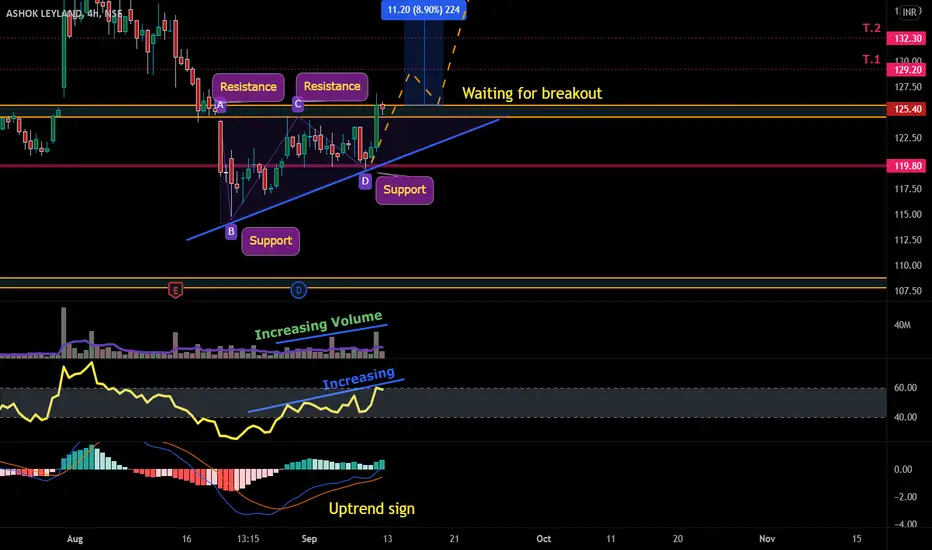
Ashok Leyland BreakoutThe stock has broken out and retested, so it may undergo a rally. Trade is supported by brokerage calls and Supports Nearby.
Risk Reward Ratio - 2:1
SL is placed below support zone & the previously upper trendline. The target is placed based on fundamentals and near swing high.
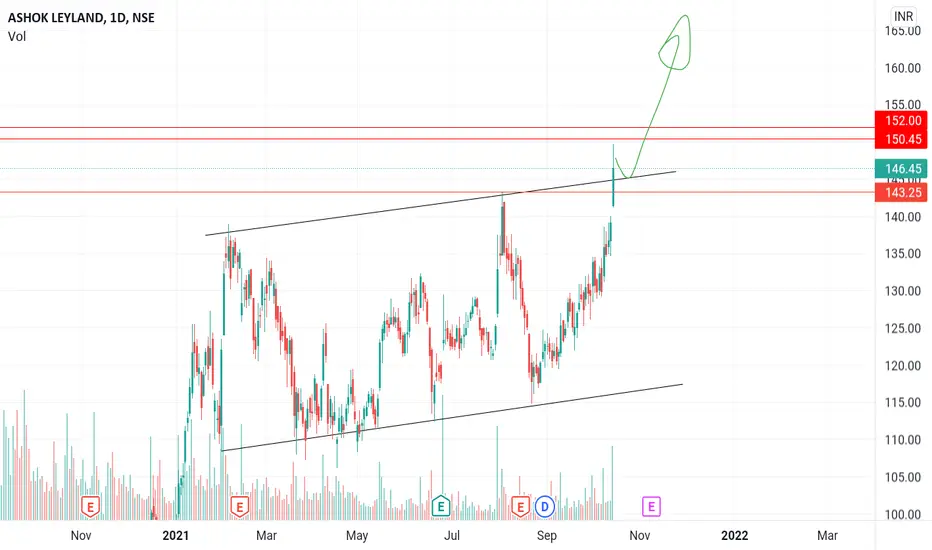
ASHOKLEY breakout AShokley has just given a breakout in today session and it can go very high from now
wait for retest as a confirmation or if not than buy at high of today candel minimum target is 150/152/155/160/+

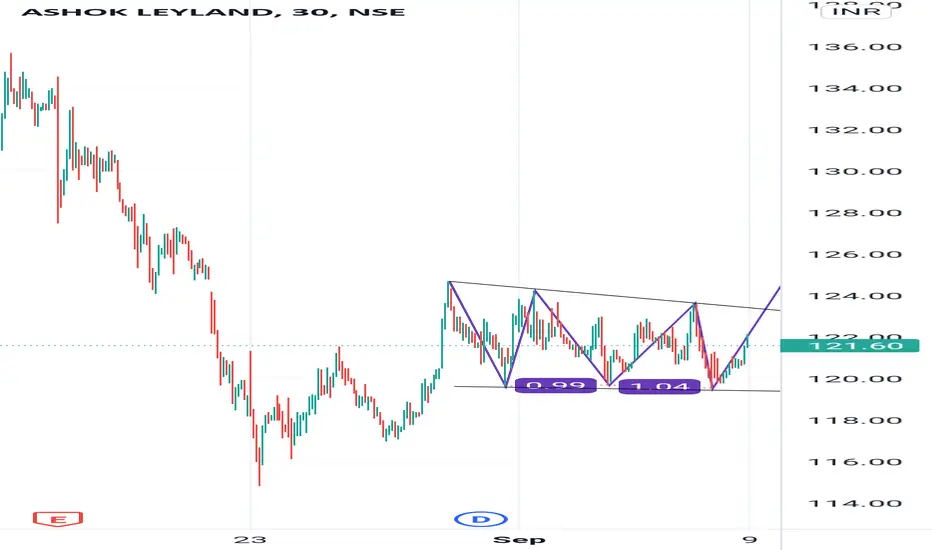
Pole and flag breakout it gives pole and flag pattern breakout or we can say channel pattern breakout
Volume also good
RSI is above 60 witch shows good strenth of buyers
Just wait for retracement and then buy
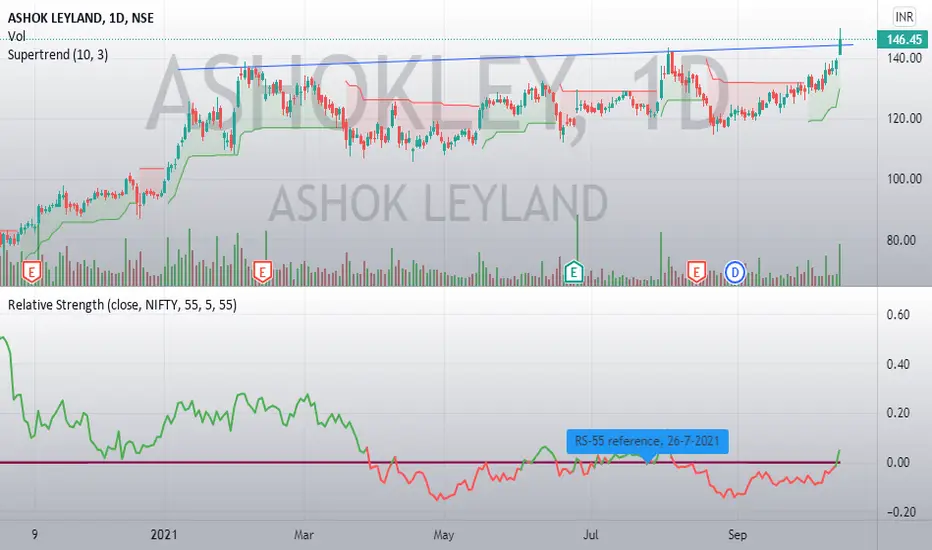
Ashok leyland BreakoutAshok Leyland Has given breakout with Positive ST and RS>0, can see further upside. Fibonacci Target comes to 200 apporx
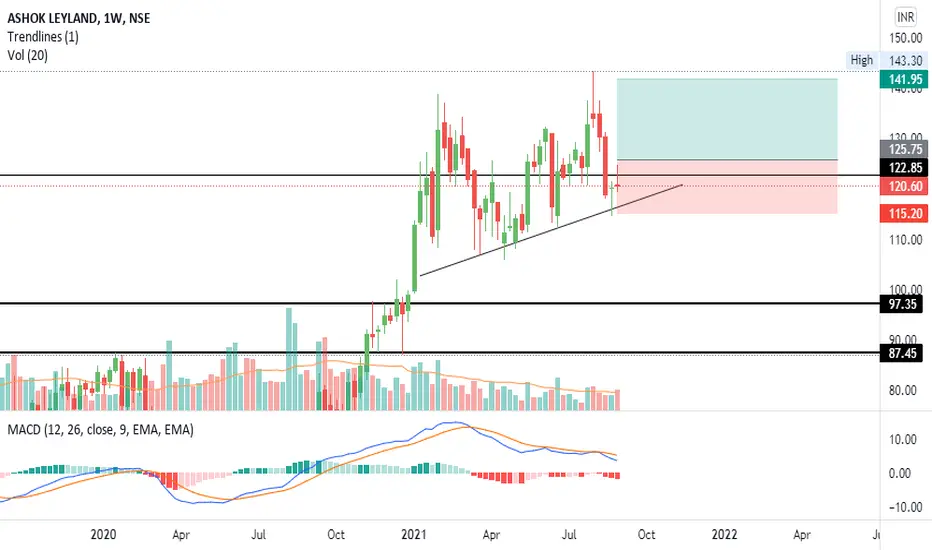
Ashokleyland bullishAshokleyland major supplier of EV Bus. looks bullish, weekly breakout. for education purpose only.
Ashok Leyland AnalysisAuto Sector very bullish now
Go for a bullish trade on Ashok Leyland
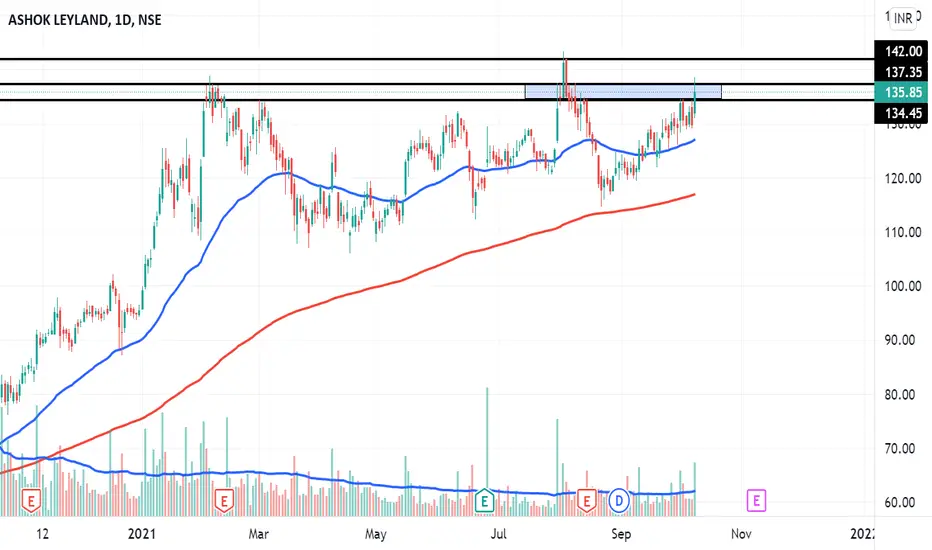
Resistance Zone: 134.5-137.5
Targets: 140,142
Ashok leyland bullishweekly chart cup and handle. three drives triangle formation. EV Buses story.
for education purpose only.
ASHOK leland at demand zoneASHOK leland at demand zone
Following HH
RSI taking multiple support at 40 level
rejected from reessitance once next time it may breakout that also 4,5 % move posible

Very clean chart of Ashok leyland.Price action is very clean and there's no, much noise. Chart is very clean. I like the chart patterns which are clean.
ASHOK LEYLAND - BUY @ 125 with Target -128-132This is only for learning purpose, this is not an investment recommendation. Do your own study before investing.
Channel breakout and retest possibleAshok Leyland has broken the channel it is good buy around marked demand area for the target given on the chart, with below demand zone as stop loss level.
Let's see..
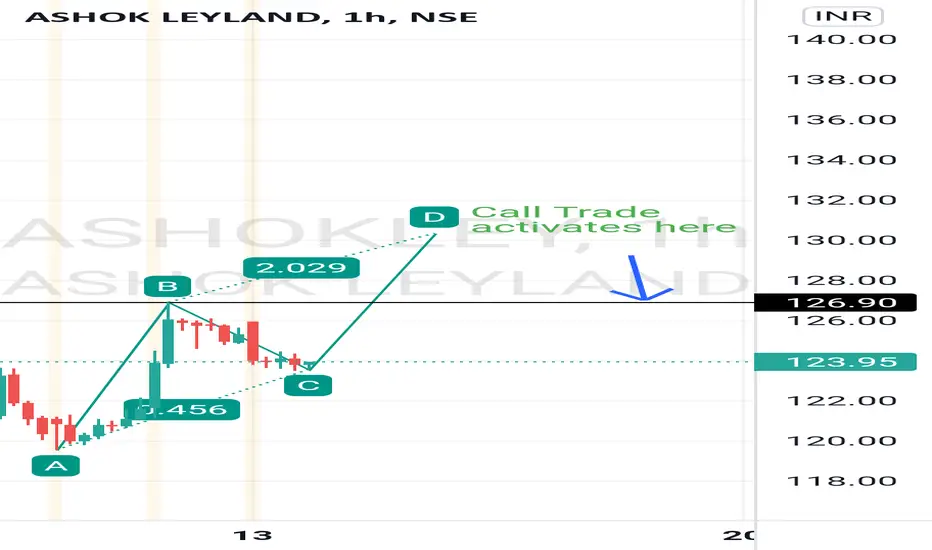
Ashok LeylandAshok Leyland possibly forming ABCD Pattern.
Buy only and only if it cross 127.
Can see 130 and 132 after that.
Bullish in short termShort term view on ashok ley, it's form flag structure
Looks like rally happened next coming trade days .
Any way buy above 125 for safe side and maintain sl 117 for short term view .
please do your analysis own
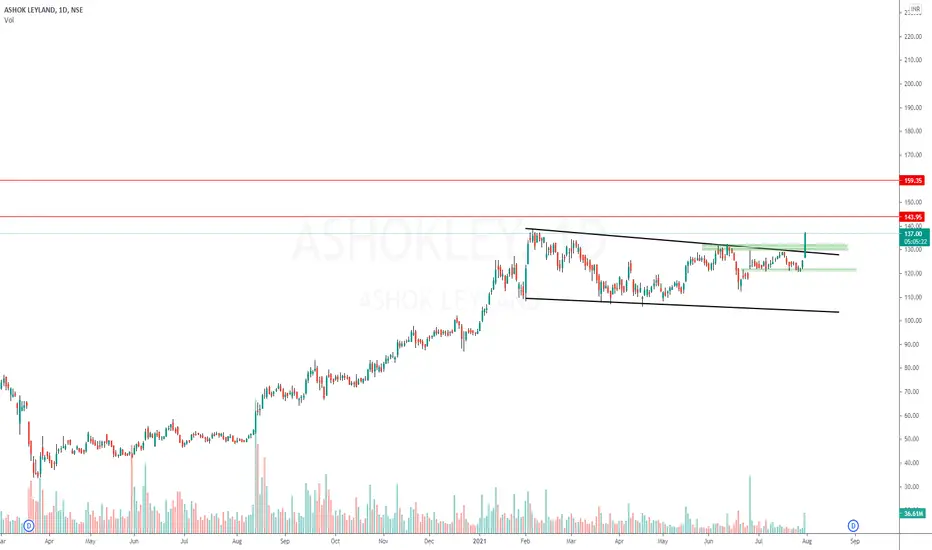
ASHOK LEYLAND WEDGE PATTERNHello
Welcome to this analysis about ASHOK LEYLAND , we are looking at daily timeframe perspectives. ASHOK LEYLAND is developing here that will be a decisive factor in the upcoming times. I discovered the main formation ASHOK LEYLAND is developing here that will be a decisive factor in the upcoming times. As when looking at my chart now we can watch there how ASHOK LEYLAND has emerged with this key WEDGE PATTERN marked in my chart with boundaries. which is an important resistance and also psychological resistance-mark together with the lower-boundary of the WEDGE PATTERN
In this manner, thank you for watching my update-analysis about ASHOK LEYLAND and its major WEDGE PATTERN with the determining factors we need to consider in upcoming times, support the analysis with a like and follow or comment for more market insight!

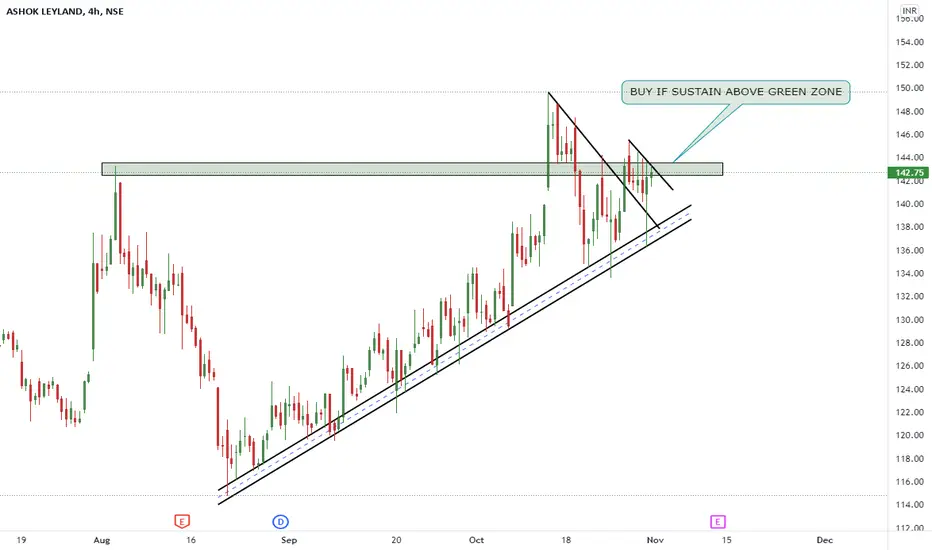
Ashok Leyland Short Term Break outThe stock has broken out with good volumes and retested the upper trendline. Trade is supported by brokerage calls and Supports Nearby.
Risk Reward Ratio - 1:1
SL is placed below the support zone, Upper and Lower Trendline. The target is placed near swing high.

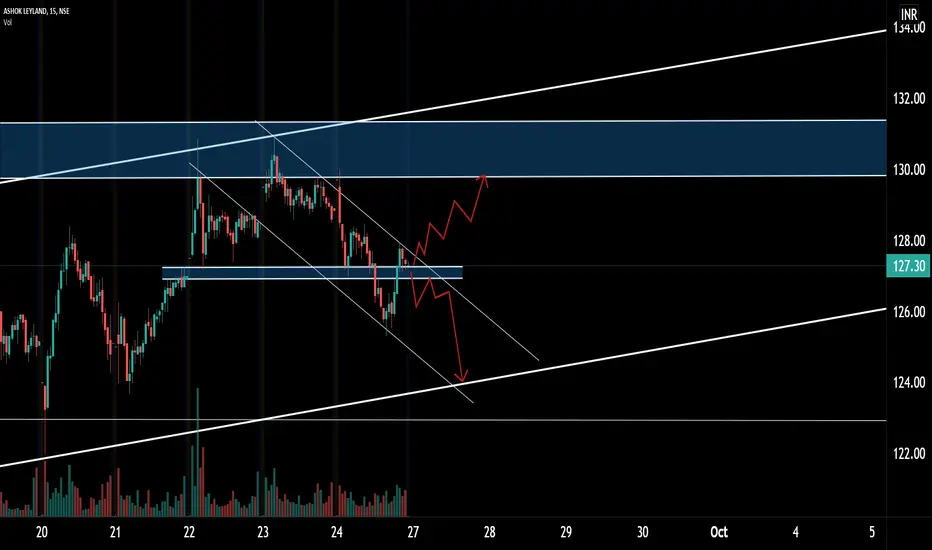
Ashok leyland Short NSE:ASHOKLEY I am expecting a bearish trend in Ashok Leyland after a trend line break down today possibly in the 3rd of C Wave. It seems Ashok Leyland is in an ABC correction pattern. The depth of correction can be at 128.9, 126.55, 125.1, 121.3 and 119.75

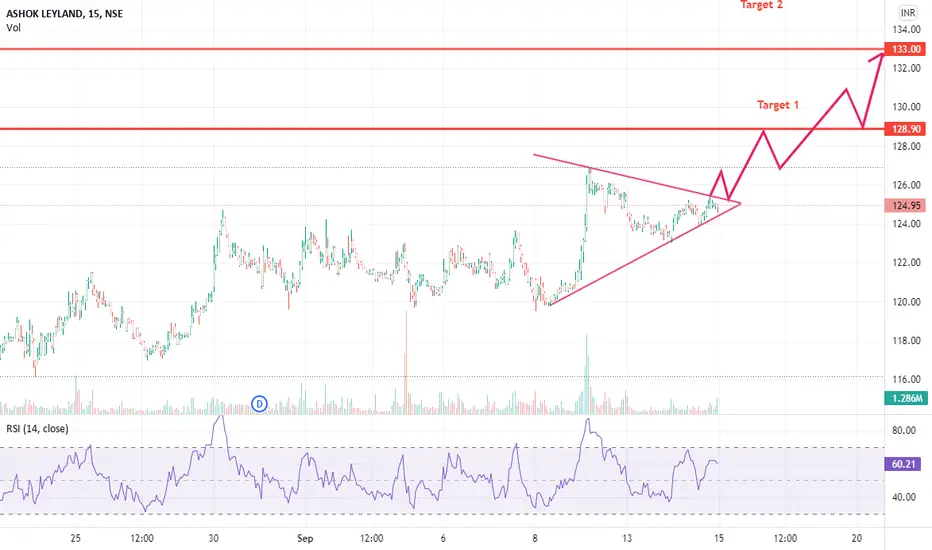
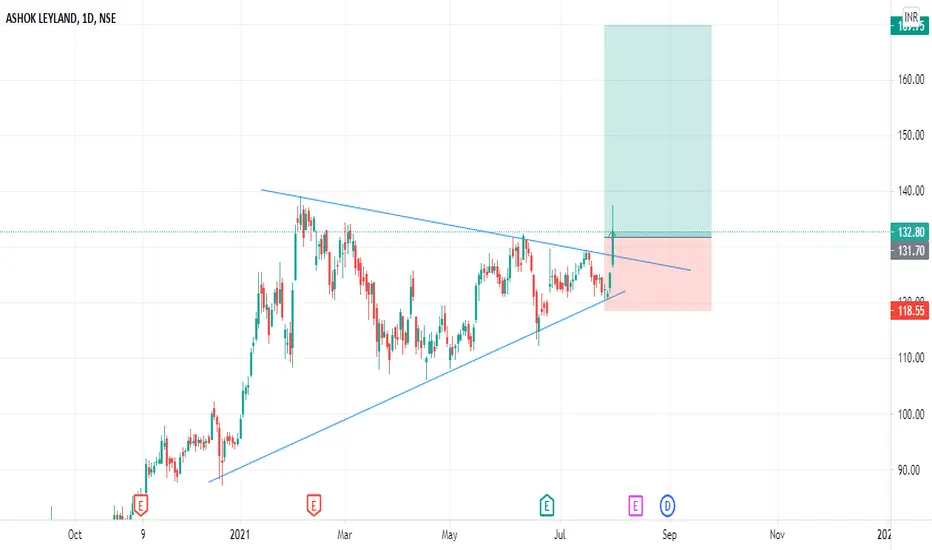
Triangular Breakout in Ashok LeylandA clear Triangular pattern Breakout in Ashok Leyland , 10-15% gain in 1 month seems achievable.

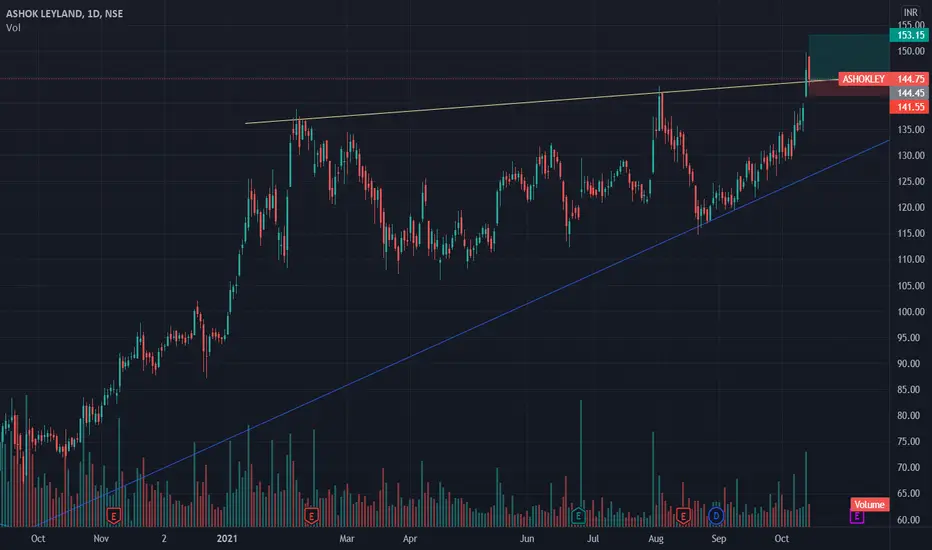
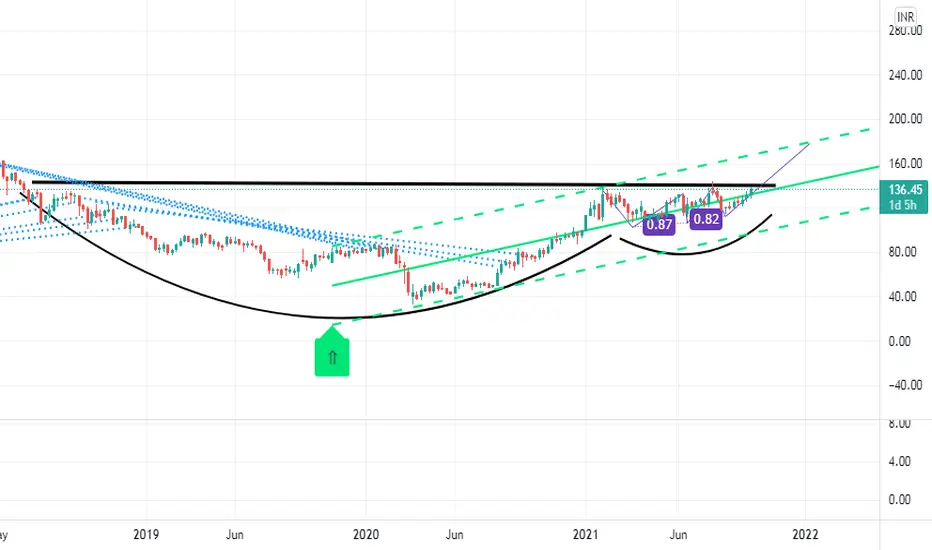
Breakout and formation of cup and handleThe stock has shown a breakout from its previous resistance level of around 136 with great volume. There is also a formation of the cup and handle formation on the weekly time frame chart. There is a buy call in the stock with a price target of 250 and a time target of 6 months. The stock has also seen a MACD crossover and breakout of RSI above 60 levels.