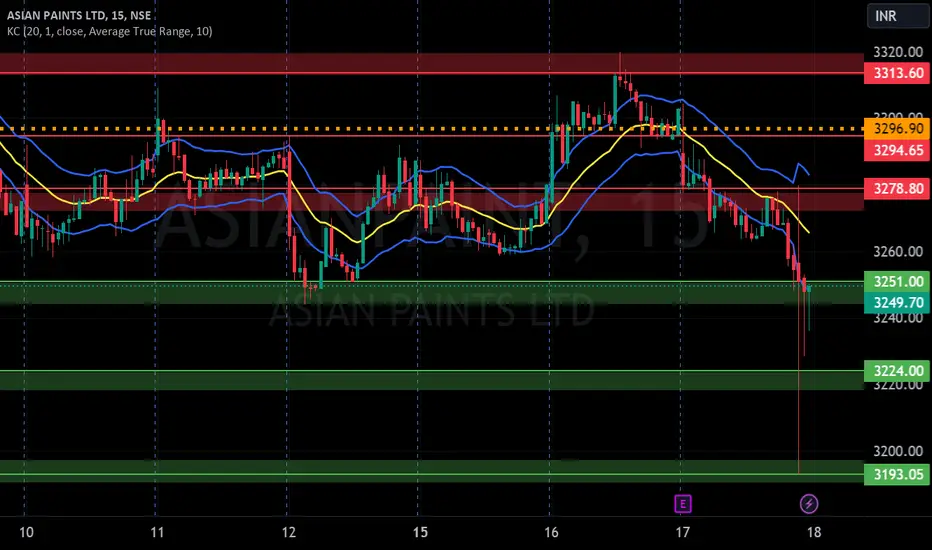
ASIAN PAINTS LTD S/R for 18/1/24Support and Resistance Levels:
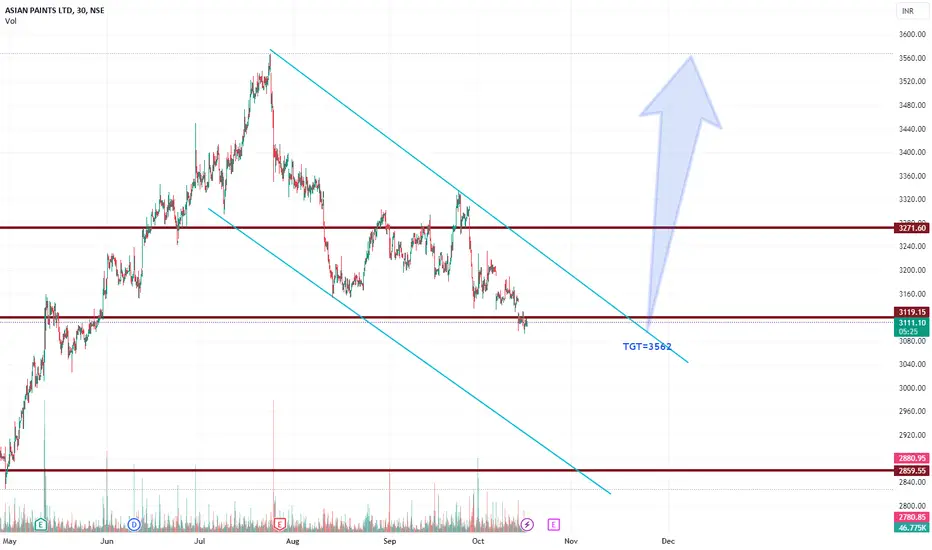
Based on the price action, you have to identify two significant levels: the red line acting as resistance and the green line acting as support. Additionally, there have marked red and green shades to represent resistance and support zones, respectively.
Support: The green line and green shade represent support levels. These levels are where the price tends to find buying interest, preventing it from falling further. Traders can consider these levels as potential buying opportunities.
Resistance: The red line and red shade represent resistance levels. These levels are where the price tends to encounter selling pressure, preventing it from rising further. Traders can consider these levels as potential selling opportunities.
Breakouts: If the price breaks above the resistance zone (red shade) convincingly, it may indicate a bullish breakout, and the price could move higher to the next resistance level. On the other hand, if the price breaks below the support zone (green shade) convincingly, it may indicate a bearish breakout, and the price could move lower to the next support level.
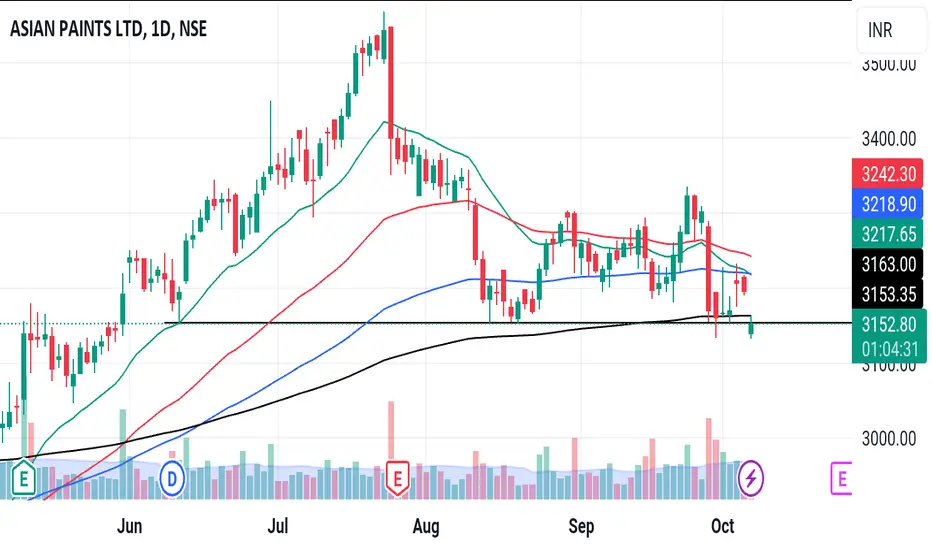
Keltner Channel:
The Keltner Channel is a technical indicator that uses an exponential moving average (EMA) to create an upper and lower channel around the price action. Traders can use this channel to identify potential long and short positions.
Long Position: If the price is above the upper line of the Keltner Channel, it may indicate a potential long opportunity, as it suggests the price is trading above the average range and might continue in an upward trend.
Short Position: If the price is below the lower line of the Keltner Channel, it may indicate a potential short opportunity, as it suggests the price is trading below the average range and might continue in a downward trend.
Disclosure: I am not SEBI registered. I just wanted to let you know that the information provided here is for learning purposes only. Please consult your financial advisor before making any decisions. Tweets neither advice nor endorsement.
ASIANPAINT trade ideas

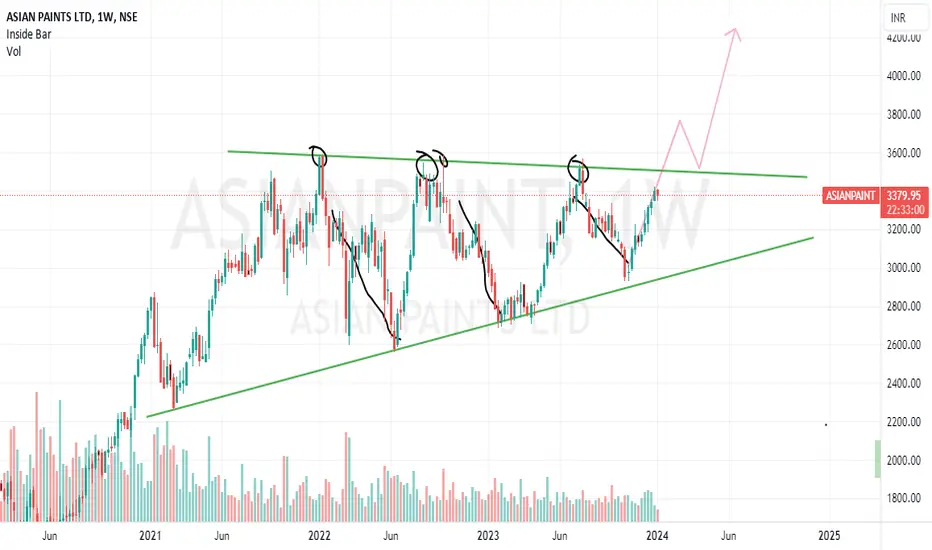
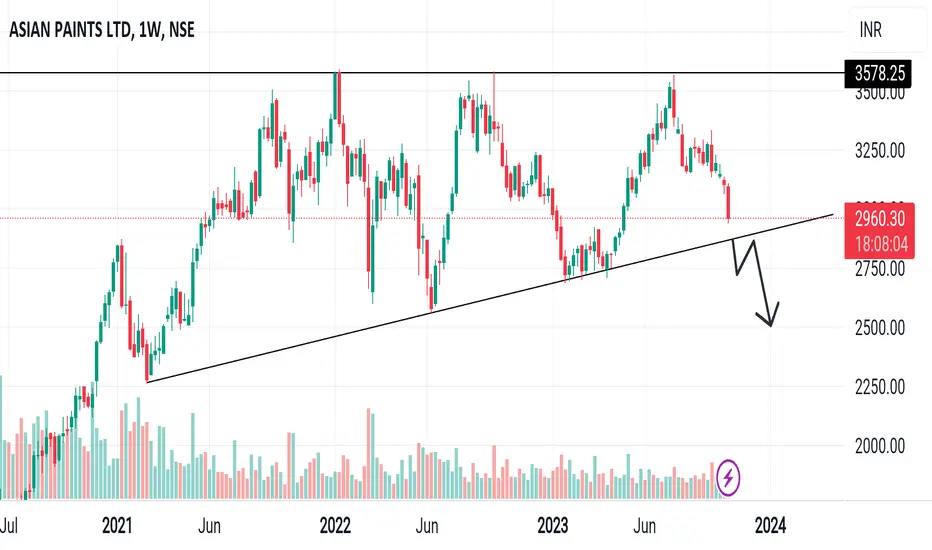
Asian Paint 1W TF Asain paint will breakout from an ascending triangle pattern in coming weeks. Once it breaks out, wait for the pullback, and then enter the trade for a good upside move.
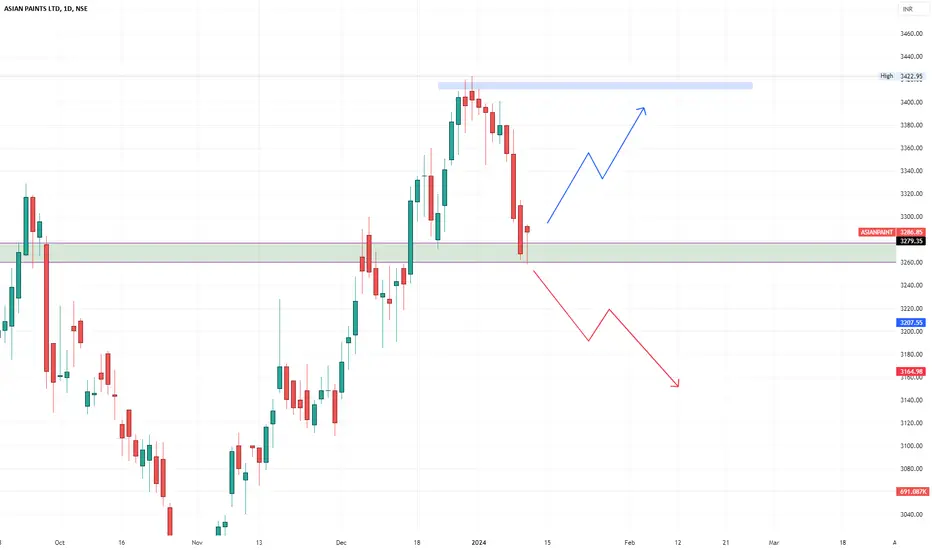
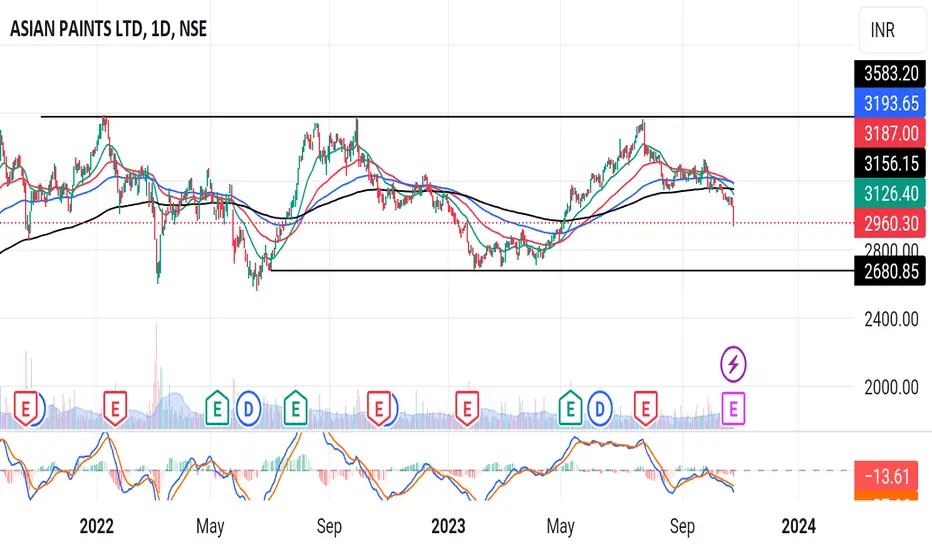
ASIAN PAINT 1D TFAsian Paints is currently in a perfect zone. A directional move is expected from this point.
Upside level:- 3420
Downside level:- 3100
Keeping SL of only around 50-60 points, a 1:2 move is easily expected on each of the sides.
Trade safe. Manage risk. Be profitable.
Please follow us for more simple trading analysis and setups. Also, let me know in the comment if you have any queries.
Disclaimer:- This is my view. Please analyze the charts yourself and then decide to take any trades.
#AsianPaintsWith a depreciating rupee signs along with recovering european economies and stable oil prices. Asian paint is all set to go for a new bull run.
Company has regularly shown a rising FCF irrespective of the macro economical conditions.
Asian Paints is trading near supports of the long term trend channel. Upside targets above 9500 by Jan 2025.
P.S: These are only my personal views and are for only information sharing. These are not any buy or sell tips. Please consult your SEBI registered financial advisor before making any trade or any investment in the stock market as stock market is subject to market risk.

Asian Paints is in Green ColorThere is a breakout of triangle on weekly time frame. I understand it will reach to 4000/- in next 3 Months
Note: It is not at all the buying and selling recommendation and this stock is in my portfolio and there is a high probability that my analysis is biased and could be possible my analysis will go wrong.

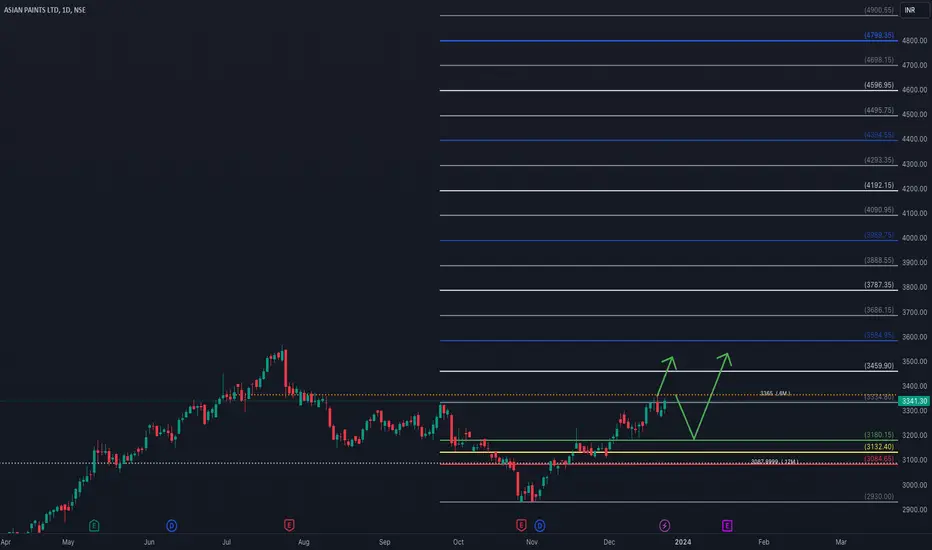
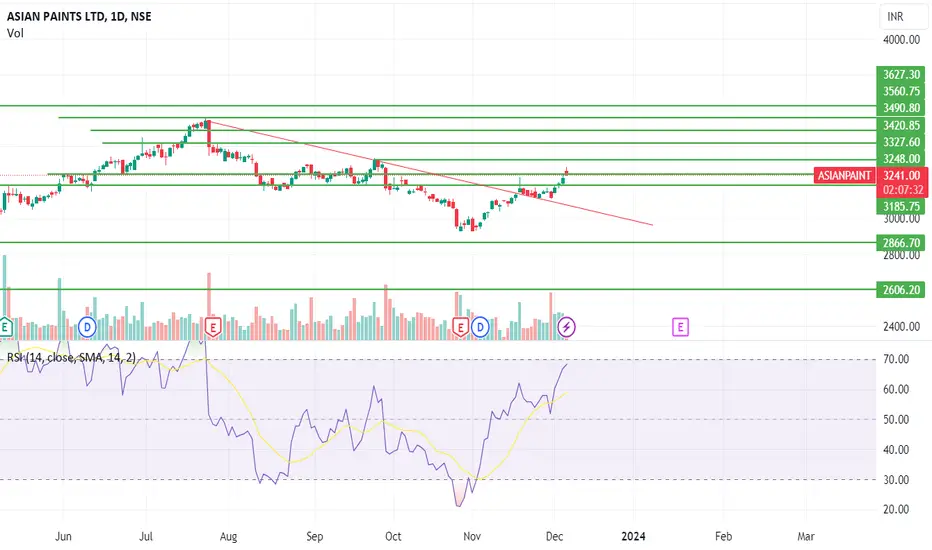
ASIANPAINT Daily timeframe analysis for long term
NSE:ASIANPAINT about to breakout 3365 level.
We can see long term move above 3365 with SL of 3084 and can average till 3132.
Major targets levels are highlighted in blue lines.
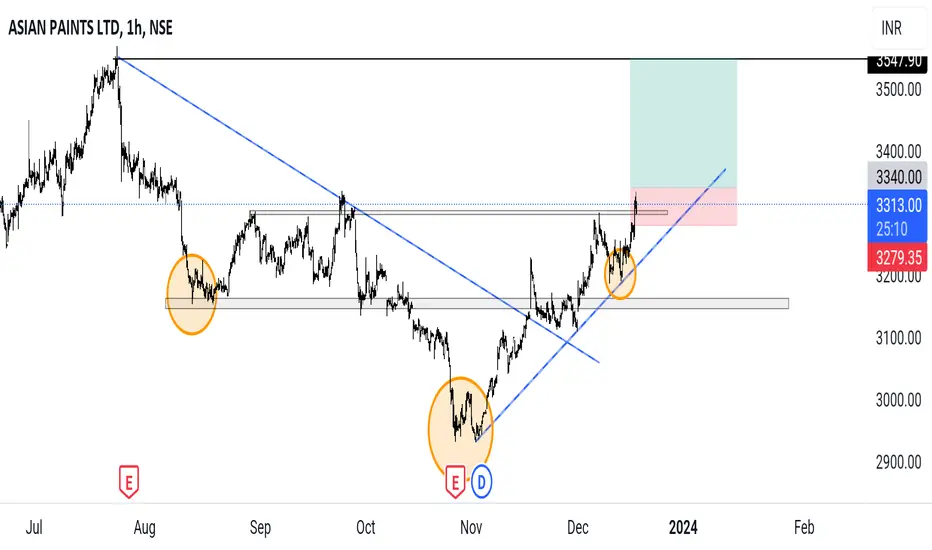
Asian PaintsAsian Paints showing a breakout after forming a Inverted Head & Shoulder Pattern on Hourly Time Frame
Just for Educational Purpose

Asian paint inverse head & shoulder weekly breakout Asian paint inverse head & shoulder weekly breakout For swing target of 3575 and 3957.

14 Year's SupportAfter Multiyear Underperformance finally in Ratio Chart Price Trading near 14 Year's Momentum line and looks like Asian paints ready to outperform now .

ASIAN PAINTS..BuyBuy this flag breakout...tgt of flag calculated is 4000 buy feb end....Simple explaination...this is a investment call...

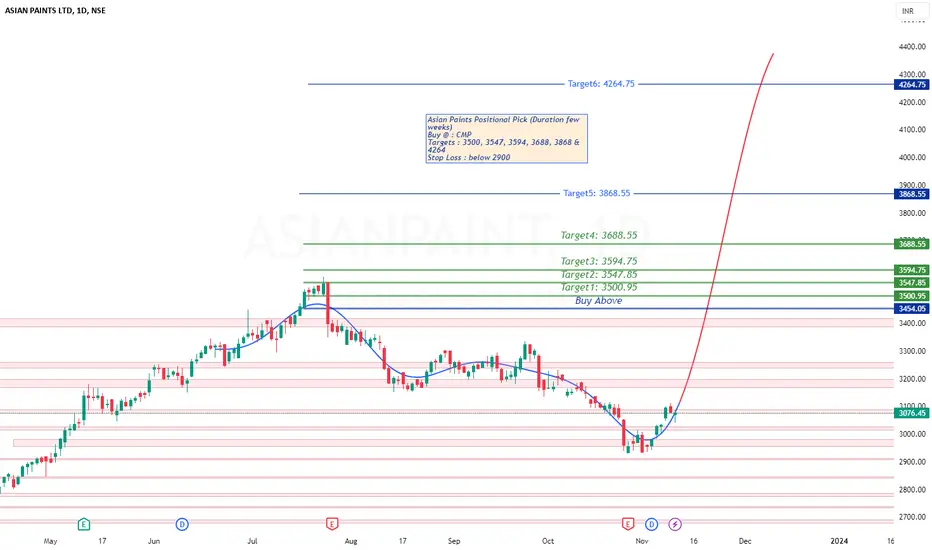
Asian Paints Positional PickAsian Paints Positional Pick (Duration few weeks)
Buy @ : CMP
Targets : 3500, 3547, 3594, 3688, 3868 & 4264
Stop Loss : below 2900
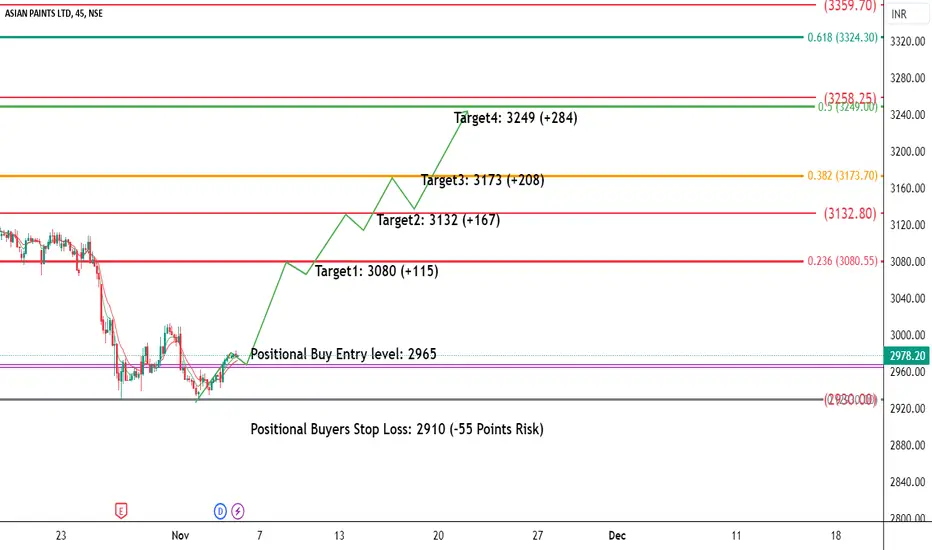
Asian Paints High Reward IdeaAs per my analysis NSE:ASIANPAINT has completed its weekly correction. Sustained above previous low's and trying to make ready for upside rally. Best entry level to take positional buyer entry is 2965 with stop loss of only (2910 (-55 Points Risk). My expected upside target would be 3080 (+115), 3132 (+167), 3173 (+208) & 3249 (+284).
This could be very low risk and very high reward idea.
Note: This is my personal analysis, only to learn stock market behavior. Thanks.
ASIAN PAINTS 📢 TRENDLINE BROKEN📢
CMP: 2960.30
If stock price trendline broken than bearish movement see in coming days!
These are swing ideas which you can add your watchlist and analysis for yourself !
Keep on your radar 📡
This content only education purpose!
❗I am not sebi ragister❗
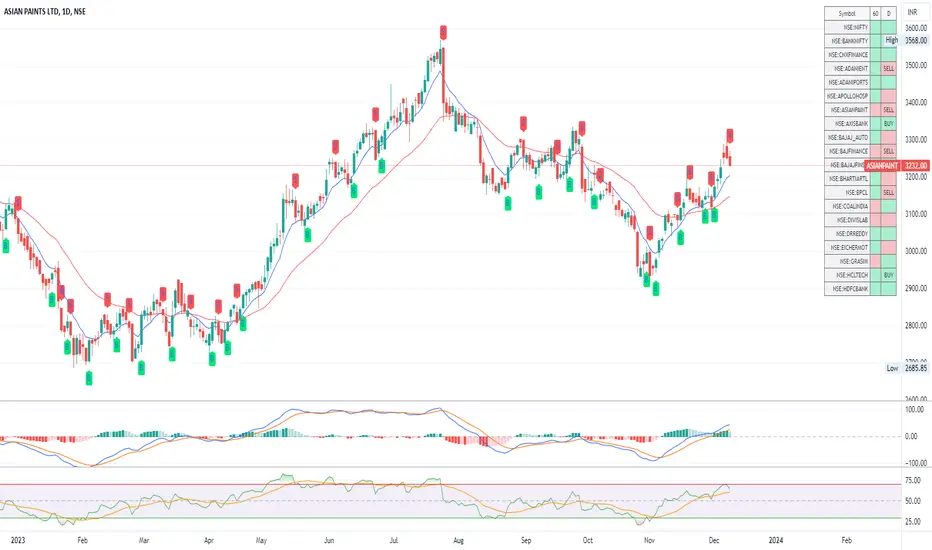
ASIANPAINTS Stock Clearly show sideways in higher time frame.
Result impact today stock down almost -3%
Very weak chart setup
Go for short trade
Macd Bearish crossover
RSI Bearish signal
Price below all Moving averages
Disclaimer This is my personal view for education purpose only
No Buy sell recommendations.
ASIANPAINTS - Trending down. Good Risk Reward for shorts.Asian Paints seems to be repeating prior behavior. Shorting 3150 looks promising.
Short at 3150
TP1 - 3000
TP2 - 2900
SL - 3250.
Disclaimer - I am not a financial advisor. Just learning, experimenting and sharing my prediction. Take trades at your own risk.
ASIANPAINTS BuyThis one is in a downtrend..Buy some here and keep more cash for adding on the downside...Note the downside is not over yet..so buy in tranches....Most probably,Its forming a flag...
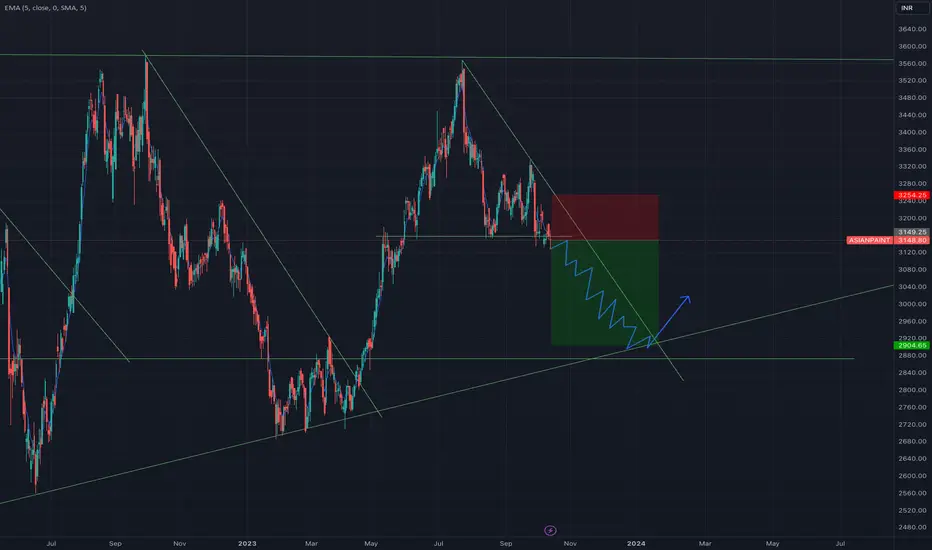
ASIANPAINT--Long on Trendline Break and Retest??I am sharing the important levels of Support and Resistance. These levels play a crucial role in trading decisions, as they act as reliable markers of price movements.
------>>Support levels are price points where an asset tends to find buying interest, preventing it from falling further.
---->Resistance levels, on the other hand, are points where selling pressure typically prevents the asset from rising higher.
If price breaks the resistance, we have a chance of filling the bearish gap, soo keep in buyside until it touches the zone of resistance and bearish gap.
Take a look at these levels and trade accordingly. Recognizing and respecting these support and resistance levels can help traders make informed decisions and manage risk effectively. They serve as key reference points for technical analysis and are vital tools in successful trading strategies.
Trade safe...Thank you guys for your support
ASIAN PAINTSStock finally Breakdown
200 DEMA Break
Don't create fresh long position as now.
Some shorts possible
Today day high S.L
Disclaimer This is my personal view for education purpose only
No buy sell recommendations.
ASIAN PAINTAsian paint ready to fire as it is taking support on 20 MA. also gud consolidation on weekly chart. keep an eye of it.
