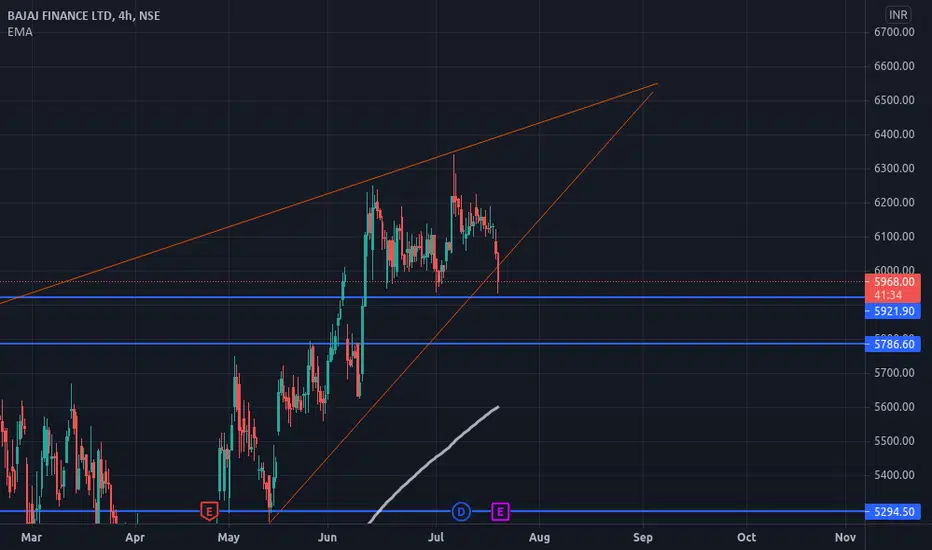
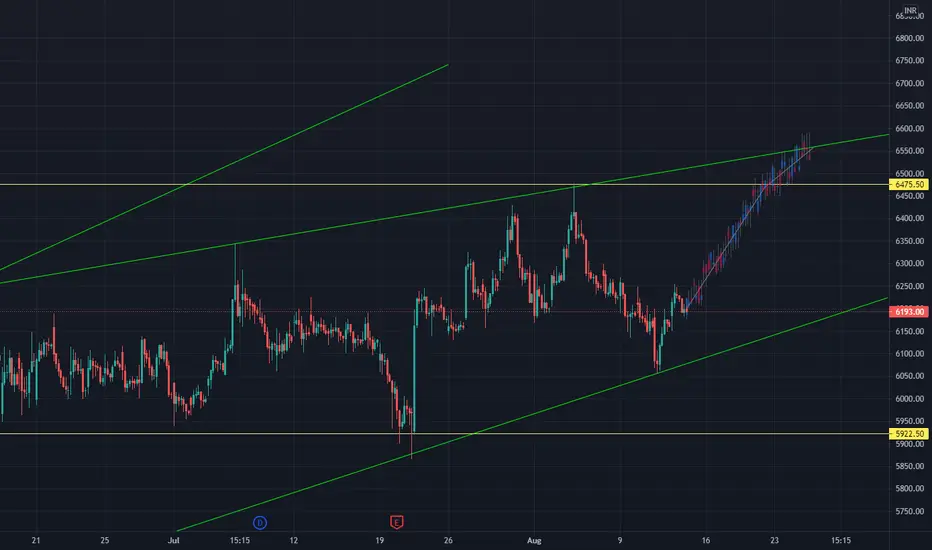
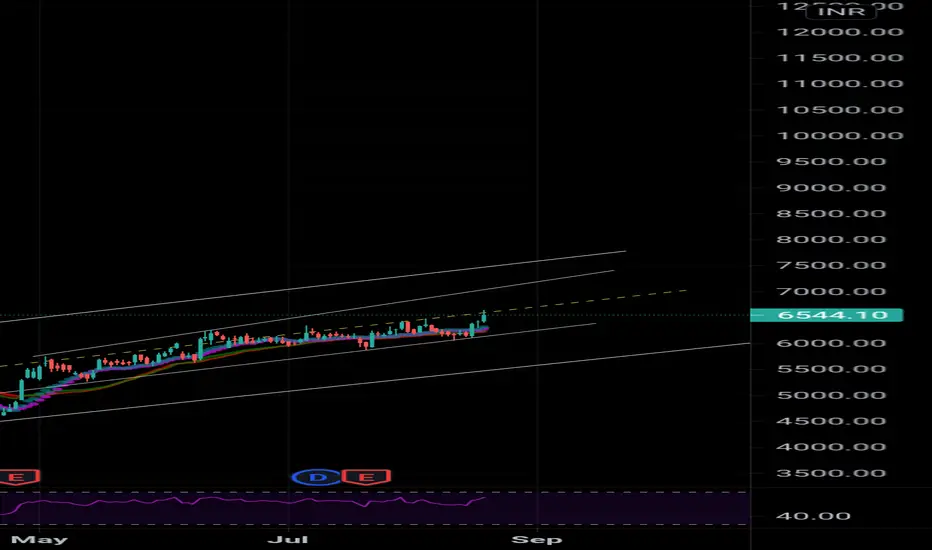
Bajaj Finance still upside can happenAs per chart analysis l'm expecting it can touch 8000 as a round level by the end of the September or 1st week of October but one things we should remember this stock is hugely out perform after COVID so book profit at 8000 level and it can do more of sustain above 8000. Trend line for you information and only education purpose.
Cheers
Happy learning
BAJFINANCE trade ideas
Long in Bajaj Finance LtdI do expect a moderate bullish move in this scrip is in coming days, have this scrip in your watchlist. Have your SL below the resistance and try to hold it for a month.
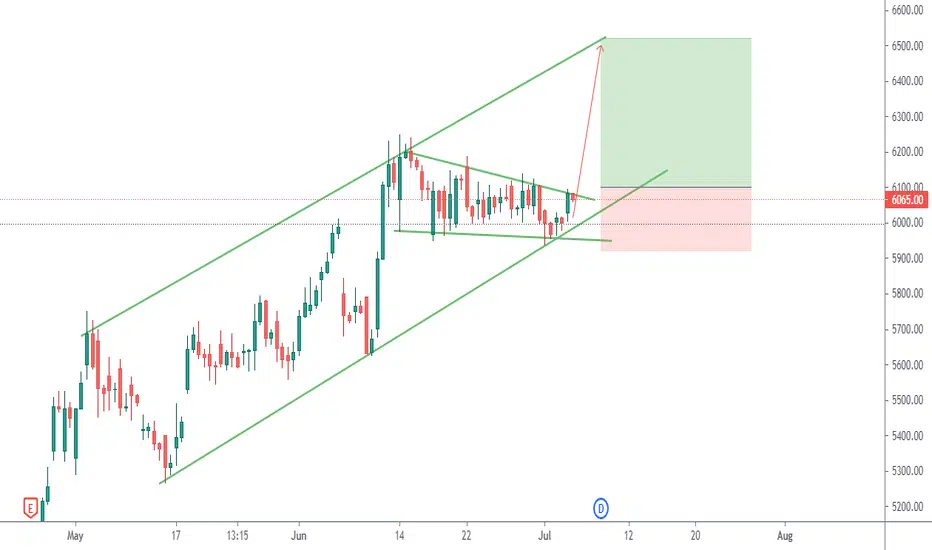
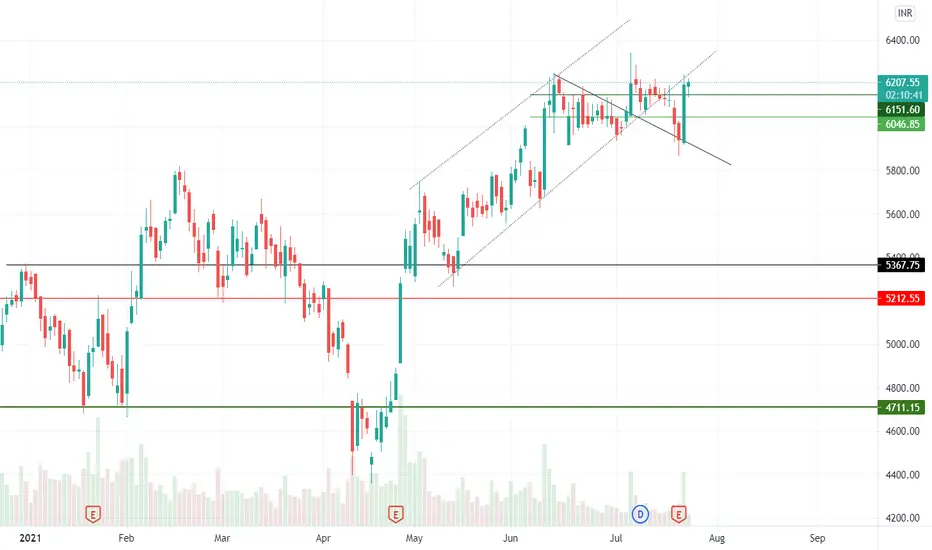
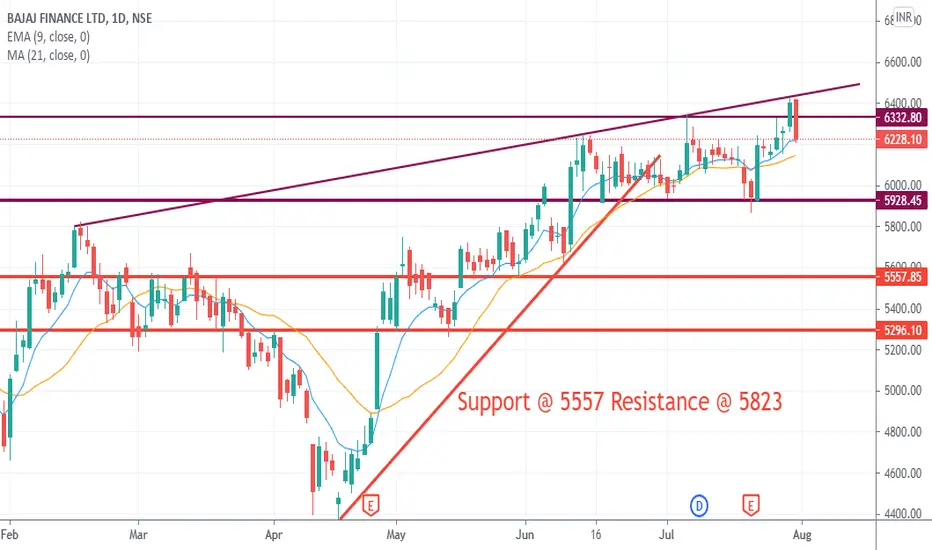
Analysis on Bajaj finance Break down from the channel and get to retest
6000 possible within 3days and will be in range bound 5950-6250 just 300 points range
bounced from trendline support and psychological support
therefore, break out above 6300 target will 6700,6900 from fib A
at the same time, break down below 5900 target will be 5350
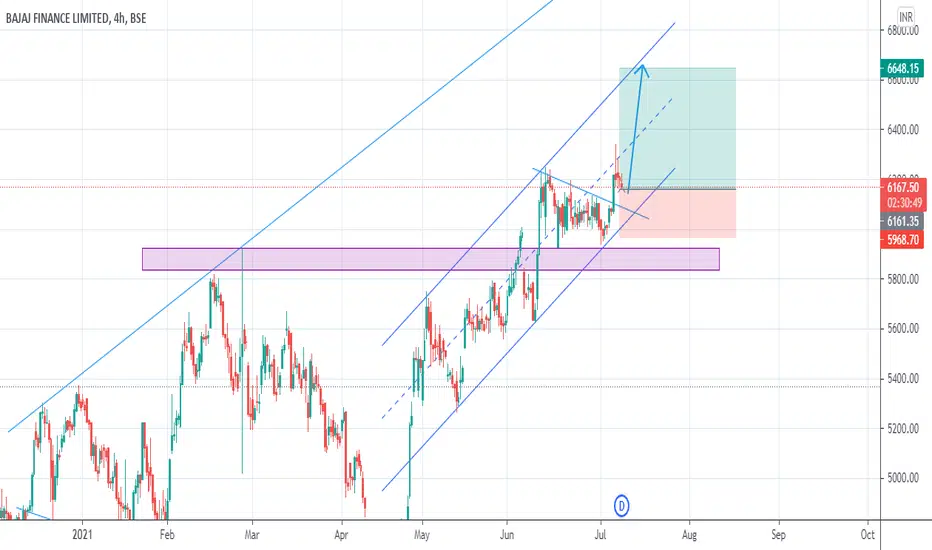
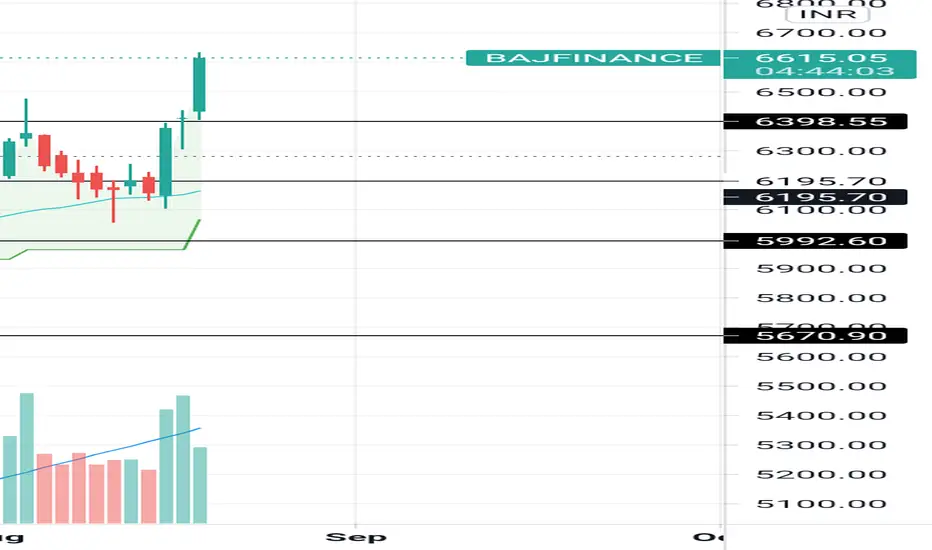
Upper circuit in some days Expected From last few days it's been consolidate after 6630 it's go long
Targate :- 7289,7437,7645,7700
Buy Bajaj finance Target 🎯 7000Buy Bajaj finance Target 🎯 7000 because it is on its major Resistance .
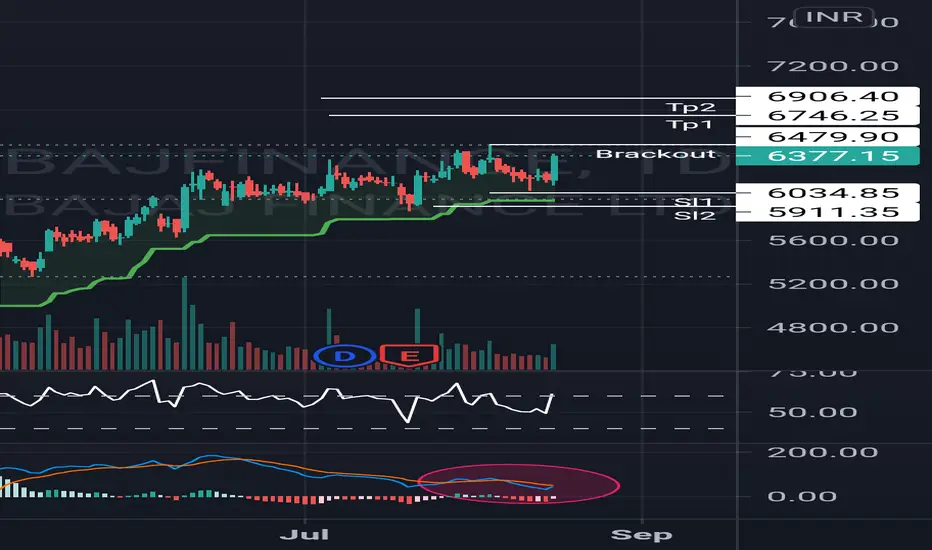
BAJAJ FINANCE LTDThis stock is near brackout
Stock related information-
- higher delivery quantity.
- stock outperforming benchmark index.
- increased relative strength benchmark index.
-SRS & ARS Abow zero.
-5 EMA crossing 20 EMA below zero.
-MACD crossing abow zero line.
Note: Long for 15 days to 1 month for tp1 and tp2.
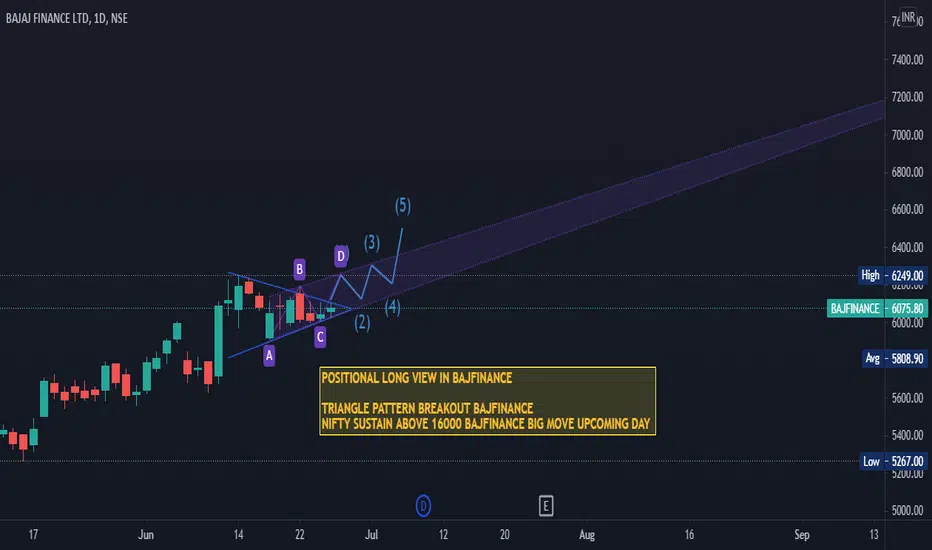
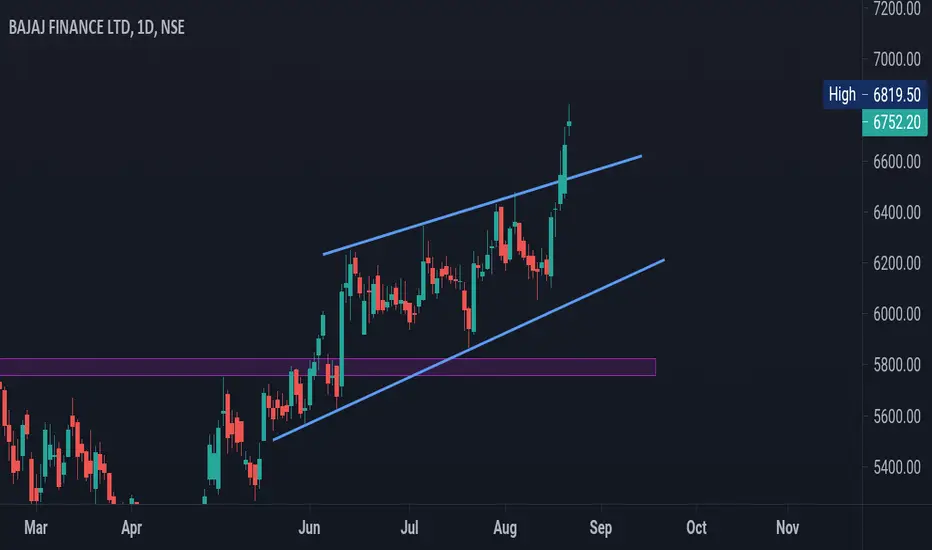
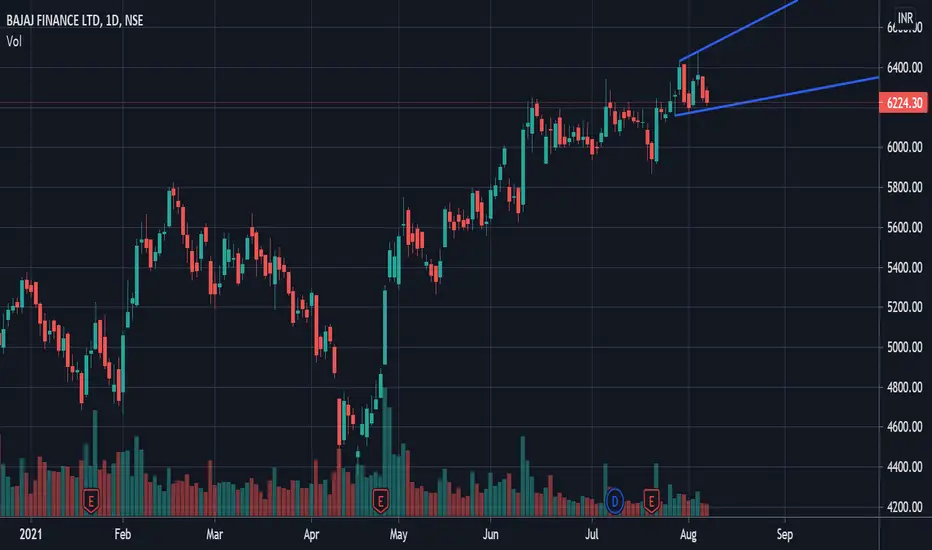
Bajfinance break the symmetrical triangleBajfinance break the symmetrical triangle. Then retest and go up

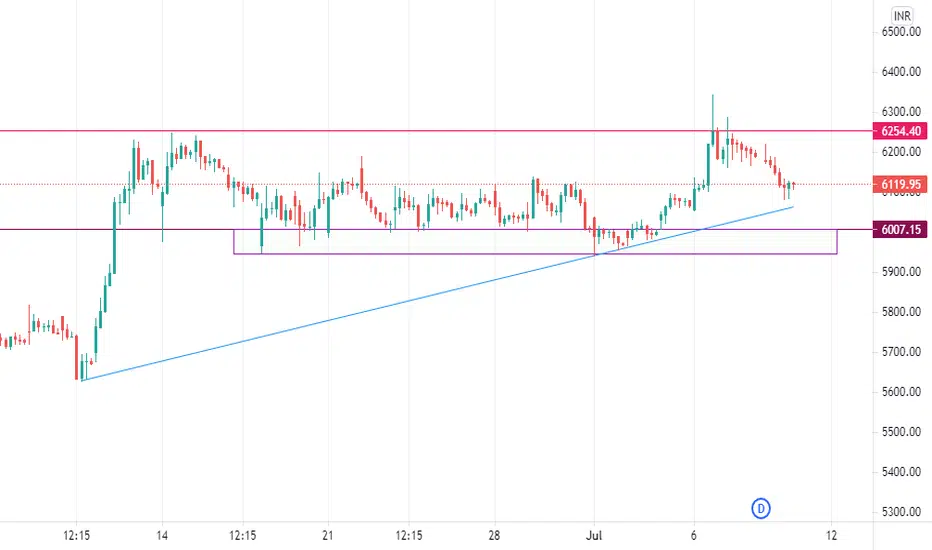
BAJFINANCE looks undecisive and could breakout either wayJust marking a couple of levels on the daily where the stock has been taking support(5925) and resistance(6223) multiple times now. We wait for a breakout on either side. A strong closing above or below these levels could trigger our entry but caution is advised as it's been stuck in this zone for a while now. Entry looks good with 1:3 being the minimum target. Lower SL Bigger Targets. Cheers and Happy Trading.

Price ActionTrend lines can be used to trade, if it closes beyond those trend lines trade can be taken respectively
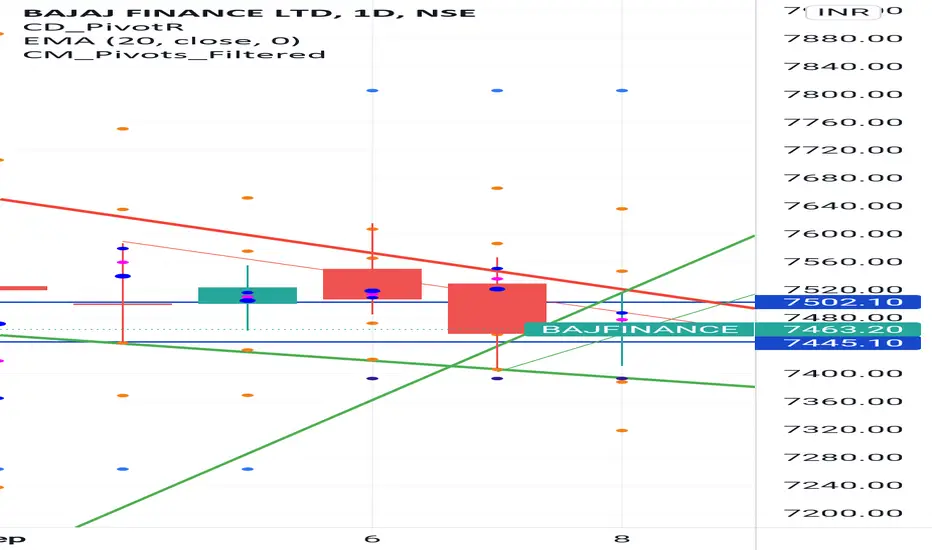
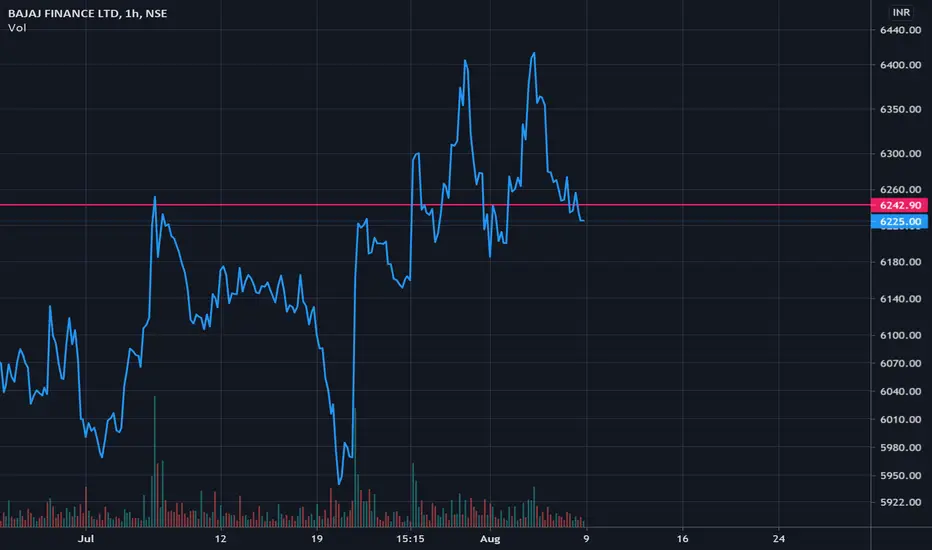
Double Top Formation in Bajaj FinanceNSE:BAJFINANCE
Chart shows double top at hour chart with the Support at 6240
If support is broken then it have a disadvantage of double top at same time.
Bajaj Finance at long term support with Double TOP Formationbajaj Finance at good Support if breaks with good volume then it can be shorted or it can Test the Support and can FAIL the Double TOP Formation. NSE:BAJFINANCE

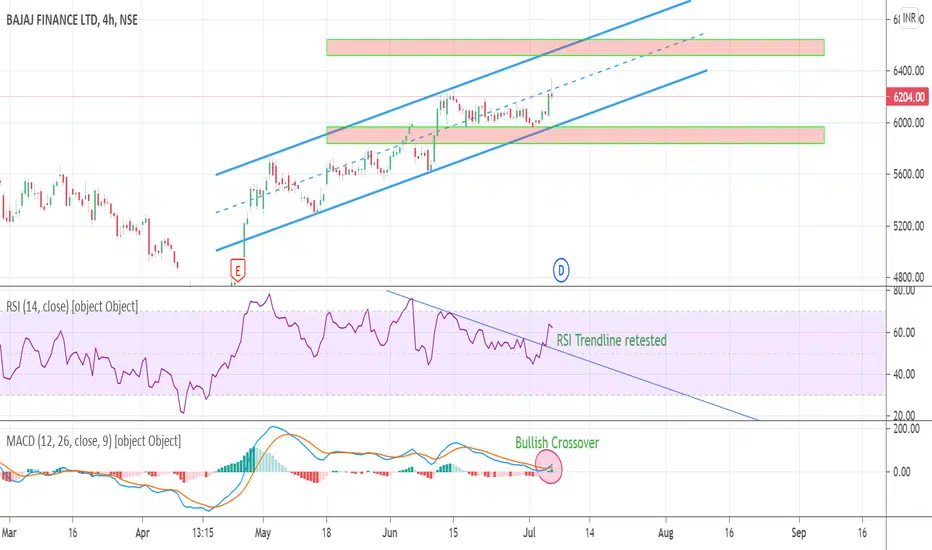
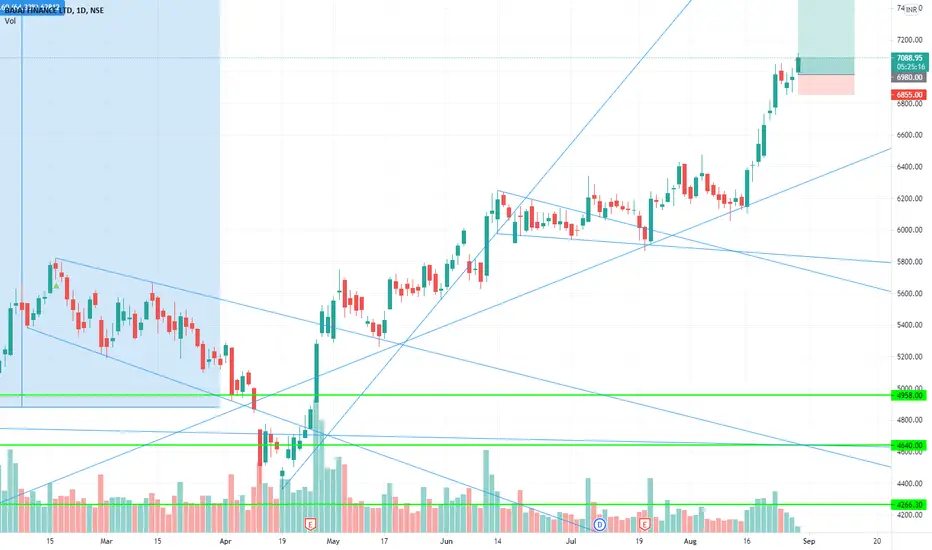
Bajaj finance Bajaj finance has given double breakout, one on daily basis and other on hourly basis, both breakouts are having good intensity of volume, as per wave structure it looks like 3rd of 3rd. all the indicators parameters are also aligned with positive situation, one can go long at these levels or in dips with key levels mentioned on chart
Key Levels are Mentioned on chart
Breakout with Good intensity of Volume in daily
Breakout with Good intensity of Volume in hourly
Macd in daily positive crossover and Uptick
Macd in hourly positive crossover and Uptick and also above zero line
Rsi in daily above 60 uptick
Rsi in hourly near 60
Dmi adx positive ungali setup in daily time frame
Dmi adx positive ungali setup in hourly time frame
Upper Bollinger Challenged in hourly
Disclaimer
I am not sebi registered analyst
My studies are Educational purpose only
Consult with your Financial advisor before trading or investing

BAJFINANCE - Reversal from here!!Watch the stock movement whenever it takes support of the 50ema.
Hoping for an uptrend from here.
View negated below demand zone close.

BAJFINANCE SHORTAs we can see trend line support has been broken on 4 HR chart it's going for a retest at below level