HINDUNILVR trade ideas

HINDUSTAN UNILEVER ANALYSIS!!i want to say a lot of things in this idea.
so i will take it step by step, and be with me till the end of it.
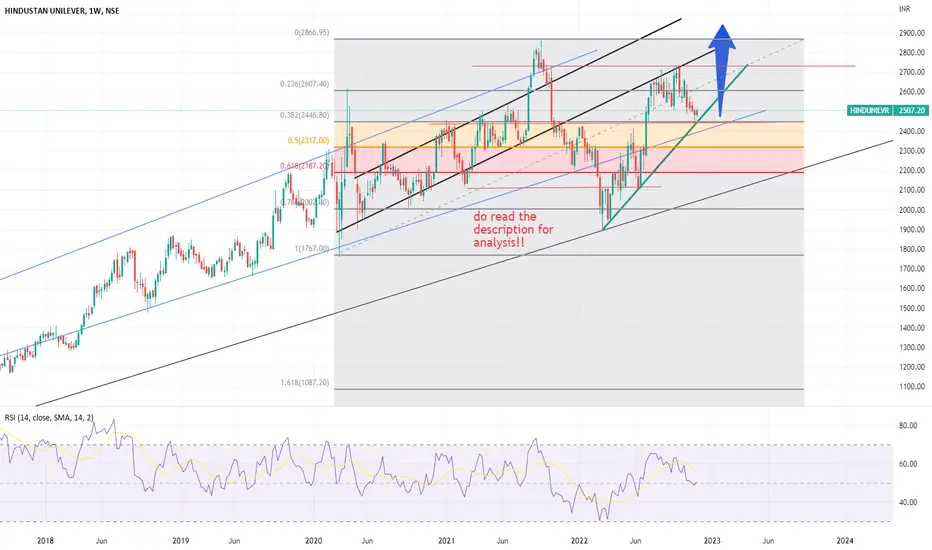
first lets talk about the trend lines:
TREND LINES:
the blue lines: are the trend been followed by the stock past from the corona crash.
the major black lines is the new trend which should be followed by the stock.
this is because, the 2020 crash gave a boost to markets, and even many other sectors got benefitted from it.
HUL is the market leader, and do takes a good position in NIFTY 50, the fmcg sector has a good future(said by many analysts), the sector is forming and be gonna great in coming future.
HUL will support the above statement. the trend is drawn by the markets consolidation, and major points of resistance and support.
the red lines drawn are just crucious level to watch when to buy/sell considering only short term swing trading. yup, more can be drawn, but i found out those as much more crusious
the major green line is the support taken by the stock, after the FII selling been stopped and markets started to recover, and make the stock come back to its new trend.
2nd step: FIBBONACI RETRACEMENT:
recently the stock came down and stopped at 0.5 level. and now it is followed by going upside, with a green candle.
this week will be a could positive reaction of the stock. offcourse in the month of DEC, i am positive too.
(fibonnaci is taken from the lowest point of 2020 crash till, the ATH of stock).
3. RSI INDICATOR.
do note in the weekly chart of this stock, the RSI have mostly ranged from 45-75. currently its around 50, so this increases a lot of chance that HUL is undervalued.
FINAL POINT: i could still more add more indicators, to show, but not to consider over analysis, or say not make my idea so lengthy. its obvious more this 3 points(stated above), that HUL is a great to buy at this level.
one could earn about 20% from the swing trade, and about 40% return annually.
Hinustan unilvrWhen ema turns lime this and provides support price tends to fall, ema support very very important for price to keep pushing

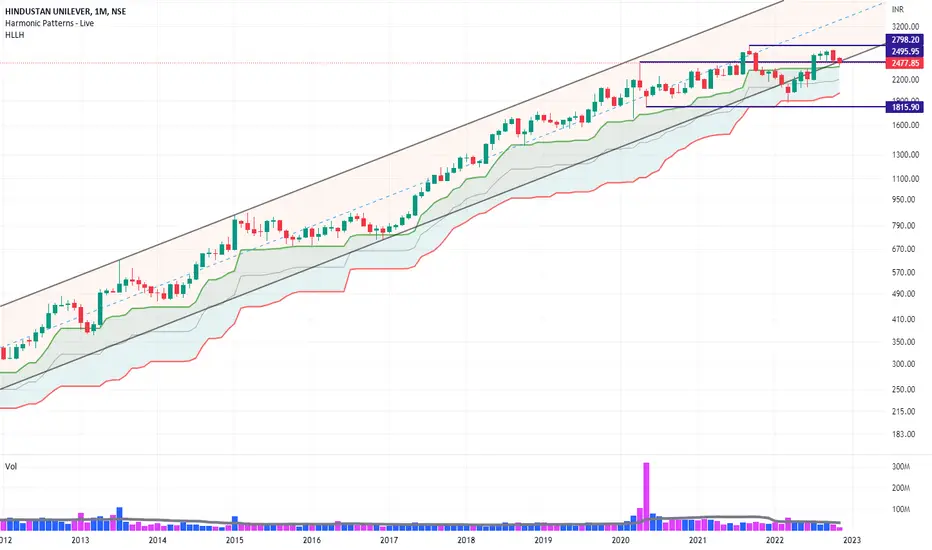
HINDUNILVR - Has been in Range (1800-2800) for 2 YrsThis was after, 10x up from 250 to 2500
Plan ahead to Purchase Breakout above 2700
or, rejection indications near 2200
PB 12x
PE 60x
ROCE 22%
Div 1.4%
Hindustan Unilever HindUnilvr stopped falling near its 50% fib retracement level of 2417 & made low of 1628 & bounced & making HAMMER pattern on daily charts.
Could be bought with mentioned stoploss & target.

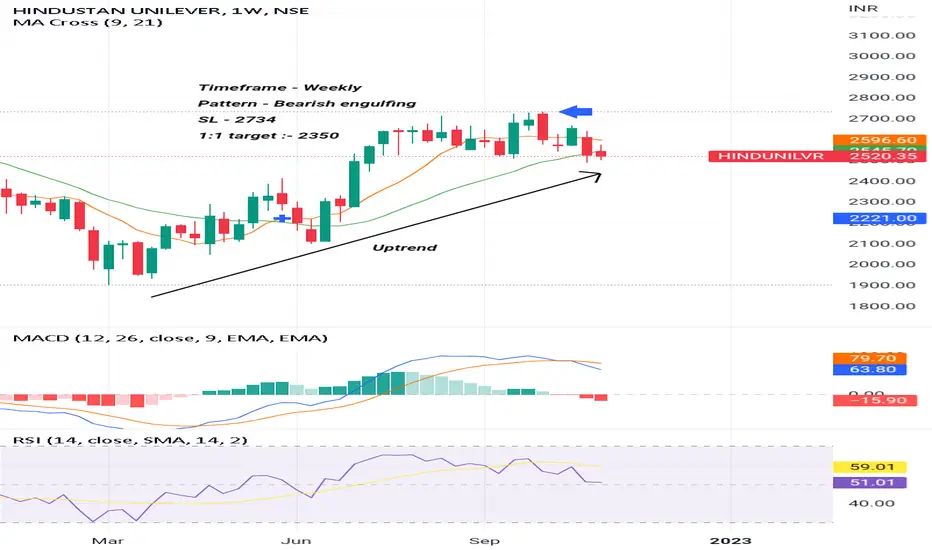
Hindustan Unilever - Weekly Chart Analysis Timeframe - Weekly
Pattern - Bearish engulfing
SL - 2734
1:1 target :- 2350
Also MACD negative divergence are there.
Rsi also in downtrend.
HINDUSTAN UNILEVER .................................................................................................................................................................................................

HINDUSTAN UNILEVER HINDUSTAN UNILEVER - Short candidate
1. Weekly TF - A channel breakdown has invited bearishness up till the red line (POC).
2. Daily TF - Shark Alt harmonic
A breakdown below point B has invited short targets till 2425 on the downside.
Once can maintain a SL of 2601.

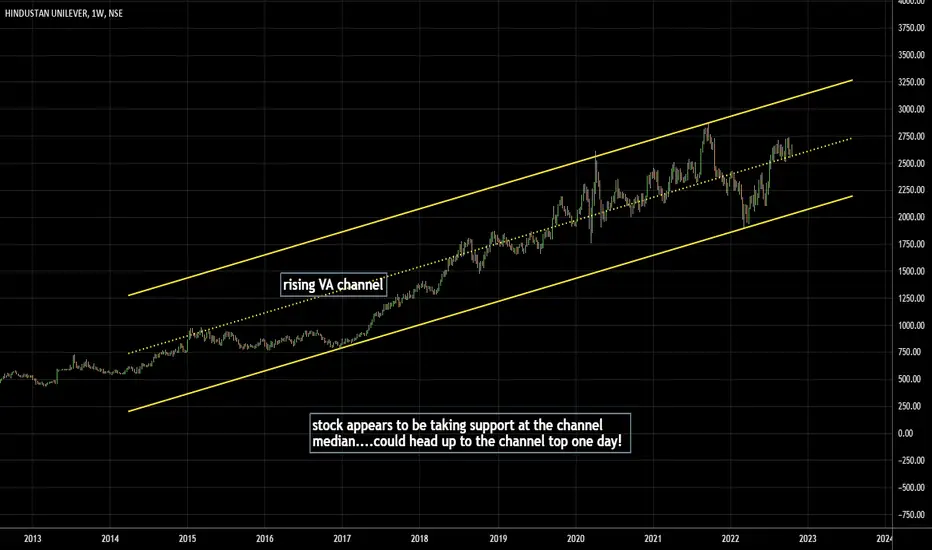
HINDUNILVR is at good support!stock appears to be taking support at the channel median....could head up to the channel top one day!
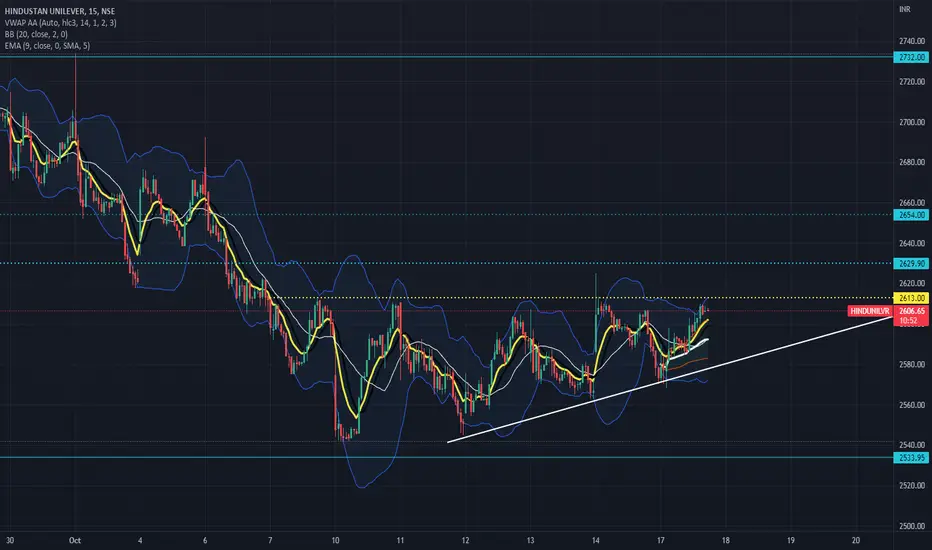
HUL- The Great BullHUL is trading inside ascending triangle pattern with good volumes on smaller TF.
Also level of 2613 happens to be strong resistance zone.
If HUL-The Great Bull manages to break past 2613,
Then its a BUY with stoploss of 2850 & target of 2700 in max 2 trading sessions.
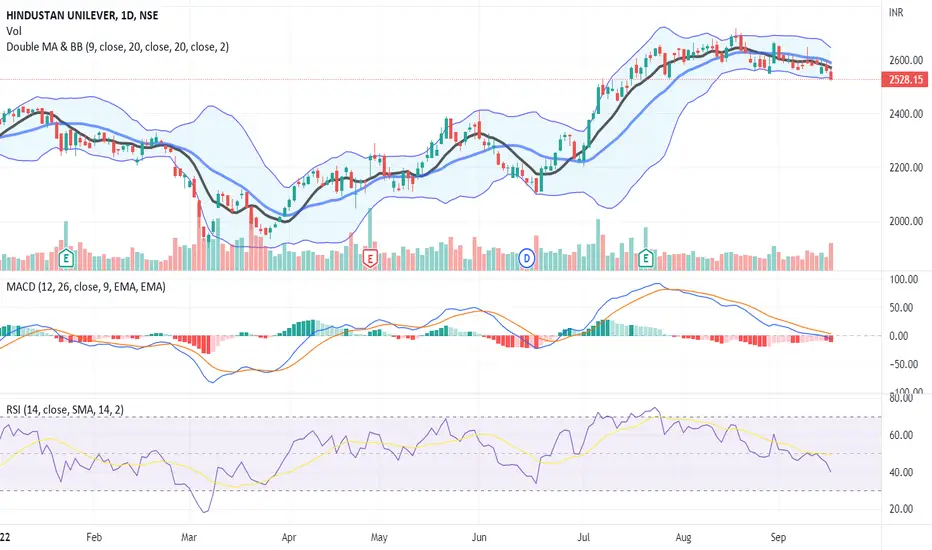
Hindustan Unilever Limited - Down Trend📊 Script: HINDUNILVR (HINDUSTAN UNILEVER LIMITED)
📊 Nifty50 Stock: YES
📊 Sectoral Index: NIFTY FMCG / NIFTY500 / NIFTY
📊 Sector: Fast Moving Consumer Goods
📊 Industry: Diversified FMCG
Daily Timeframe
Key highlights: 💡⚡
📈 Script is trading at lower band of Bollinger Bands (BB) and giving breakdown of it.
📈 Already Cross-down in MACD .
📈 Already Cross-down in Double Moving Averages.
📈 Current RSI is around 39.
📈 One can go for Swing Trade for short.
⏱️ C.M.P 📑💰- 2528
🟢 Target 🎯🏆 - 2420
⚠️ Stoploss ☠️🚫 - 2582
⚠️ Important: Always maintain your Risk & Reward Ratio.
✅Like and follow to never miss a new idea!✅
Disclaimer: I am not SEBI Registered Advisor. My posts are purely for training and educational purposes.
Eat🍜 Sleep😴 TradingView📈 Repeat 🔁
Happy learning with trading. Cheers!🥂
Hindustan Unilever HUL broke out of descending channel yesterday with volumes & confirms it today with good volumes.
Could be bought with mentioned stoploss & targets.

Hindustan Unilever Long CallHindustan Unilever is showing positive move and trending towards upside..
it's a low risk high return call, with 3x plus returns.

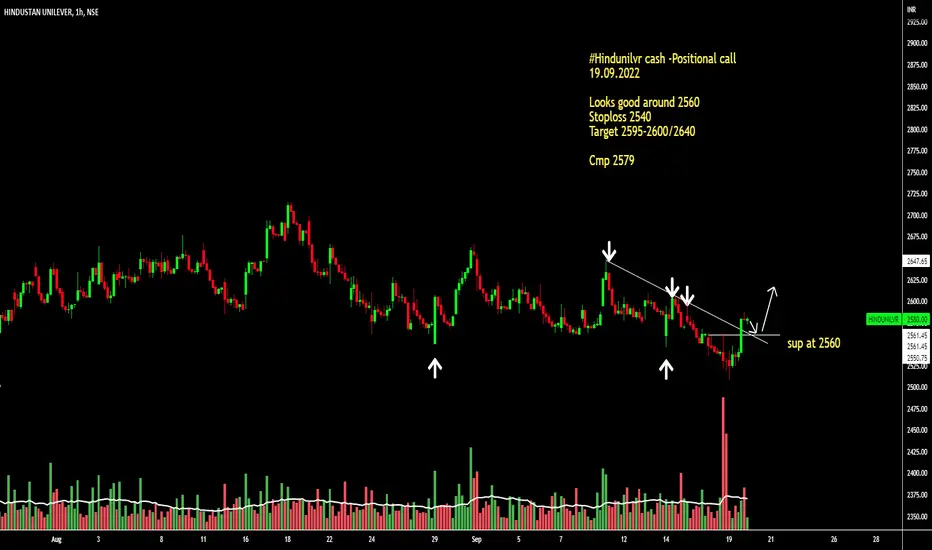
#Hindunilver cash : Looks good around 2560#Hdfc cash -Positional call
19.09.2022
Looks good around 2425-2430
Stoploss 2410
Target 2474-2480
Cmp 2442
HINDUSTANUNILEVER Buy for intraday tradingHINDUSTANUNILEVER Buy for intraday trading if stock break the given resistance level........

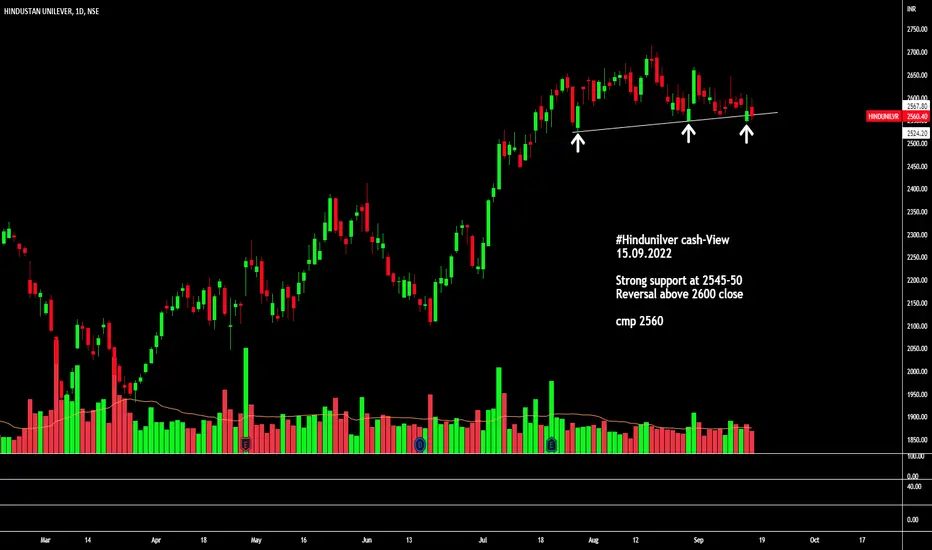
#Hindunilvr cash : good support at 2545-50#Hindunilver cash-View
15.09.2022
Strong support at 2545-50
Reversal above 2600 close
cmp 2560
BEARISH HARMONIC PATTERN - HINDUNILVR - LATE ENTRYI was late to publish this idea, took position around 2644 on 19th Aug 2022
Bearish Harmonic Pattern Established, possible targets mentioned in the chart
Disclaimer - This is not a buy or sell advice. I am sharing what I see on the chat & what I am trading, based on my own knowledge & understanding. Please consult your financial advisor before taking any bets in the stock market. I will not be responsible for any profit/loss you incur on your trades based on my published ideas.

HINDUSTAN UNILEVERHello and Welcome to this analysis
HINDUSTAN UNILEVER the FMCG giant in hourly time frame is forming another ascending and inverted scallop bullish formation.
Ascending & Inverted Scallops have a success ratio of approx 70%. They are found in bullish trends and their formation works wonderfully with Fibonacci ratios as found in this case.
It looks good for 2700 as long as it does not break below 2590.
Good risk reward set up as FMCG stocks appear to be in a strong uptrend.
Good Luck and Happy Investing

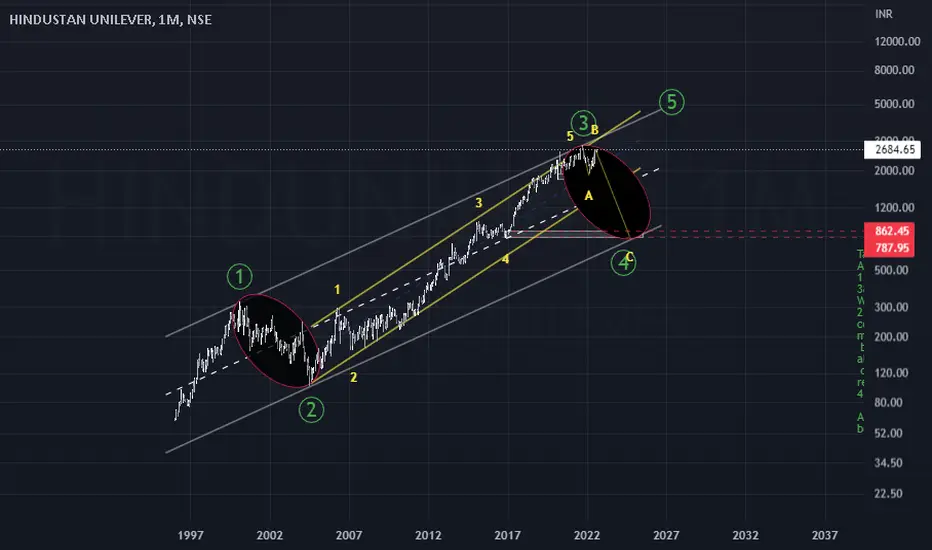
SRIRAM TRANS, HULWave 2 corrections are coming to an end in Shriram trans. In HUL wave 3 of wave c has already started. Nice trading setup. all the best.

nifty 50, airtel, shriram transport,hulFinally the decline. Global positions are not good. good time to short. all the best. Happy trading.

HUL Bearish HUL shown bearish in D time frame by formation of Evening star candlestick pattern & RSI shows weak
#Education Purpose

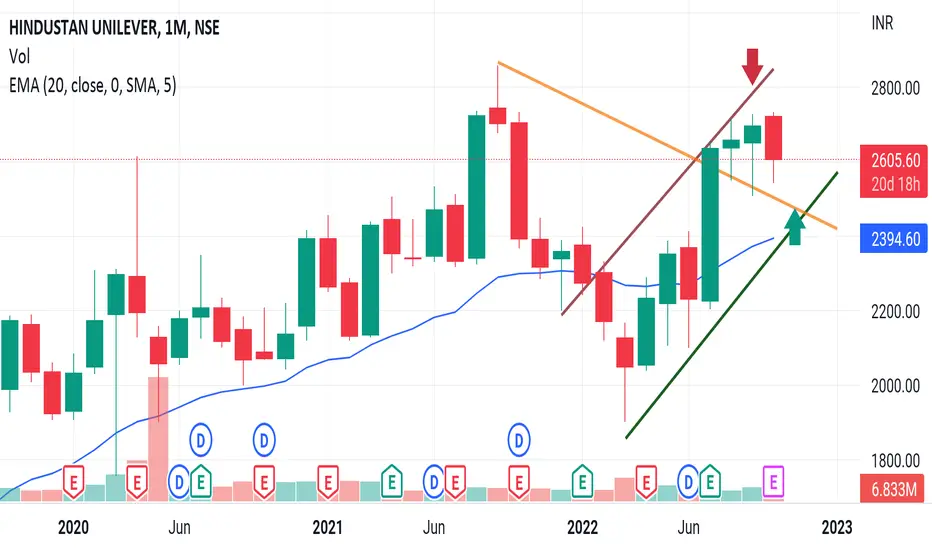
Hindustan Unilever! Is Party over?Monthly TF chart is bearish!
Time to look for Good Short Opportunity!
I am just sharing an Idea, its not an investment advice!