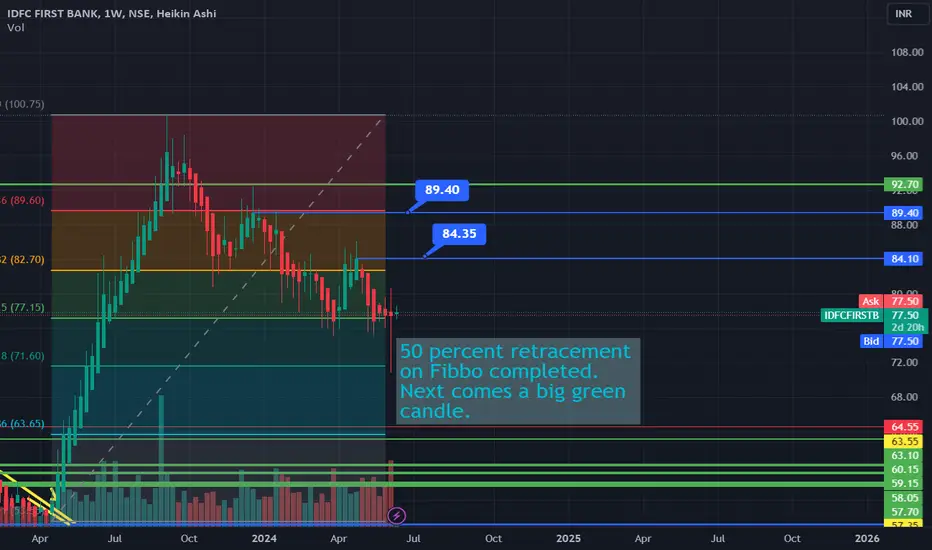
IDFCFirstB_11.06.2024Retracement completed well. Looking for a spike soon with volumes. Great chance for short term traders with small risk.
IDFCFIRSTB trade ideas
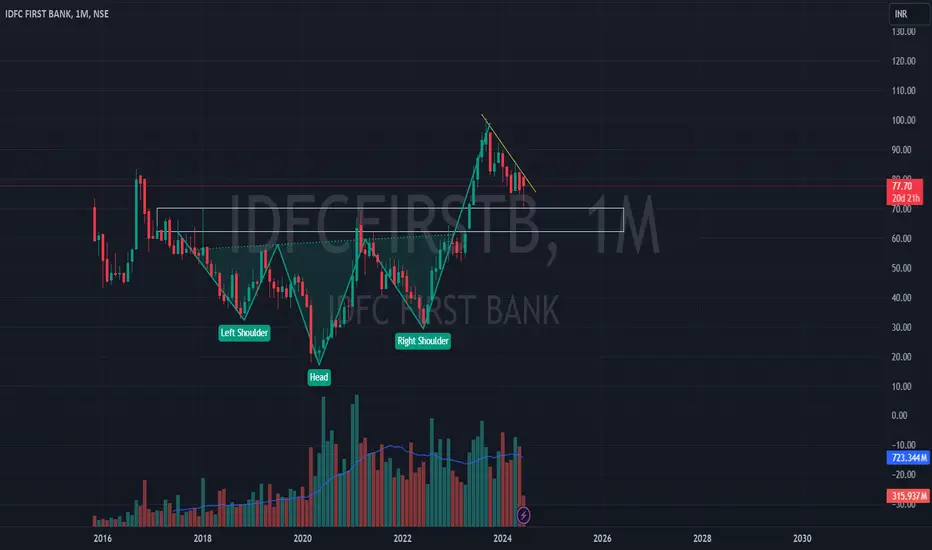
IDFC FIRST BANK 1MINVERTED HEAD AND SHOULDERS PARTTEN IS OBSERVED.
.
.
.
.
.
.
.
I Am Not SEBI Registered Analyst. All Post and Levels Posting is only for educational and knowledge purpose. I Am not responsible for your any kind of loss or profit.
No Claim, All Rights Reserved.‼️
IDFCFIRSTBHi guys, In this chart i Found a Demand Zone in IDFCFIRSTB CHART for Positional entry,
Observed these Levels based on price action and Demand & Supply.
*Don't Take any trades based on this Picture.
... because this chart is for educational purpose only not for Buy or Sell Recommendation..
Thank you

IDFC first bank can be averaged in this range again. Looks decent to buy till the stop loss. This stock is in good support region. Those who missed the rally of this stock can try here. For existing users we can avg buy here.
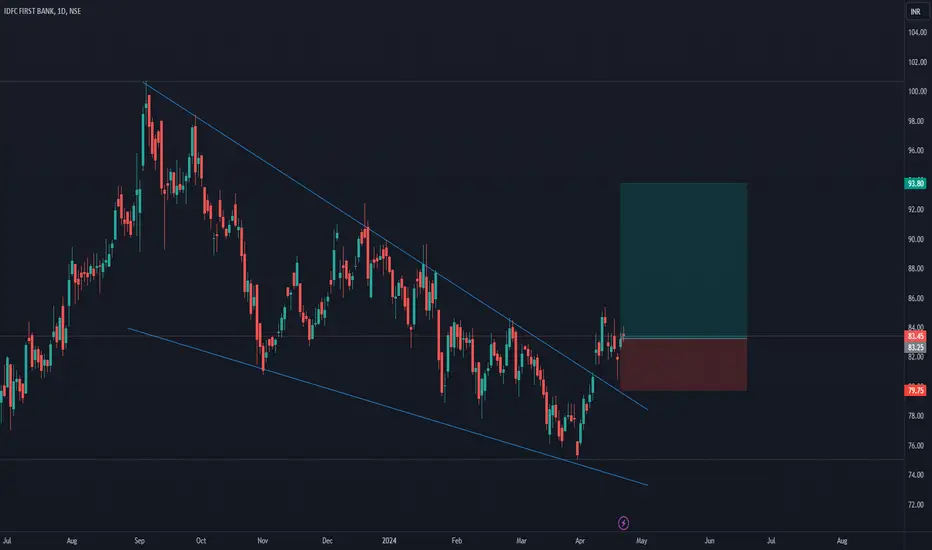
IDFCFIRSTBBuy Entry @ 83
Target @ 93
Stop Loss @ 79
Risk / Reward Ratio RR 3
Note: Please leave comments for any query.
Disclaimer: This is my trading experience, it is not an invite or recommendation to trade.
Best of luck..
Shakthi
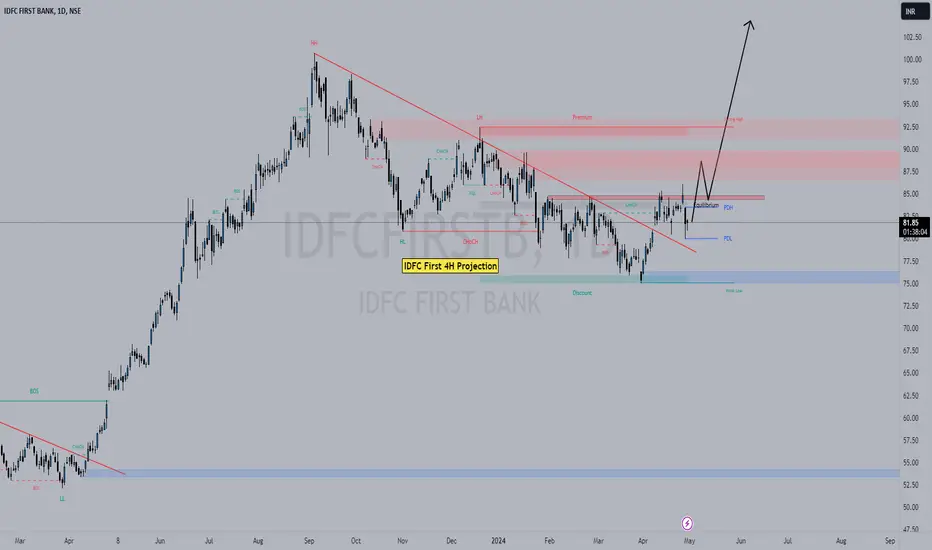
IDFC First 4H ProjectionIDFC First 4H Projection
Market is Bullish and also breakout trendline so, if nearest resistance break then buy for long term.
Idfcfirst buy 84 Sl 76 TGT 99Idfcfirst bank continue in range. Today break 84 plus trade. Now TGT 99 SL 76

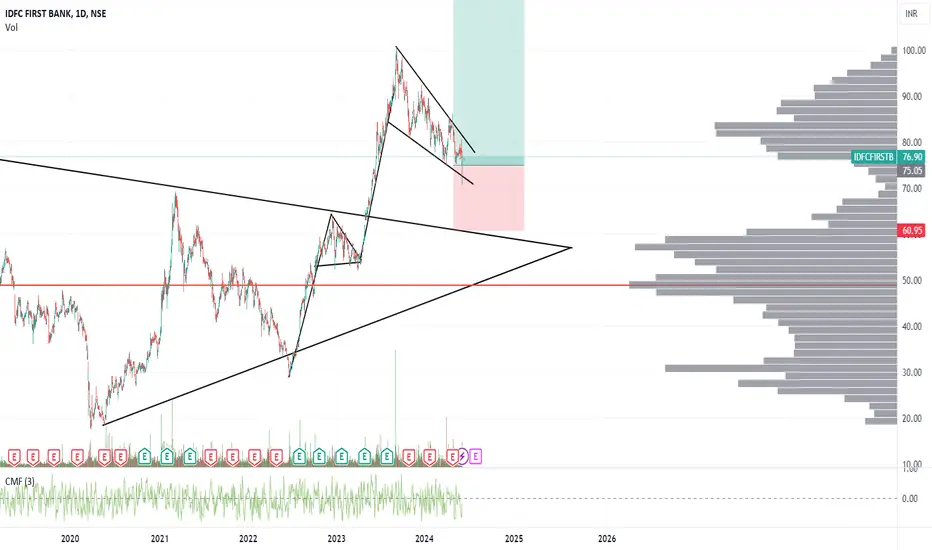
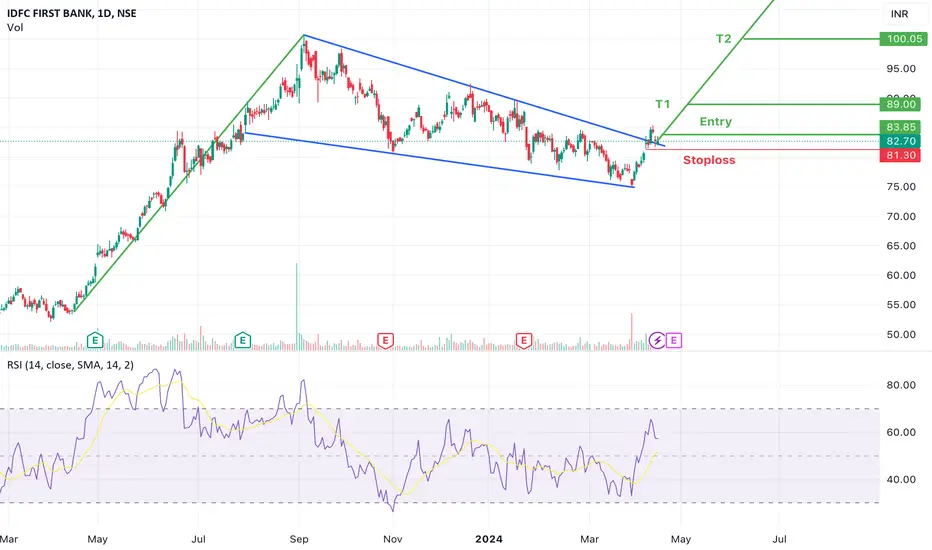
Falling wedges and Flag and Pole Breakout in #IDFCFIRSTBIDFC FIRST BANK has formed falling wedges and a bullish flag and pole pattern.
Today it has broken out again after the retest, taking support from the support trendline.
One can initiate a long position in this counter with mentioned:
Entry, stop loss & Targets.
IDFC FIRST WILL HIT 100/SHARE?🤫Hi Guys, It looks like IDFC FIRST has given a breakout from a Falling wedge, everyone will thought that it will directly hit Rs 100, but it will be not like what others think. There is a resistance on 89-90 Which might become the reason that IDFC will again trade around Rs 80.
What a person who bought around 85 can do..? He can hold and wait till it breaks Rs 90 my personal view is to HOLD & ADD more shares on pull back.(not any recommendations). The reason is (1) Break out from falling wedge (2) the high chances of golden cross becoz price is above 50MA and about to break 200MA so 50MA will move upward and cut 200MA.

Idfc firstb ank#Idfcfirstbank is ready for strong rally . It is going to show a very phenomenon growth in next few quarter like tata motors has given in past few years . So keep your eyes on it .
IDFC - 1 Year view Long Term - Needs push - IDFC is suggested alot by many youtubers so fundamentally might be strong - and technials say also that a big move will be anticipated given,

IDFC First Bank is in the great position for longIDFC First Bank is in the great position for long. If it close over the trendline in daily basis it would easily give us a target of 120 with minimal risk.
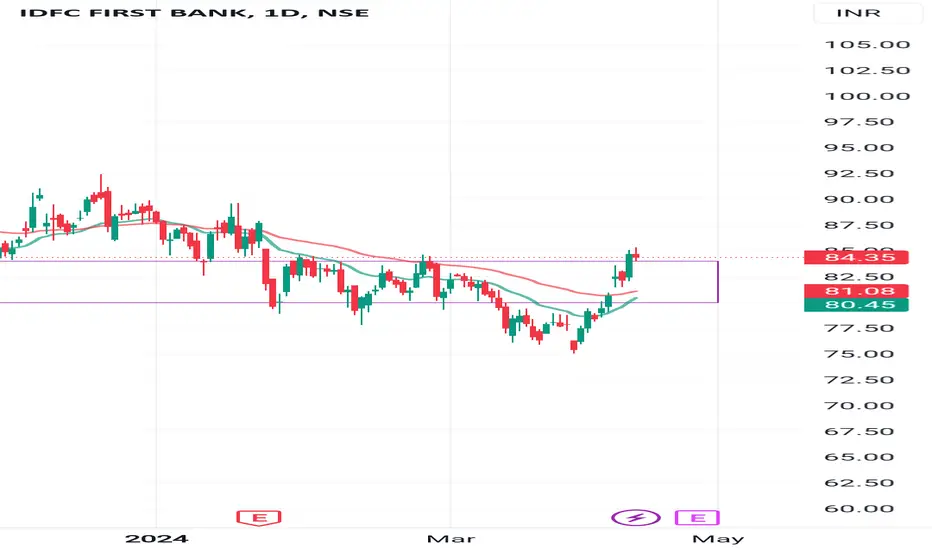
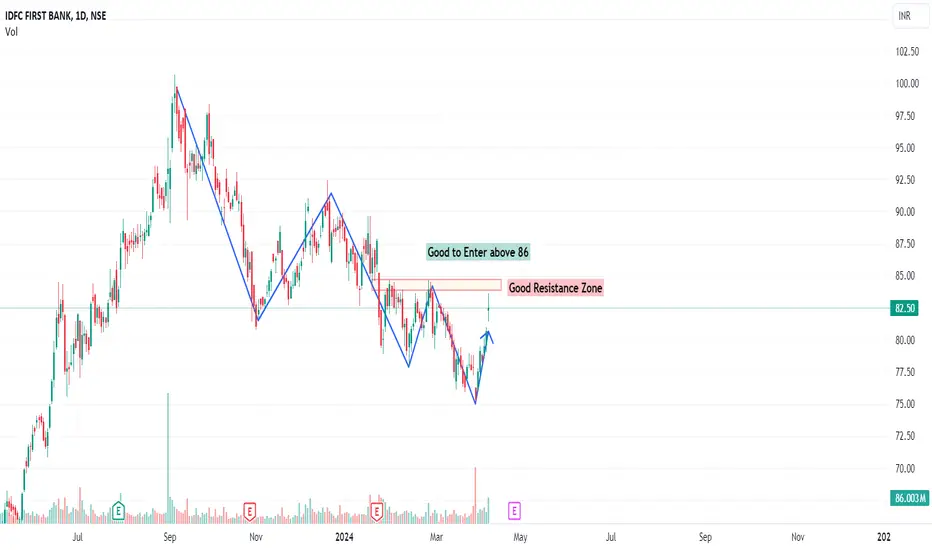
IDFC First: First choice?important horizontal resistance and trendline has been crossed which has confirmed the BO. To be doubly sure, can wait for it to stay above 84 on friday. Can be a upmove counter!
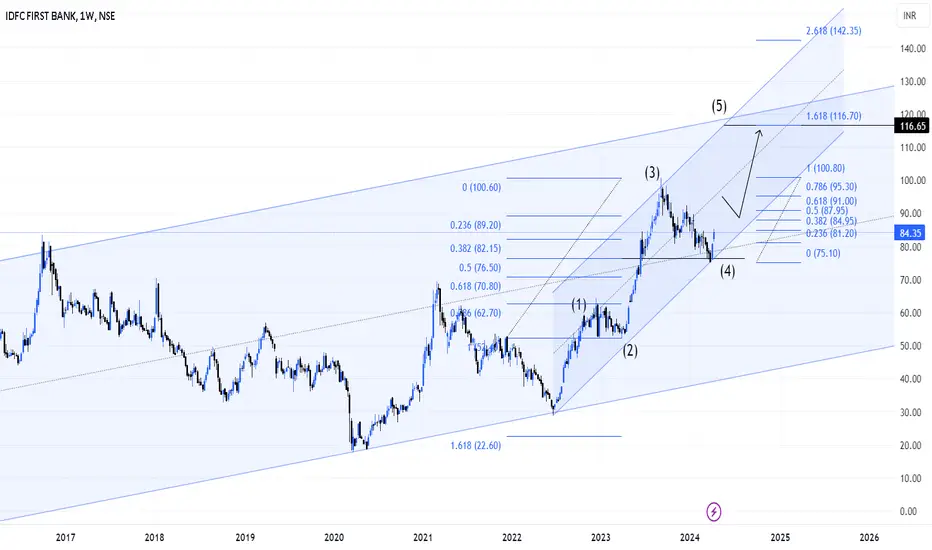
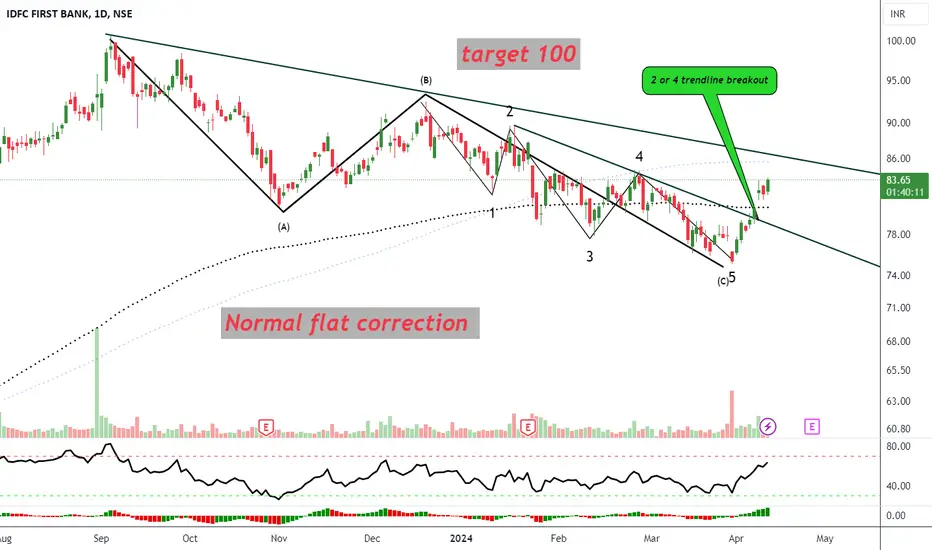
Analysis of IDFC FIRST BANK idfc first bank elliot wave analysis this stock complete .
this stock target 100
Hammer candle on weekly frame1) All time high @ 100.85
2) Range 93.55 to 96 seems to be strong selling zone with small support(acting resistance) range 86.65 to 87.95
3) Strong resistance range 81.42 to 82.55 since all time high in 2016 and breaks the level in 2023
4) Hammer of 4.5% forms in weekly frame taking long position with target of +3 points in coming week
Expectation : - If target of 3 points are achieved, we can expect further movement for range 86.65 to 87.95 range near (acting resistance)
** logic : with target being hit, price also breaks the current resistance, fi momentum persists we can see movement forming another swing so that trend can be formed **

IDFCFIRSTB - Possible BreakoutIDFCFIRSTB Possible Breakout.
CAUTION : Only Enter after if the weekly candle closes above 86 with good volume.
T1 - 100
T2 110
This is not an Investment idea Kindly do ur analysis and trade accordingly.
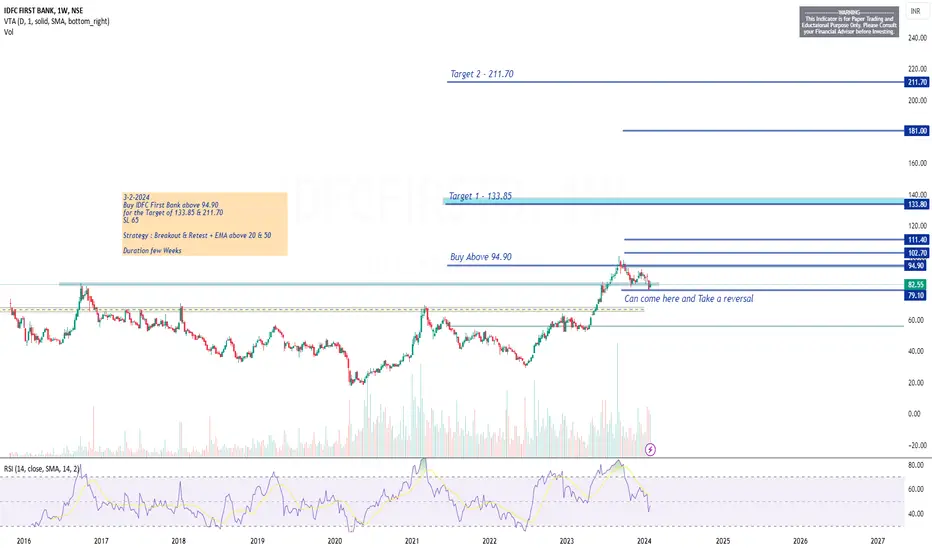
IDFC First Bank Positional3-2-2024
Buy IDFC First Bank above 94.90
for the Target of 133.85 & 211.70
SL 65
Strategy : Breakout & Retest + EMA above 20 & 50
Duration few Weeks

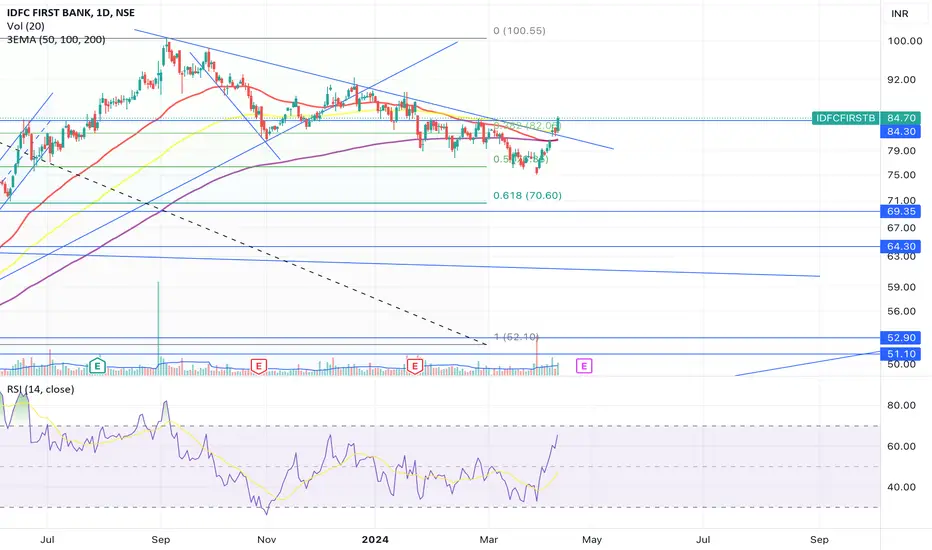
IDFC FIRST BANKIDFC FIRST BANK
We are in retesting phase of the HEAD AND SHOULDER breakout and in my view we also are in 4th wave of the retracement. If all fundamental are intact then we can expect it to double your capital in medium to long term.
Don't forget to like share comment. please.
Regards
long term invest idfc bankbreakout has been done in idfc bank
now flag pattern making
The flag pattern occurs when a trending price pauses and goes back over slightly in a rectangular range.
This pattern allows us to enter the market in the middle of a trend.
The break out in price continues its original strong trend, giving us the chance to enter that trend at a better price than before the flag's formation.
How To Identify Bullish Flag Patterns?
The chart below is an illustration of the bullish flag chart pattern.
Bullish Flag Chart Pattern
The price experiences a strong uptrend. Then it stabilizes into a rectangular range that slopes downwards.
Then there is a break out of that range, and the uptrend continues.

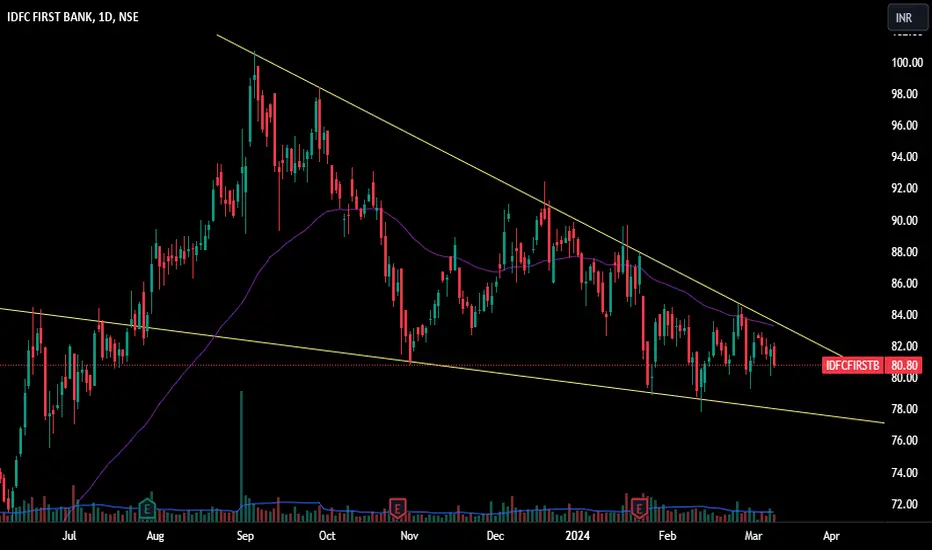
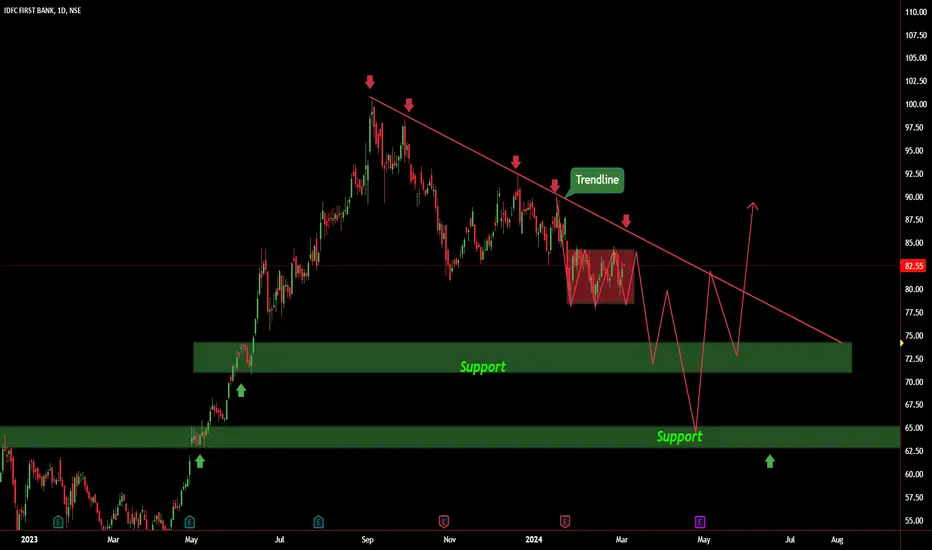
IDFCFIRSTBANK::Analysis Price is continuously falling,
facing the resistance from the trendline as well.
A drop is detected in the stock from 90 levels,
now price is in consolidation, we have a drop base drop indicating a potential bearishness in this stock.
Indicating a support at 75-72 levels zone.
back to back demand zones is lies below this support levels, keep in long side from this levels.
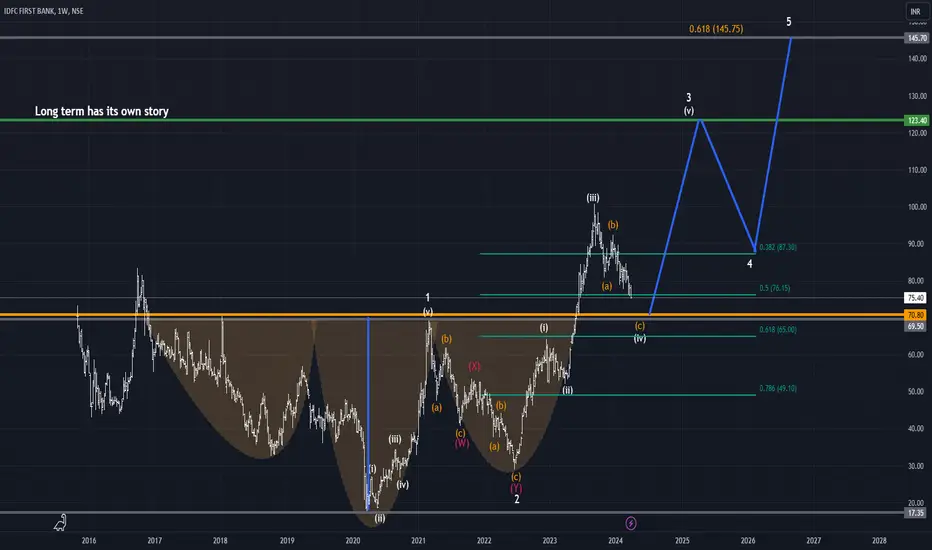
IDFCFIRSTBIDFCFIRSTB Chart Analysis 27/02/2024
Long : 74 (75%) / 64 (25%)
Sl : On closing at 60 level down
Target : 100 / 145
Enjoy !
Note : You can see these trades to double your long-term investment profits according to the Elliott Wave and chart patterns.
