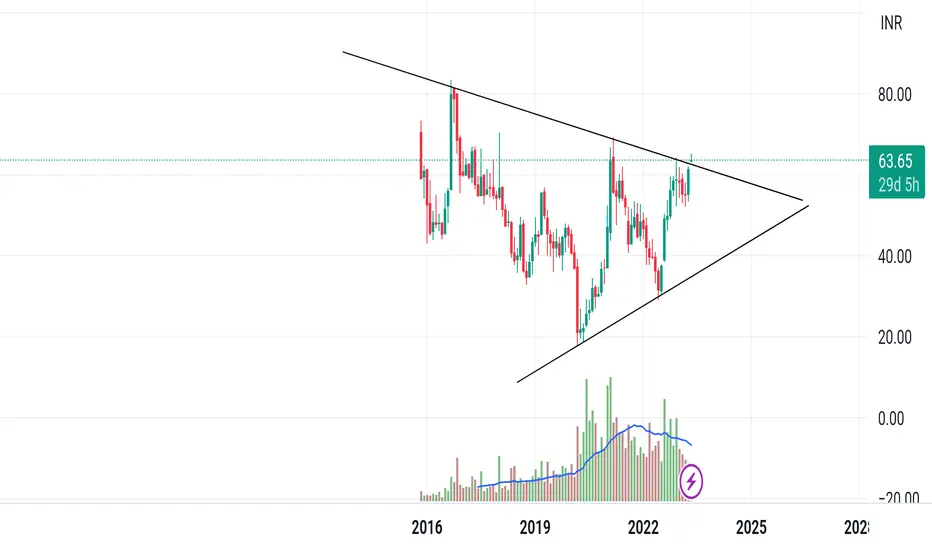
Long in idfc first bankLast time to enter in this strong fundamental stock
As you can see falling wedge pattern is created
Stock has given multi year breakout and is in the retest zone
The stock is been accumulating for last 3 months in the support zone
Smart money are accumulating this stock
For a long time
Sl 70 target 120 150 200
Falling wedge is a bullish pattern
Study this stock and movement for educational purpose
I'm not a financial advisor nor sebi registered
Please take financial advice from your advisor then only take entry accordingly
IDFCFIRSTB trade ideas
Unlocking Opportunities in IDFC First Bank: A Technical AnalysisAs a seasoned stock market wizard and dedicated blogger, I present an intriguing technical analysis of IDFC FIRST Bank (IDFCFIRSTB), a financial institution known for its robust performance and strategic growth.
In our current discussion, we will delve into the recent price action and potential entry points for investors seeking to capitalize on this promising opportunity.
At the moment, IDFCFIRSTB trades around Rs. 83 per share. Our attention is drawn to two significant lines on the chart:
Resistance Trendline:
This line, visible over the past three months, has repeatedly thwarted attempts by the stock price to breach it.
Green Support Horizontal Line:
Stable since approximately six months ago, this line provides a solid foundation for the stock price.
Despite these barriers, there exists a unique confluence of factors that could signal a shift in the stock's trajectory. Specifically, the intersection of the Fibonacci 0.5 retracement level and the long-awaited resistance line coincides at the price point of Rs. 85, forming what traders refer to as a "cluster".
Additionally, if the today daily candlestick closes near the 0.382 Fibonacci level, this would indicate a possible reversal and provide further evidence supporting an entry position.
Furthermore, the Relative Strength Index (RSI)—a popular indicator used to measure the strength or weakness of a security—has recently crossed above the resistance line after spending some time in the oversold territory. This indicates that buyers have regained control of the stock, potentially setting the stage for continued upward movement.
In conclusion, while no investment strategy is foolproof, the combination of technical indicators discussed herein suggests that IDFC FIRST Bank presents a compelling opportunity for those willing to take calculated risks. However, always remember to conduct thorough research before making any investment decisions, and never invest more than you can afford to lose. Happy investing!

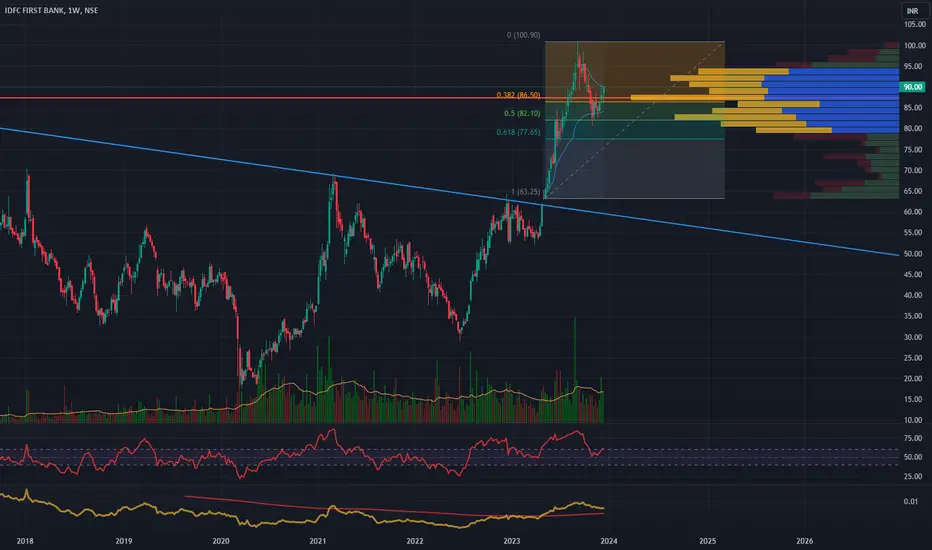
Idfc first long target 100idfc first bank elliot wave analysis weekly chart current time 4th wave complete and start 5 th wave

idfc first bank longIdfc first bank elliot wave analysis . this stock complete daily time wave A,b or C . target all time high

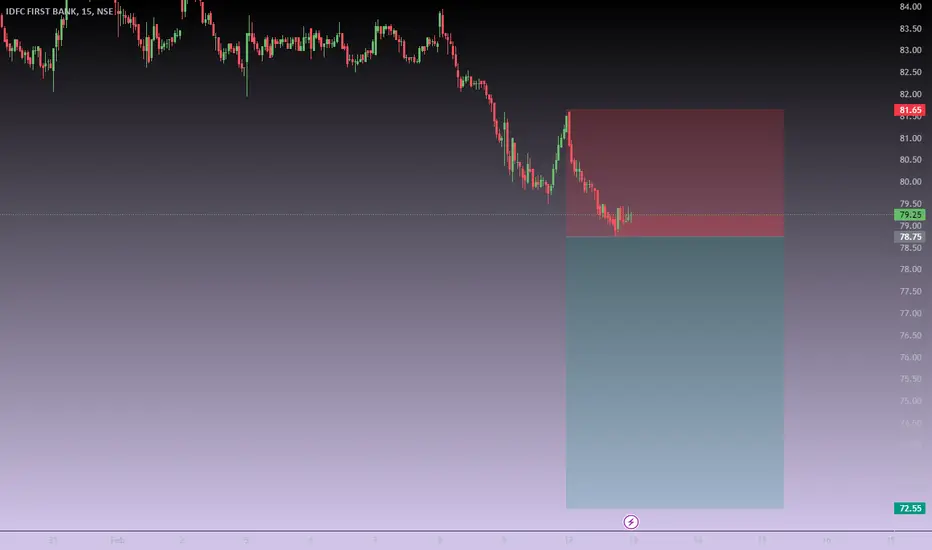
IDFC bank short following the trendTaking a short position on IDFC Bank, with a stop loss at 81.65 and a take profit level set at 72.55, reflects a carefully planned trading strategy based on technical analysis and risk management.
The decision to initiate a short position implies a bearish outlook on the stock. Traders employing this strategy anticipate a decline in the stock price and aim to profit from the potential downward movement.
Setting a stop loss at 81.65 is a risk management measure designed to limit potential losses. If the stock were to move against the short position and reach or exceed this level, the position would be automatically closed to prevent further losses. This helps traders control their risk and adhere to predefined risk tolerance levels.
On the other hand, the take profit level at 72.55 indicates a target price where the trader aims to secure profits by covering the short position. This level represents a point where the trader believes the stock will experience a significant decline, providing an opportunity to exit the position with gains.
It's crucial for traders to monitor the market closely for any signs of changing conditions that might impact the stock's movement. Factors such as market news, financial reports, or broader economic indicators can influence the stock's behavior.
Additionally, given the dynamic nature of the market, traders should stay vigilant and be prepared to adjust their strategy based on new information. Regularly reassessing the trade and considering potential adjustments to stop loss or take profit levels is advisable to align with evolving market conditions.
For educational purpose only.
IDFC First Bank LtdTarget Mentioned in chart - Stoploss @ 68
Fundamentals
Market Cap
₹ 58,644 Cr.
Current Price
₹ 83.0
52W High / Low
₹ 101 / 52.1
Stock P/E
19.4
Book Value
₹ 39.1
Dividend Yield
0.00 %
ROCE
6.59 %
ROE
10.6 %
Face Value
₹ 10.0
Promoter holding
37.4 %
EPS last year
₹ 3.75
EPS latest quarter
₹ 1.04
Debt
₹ 2,01,682 Cr.
Pledged percentage
0.00 %
Net CF
₹ -1,924 Cr.
Price to Cash Flow
16.5
Free Cash Flow
₹ 2,383 Cr.
Debt to equity
7.80
OPM last year
41.3 %
OPM 5Year
42.0 %
Reserves
₹ 19,229 Cr.
Price to book value
2.15
PEG Ratio
0.84
Price to Sales
2.06
Sales growth 3Years
11.8 %
Return on assets
1.16 %

IDFC First BankPut this Bank's Swing Trade in your Watchlist Guys!
It's Price has a Significant potential to Hit Century again ;)

IDFC FIRST BANK S/R for 29/1/24Support and Resistance Levels:
Based on the price action, you have to identify two significant levels: the red line acting as resistance and the green line acting as support. Additionally, there have marked red and green shades to represent resistance and support zones, respectively.
Support: The green line and green shade represent support levels. These levels are where the price tends to find buying interest, preventing it from falling further. Traders can consider these levels as potential buying opportunities.
Resistance: The red line and red shade represent resistance levels. These levels are where the price tends to encounter selling pressure, preventing it from rising further. Traders can consider these levels as potential selling opportunities.
Breakouts: If the price breaks above the resistance zone (red shade) convincingly, it may indicate a bullish breakout, and the price could move higher to the next resistance level. On the other hand, if the price breaks below the support zone (green shade) convincingly, it may indicate a bearish breakout, and the price could move lower to the next support level.
Keltner Channel:
The Keltner Channel is a technical indicator that uses an exponential moving average (EMA) to create an upper and lower channel around the price action. Traders can use this channel to identify potential long and short positions.
Long Position: If the price is above the upper line of the Keltner Channel, it may indicate a potential long opportunity, as it suggests the price is trading above the average range and might continue in an upward trend.
Short Position: If the price is below the lower line of the Keltner Channel, it may indicate a potential short opportunity, as it suggests the price is trading below the average range and might continue in a downward trend.


IDFC First Bank - Ready for Bull RallyAs per technical analysis and chart pattern, this stock is ready for a ride to the moon. All points are mentioned on the chart and you can plan your buy entry here.
Do your own research before entering into buy trade as I am not suggesting you to buy this stock and this is my personal analysis and opinion.
I am not SEBI fregistered
Thanks for your support as always

IDFC First Bank IDFC First Bank (1D)
CMP 82.85
Created a Flag & Pole Pattern
Trying to give breakout of it
Breakout awaited
Swing Trade in IDFC FIRST BANKTechnical Analysis:
In 1Day TF, we can see the contraction with low Volume
In recent days we can see institutional buying once target got hit.
Fundamentals:
Foreign Portfolio Investors 23.32%
--------------------------------------------------------------------------------------
Major Shareholders
dfc Financial Holding Company Limited 37.51%
Odyssey 44 A S 3.83%
President Of India 3.71%
Cloverdell Investment Ltd 2.74%
Goldman Sachs Trust Ii - Goldman Sachs Gqg Partner 1.88%
Icici Prudential Life Insurance Company Limited 1.39%
--------------------------------------------------------------------------------------
Annual 2023 2022 2021
Sales (Cr) 27,194.51 20,394.72 18,221.56
Net Income (Cr) 2,437.13 145.49 452.28
---------------------------------------------------------------------------------------
EPS Growth Rate 16%
Earnings Stability 99
P/E Ratio 19
5-Year P/E Range 16-230
Return on Equity 10%
Cash Flow (INR) 5.44
----------------------------------------------------------------------------------------
Estimates
Idfc First Bank has been covered by 5 analysts in the last 6 months. Their average twelve-month price target is Rs. 94.18, suggesting that the stock has a possible upside of 6.48%. The high price target for Idfc First Bank is Rs. 101.9 and the low price target is Rs. 85. There are currently 1 Buy rating, 3 Hold ratings, 1 Sell rating.

BankIDFC AT support after making a new high since its ipo. consolidating here to make a move higher, technicalls looking good.

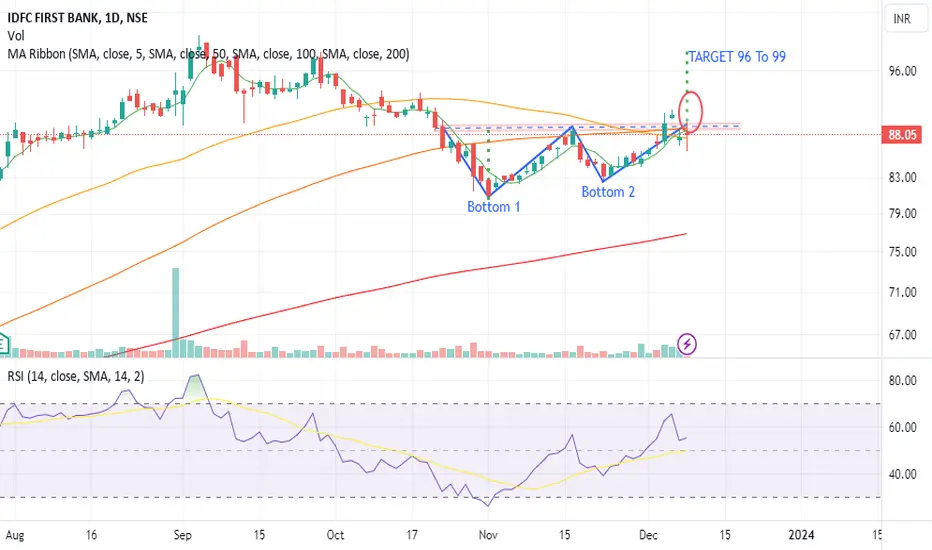
Double Bottom In IDFCFIRST BankDouble bottom pattern was formed in Daily chart of IDFC FIRTS Bank, wait for the the Neckline breakout on closing basis (@above 89.5). upon confirmation of neckline breakout the next possible target's are at 96.
Disclaimer: This written/visual material is comprised of personal opinions and ideas. The content should not be construed as containing any type of investment advice and/or a solicitation for any transactions. It does not imply an obligation to purchase investment services, nor does it guarantee or predict future performance
IDFC FIRST BANK WEEKLY CHARTAfter making a new high, Idfc first bank retraced around 50%. There is a postive hidden bullish divergence in weekly chart. With awap squeeze breakout price is expected to move up.
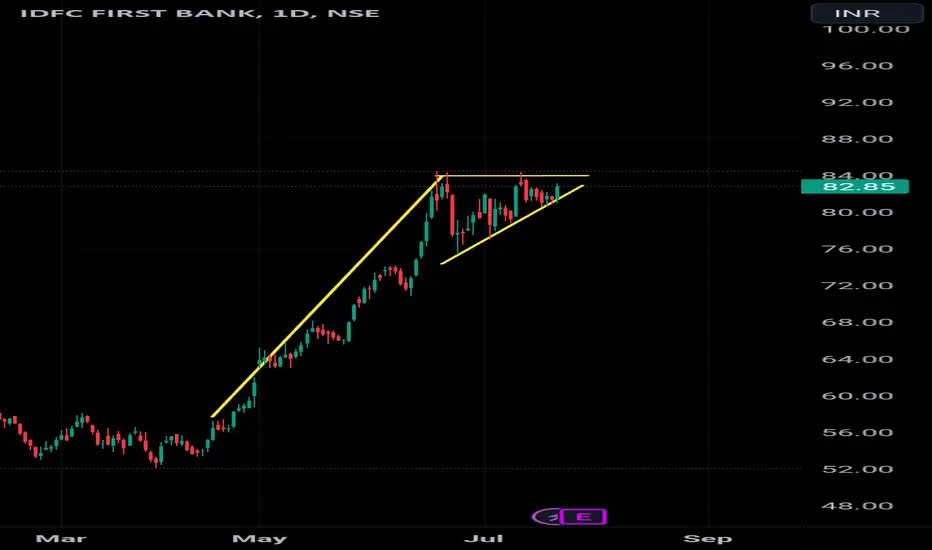
IDFCFIRSTB FLAG AND POLEIdfc first bank flag and pole break out for positional and swing trades.
Buy above trend line with frst Target at
96-100 (for swing)
Around 150 for positional

IDFCFIRSTBNSE:IDFCFIRSTB
Long term buy can buy on deep
Support Place at 86
Sl- 80
Rsi>53
Volume is also good
Moving Ave is supporting Buy
Long term(1 year ) Target- 112

IDFC BANK Analysis I am IDFC Bank in weekly Timeframe. My minimum Target is 1:1 and after using trailing Stoploss.

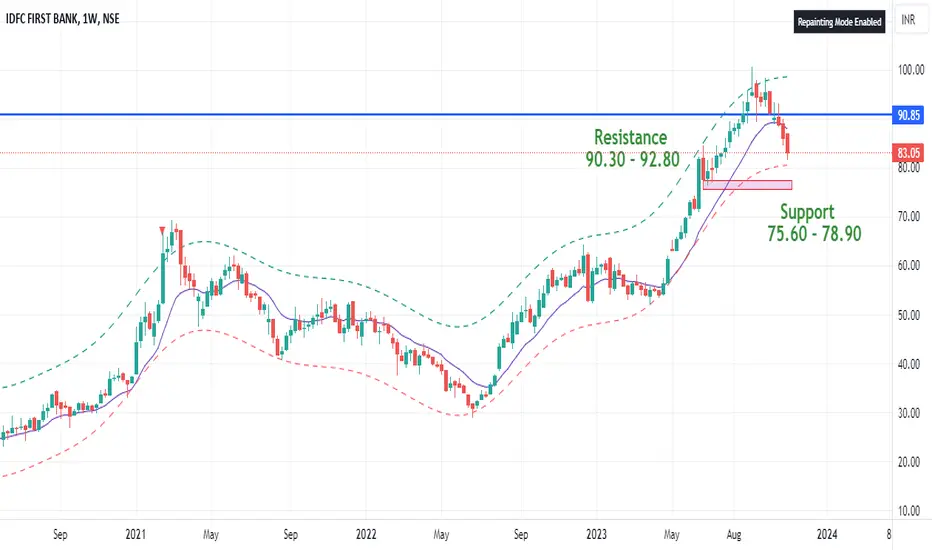
IDFCFIRSTBANK Q2 Result view cmp 83.10support at 75.60 - 78.90
resistance 90.30 - 92.80
Q2 Result view - can move up 8% - 10% cmp 83.1
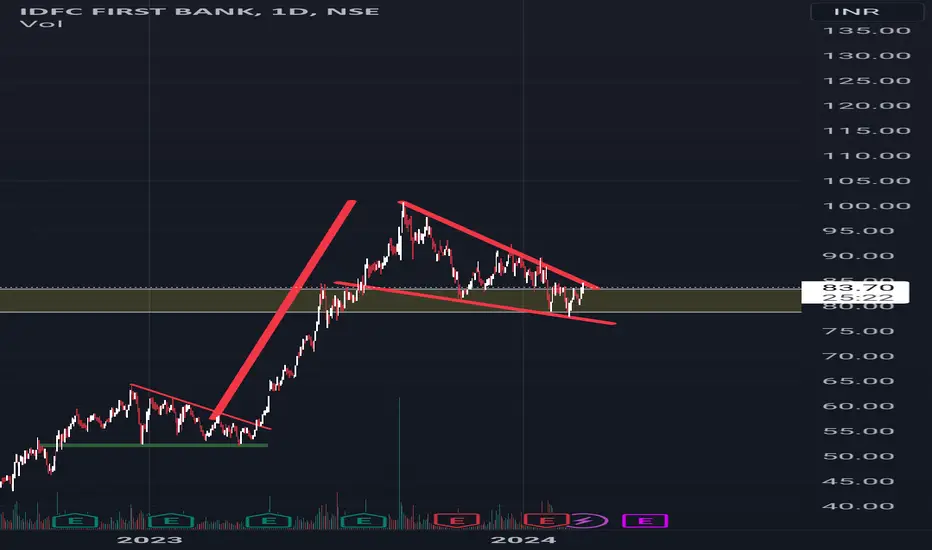
IDFCFIRSTBChart looks very positive, it broke major resistance in the monthly chart and retested the support line and moving towards north,
it is a good risk to reward stock, it can be a investment or positional trade call.
wait for the stock to cool down little bit and buy accordingly for big returns vs limited risk.

idfcirstb looking goodchart make an w pattern . price near breakout ,volume are continue increasing,

BreakoutBy analyzing technically,
I able to know that there is a breakout of resistance and also a decending triangle pattern that also breaks.
Target will be 93, 99
Sl 86

Idfc first bank Idfc first bank is breaking is monthly triangle pattern and also good stocks for long term at this leval very good risk reward ratio for buy