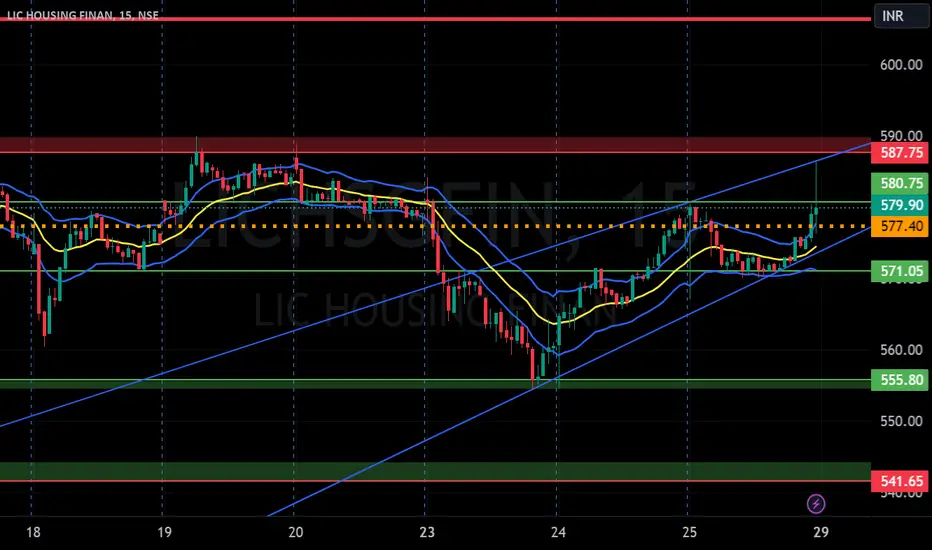
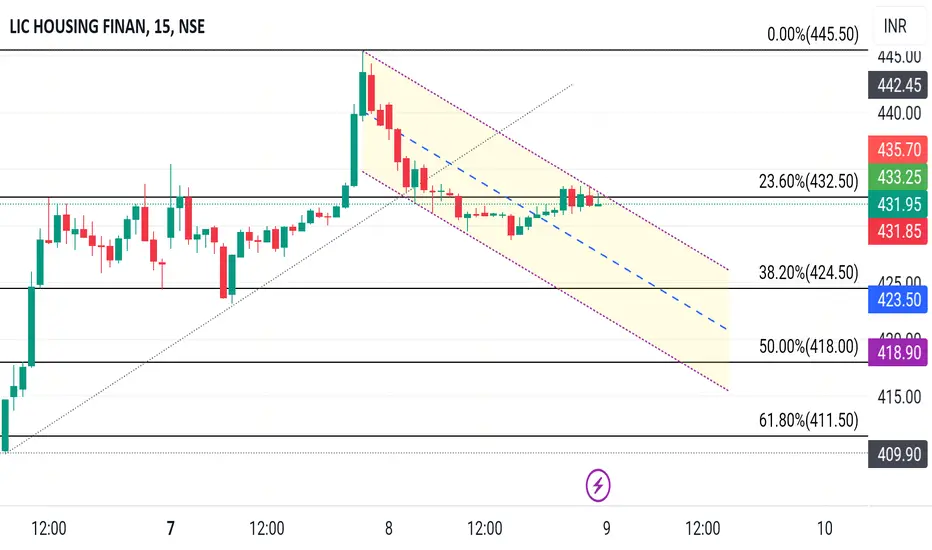
LIC HOUSING FINANCE S/R for 29/1/24Support and Resistance Levels:
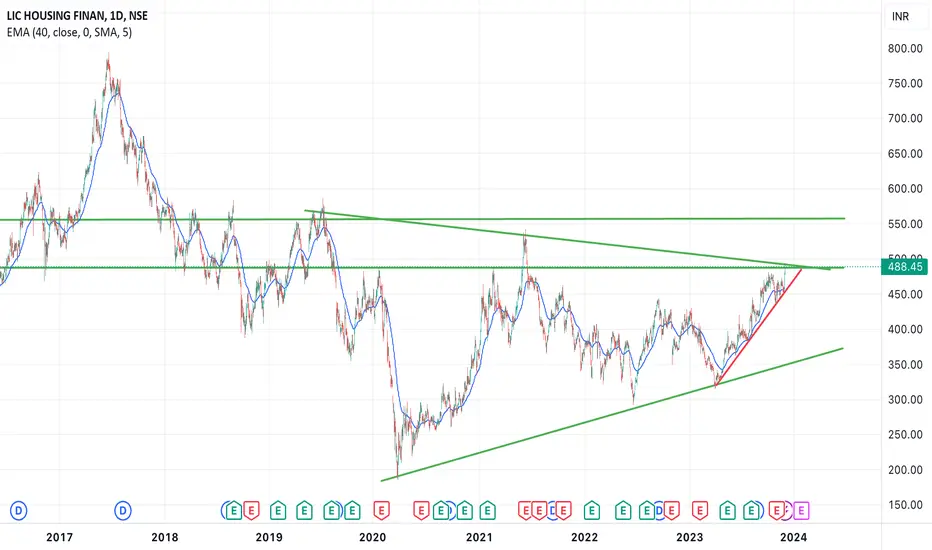
Based on the price action, you have to identify two significant levels: the red line acting as resistance and the green line acting as support. Additionally, there have marked red and green shades to represent resistance and support zones, respectively.
Support: The green line and green shade represent support levels. These levels are where the price tends to find buying interest, preventing it from falling further. Traders can consider these levels as potential buying opportunities.
Resistance: The red line and red shade represent resistance levels. These levels are where the price tends to encounter selling pressure, preventing it from rising further. Traders can consider these levels as potential selling opportunities.
Breakouts: If the price breaks above the resistance zone (red shade) convincingly, it may indicate a bullish breakout, and the price could move higher to the next resistance level. On the other hand, if the price breaks below the support zone (green shade) convincingly, it may indicate a bearish breakout, and the price could move lower to the next support level.
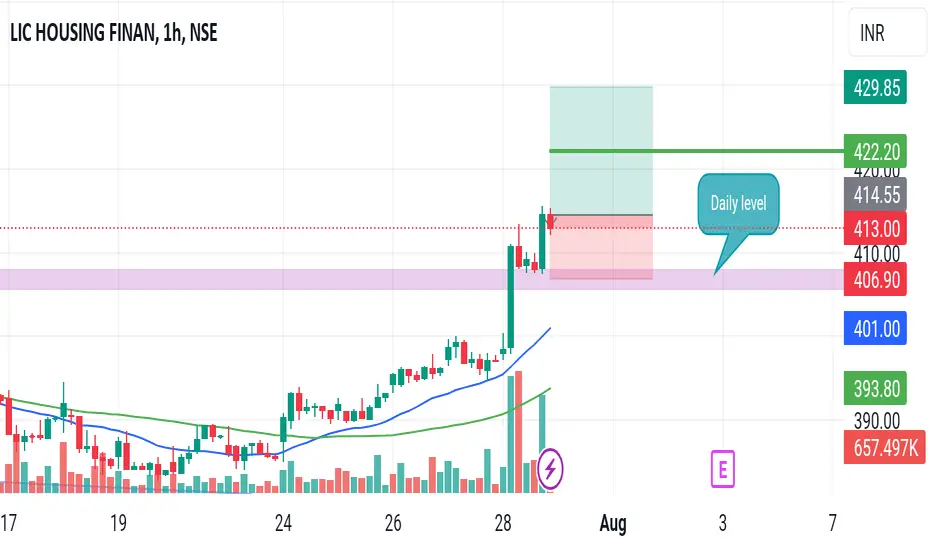
Keltner Channel:
The Keltner Channel is a technical indicator that uses an exponential moving average (EMA) to create an upper and lower channel around the price action. Traders can use this channel to identify potential long and short positions.
Long Position: If the price is above the upper line of the Keltner Channel, it may indicate a potential long opportunity, as it suggests the price is trading above the average range and might continue in an upward trend.
Short Position: If the price is below the lower line of the Keltner Channel, it may indicate a potential short opportunity, as it suggests the price is trading below the average range and might continue in a downward trend.
LICHSGFIN trade ideas
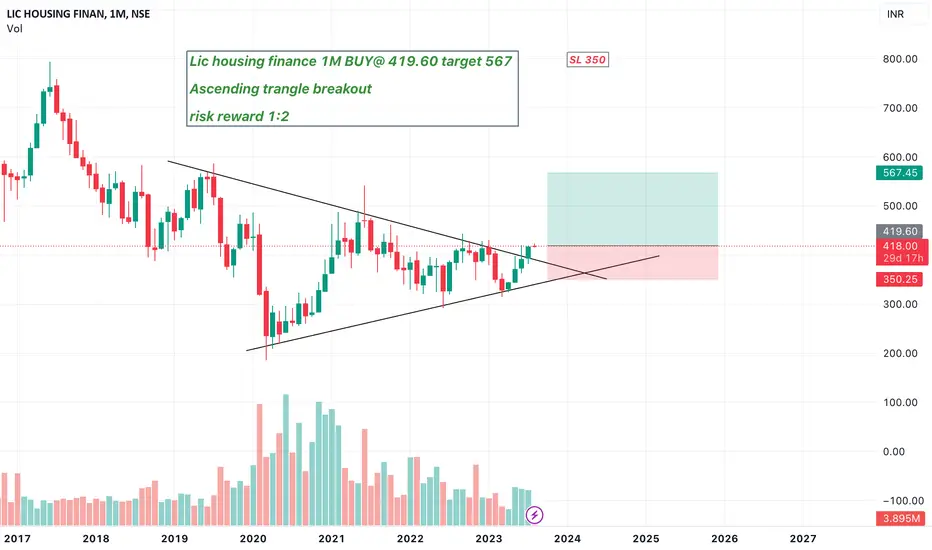
Lic housing finance 1M BUY@ 419.60 target 567 Lic housing finance 1M BUY@ 419.60 target 567
Ascending trangle breakout
risk reward 1:2
sl@350
LICHSFINNSE:LICHSGFIN
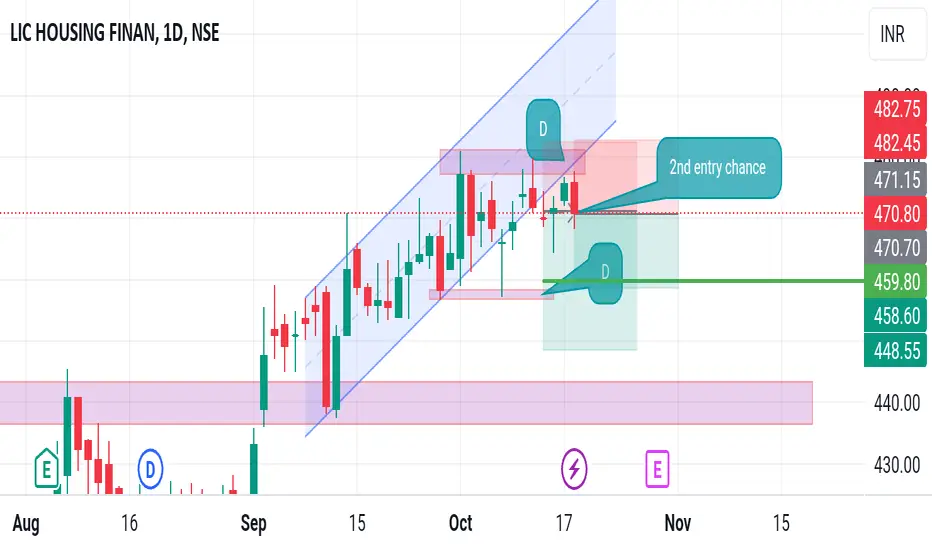
One Can Enter Now !
Or Wait for Retest of the Trendline (BO) !
Or wait For better R:R ratio !
Note :
1.One Can Go long with a Strict SL below the Trendline or Swing Low.
2. R:R ratio should be 1 :2 minimum
3. Plan as per your RISK appetite and Money Management.
Disclaimer : You are responsible for your Profits and loss, Shared for Educational purpose
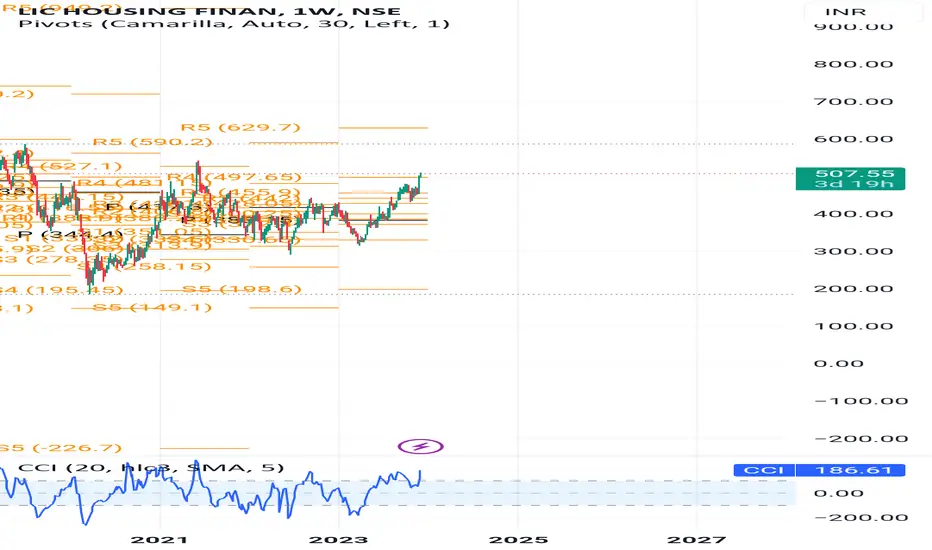
💥LIC Housing Finance💥-Nice Breakout💥LIC Housing Finance💥-Nice Breakout
Capital to be deployed- 20k
Investing Price-500-505
Breakout Price-497
Stoploss-442
Targets-629
RT for max reach
#LIC #stockstowatch #StocksToBuy #StocksInFocus #stocks #StockMarket
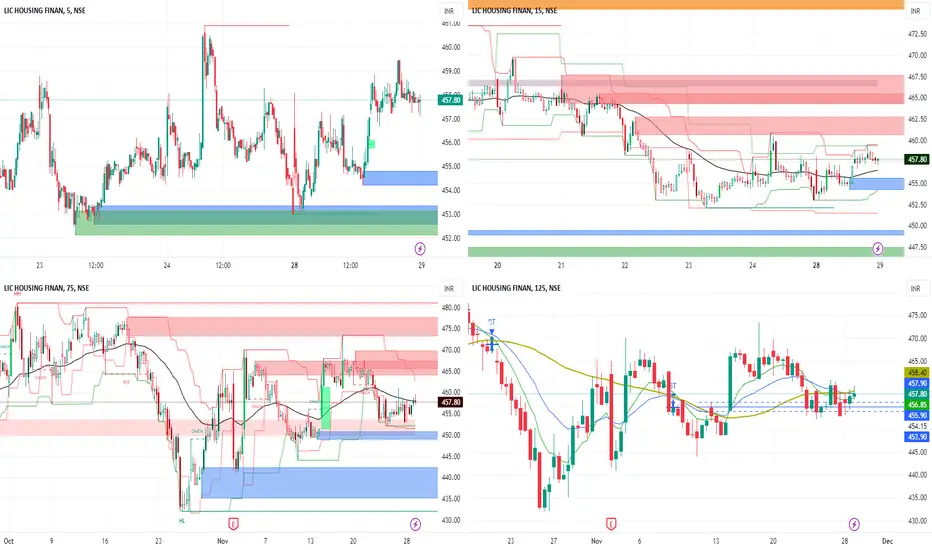
LIC housing finance trade setup 29th November, 2023We are expecting a quieter move in Lic Housing Finance which is trading at 458. We have shown lic housing at 5 15 75 and 125 minute.
We are expecting that above 460 level closing with with confirmation closing We can see high levels We are expecting to see 465 470 481 491 and 505 plus levels in coming days So one can set stop loss at 448 Level.
disclaimer: these levels are just for informational and educational purpose only, Please do your own research before taking any position.
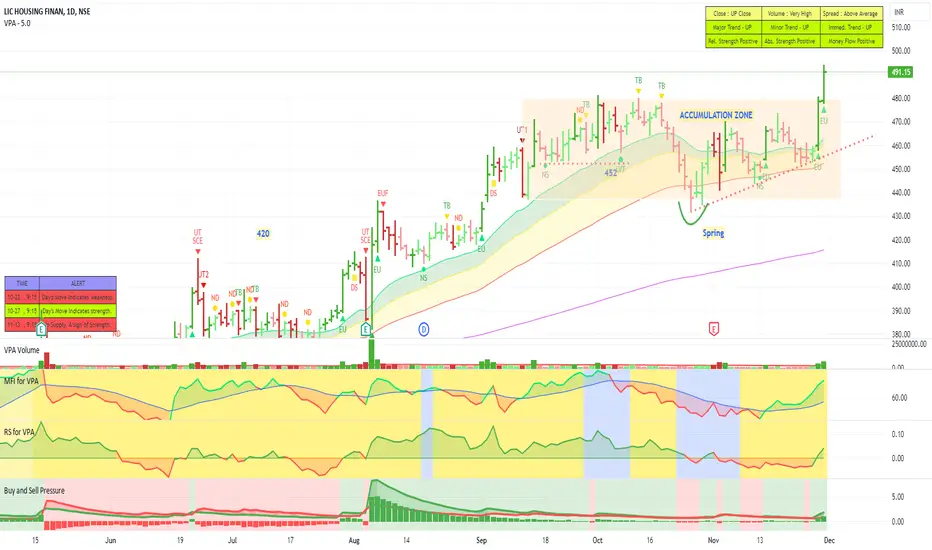
LICHSGFINThe stock is moving out of a long accumulation zone. After a spring just below the 50 DMA the stock recovered and now moved past the accumulation zone. Volume Support also coming in. Relative strength, Money flow and Buying pressure all positive and rising. Increased delivery volumes also adds to the strength. The stock looks poised to go much higher and test 540 levels
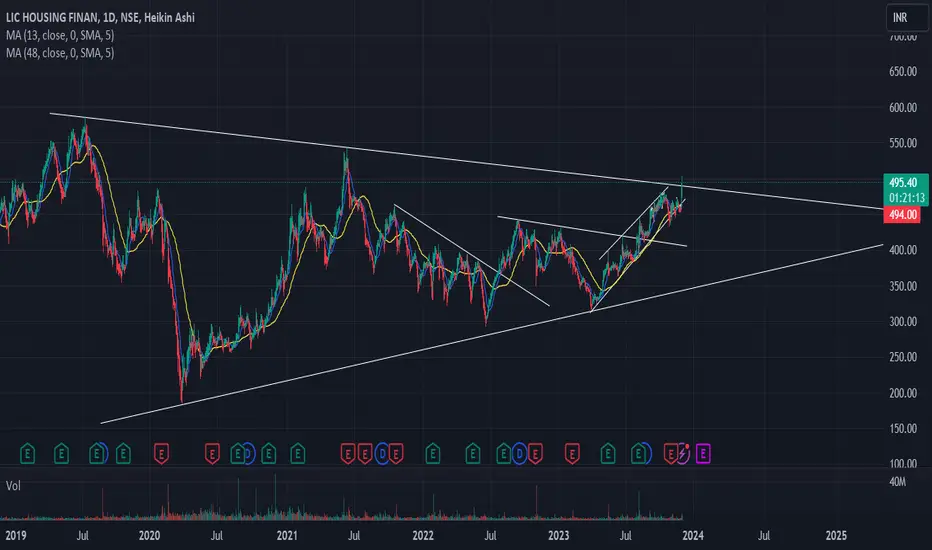
LIC housing finance - bullish tradetechnically looking good, potential to touch 540-550 levels, one can use closing below trend line or below 450 as a stop loss.
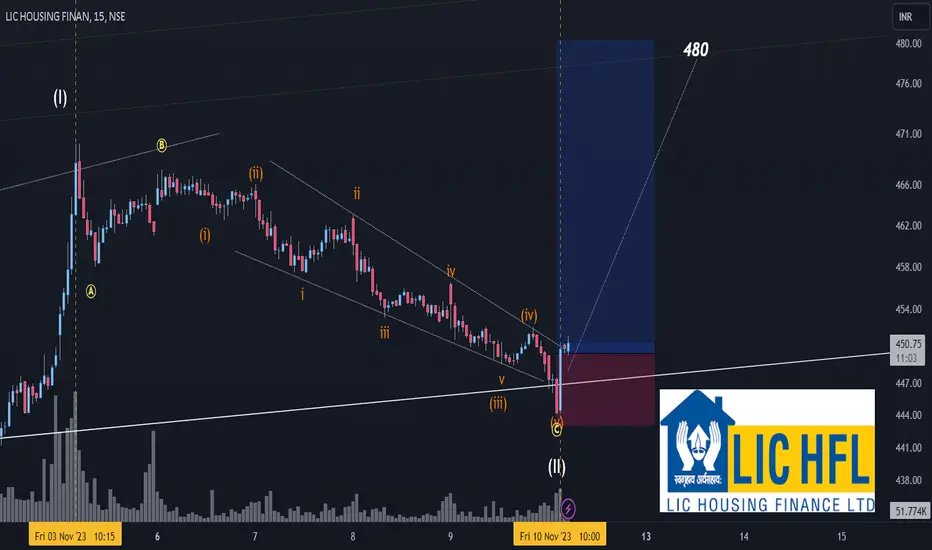
TRADE SETUP_LICHOUSINGFINI had posted a daily chart of LIC HSG yesterday showing how it should begin a wave 5 move towards 500 soon. Please refer to that chart to get a better understanding of this one.
This chart only shows the correction of wave i of 5 coming to an end.
A dip below 450 was strongly recovered intraday today.
the reversal price of 444 can be used as SL to make an entry .
CMP - 450
SL 444
Target 480
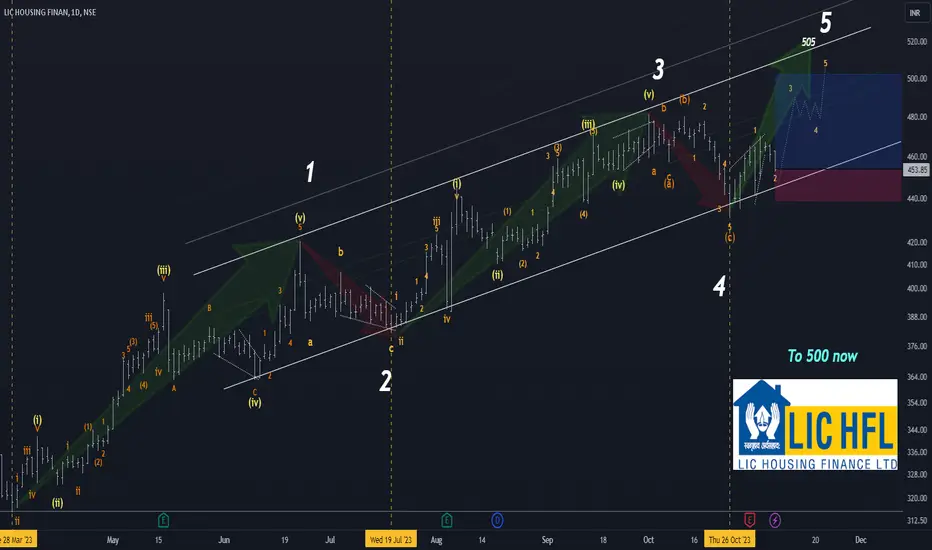
TRADE SETUP_LIC HOUSINGFIN_10% upsideThe stock was seen rising in march 2023 in wave 1 all the way till June 2023. The retracement to this wave came in next 1month through the month of July.
Then from July till late September the stock was seen advancing up in wave 3.It spend the month of October subsequently in wave 4 corrective phase and now towards the year end, the stock is ready for wave 5 take off and can move towards 500 mark in November-December.
It should be noted that since the wave 3 was shorter than wave 1 it should be presumed that wave 5 will be the shortest and therefore a modest target of 500 is projected for this stock.
The stock is currently near a strong support area of 450.
440 can be used as a SL.
Please note the wave counts have been studied and marked on a 3hour chart.
Note*- Views expressed here are my personal observations/opinions. Always do your own analysis/research before taking up any financial position.
Lic Housing Finance I Buy Lic Housing Finance stock at Daily Timeframe. And minimum Target is 1:1 & after using trailing Stoploss.

LIC HOUSING--STRONG BUYOn breakout of 480 and breakout of cu and handle and inverse head and shoulder pattern i have a target of 580 first and 690 second target looking very bullish and is expected to post excellent result.
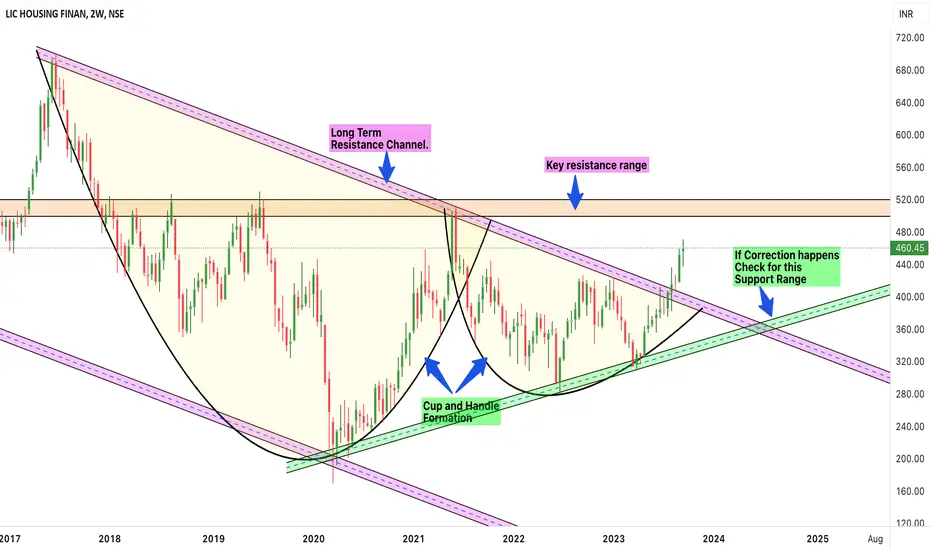
Check For breakout and resistance from topThe stock had given the break out from Cup and handle formation. However immediately there are some hurdles. Needs to break through it.
Failing to do so will force for consolidation.
Green range extremely important if corrections happens due to any reason.
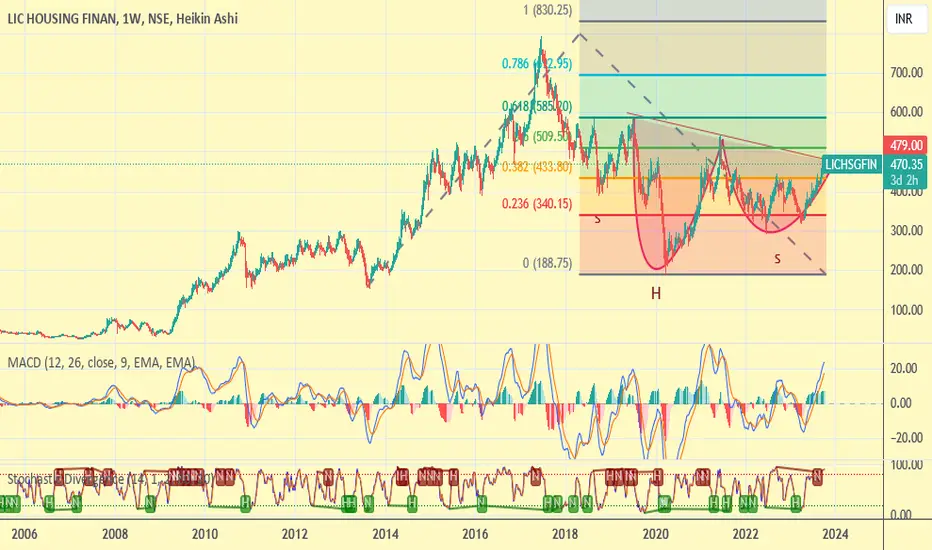
LICHSGFIN - Weekly Harmonics patternIn WTF,
=> AC<1 which indicates a bat pattern target of 0.886 level.

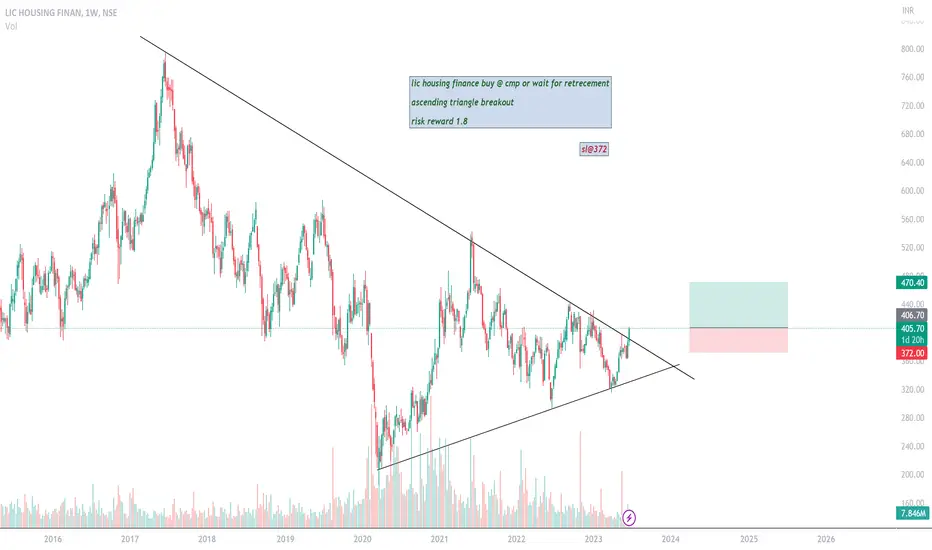
lic housing finance buy @ cmp or wait for retrecement ascendinglic housing finance buy @ cmp or wait for retrecement
ascending triangle breakout
risk reward 1.8
sl@372
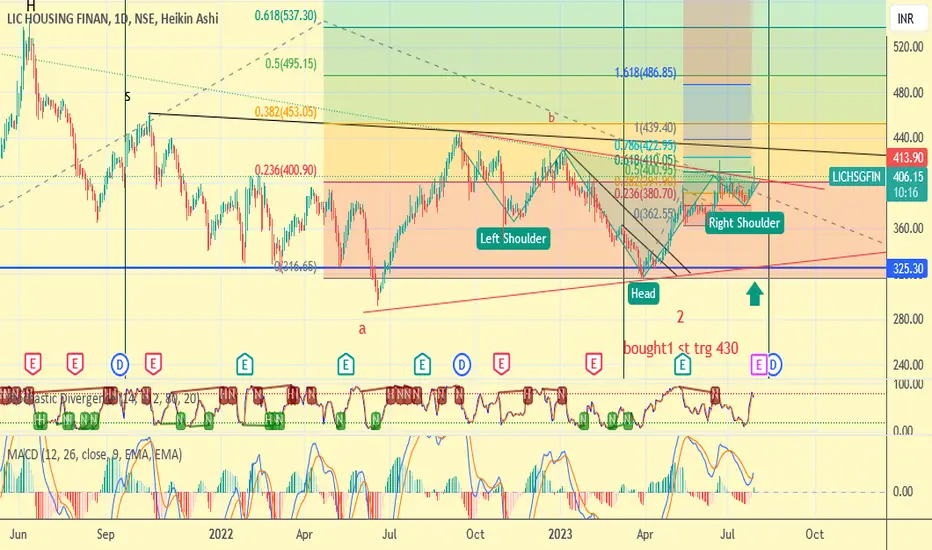
LIC housing after breakout of 430 range and ex-dividend of rs 8.50, head and shoulder pattern observed, first trg of 3rd wave 480 and 2nd trg of 560.

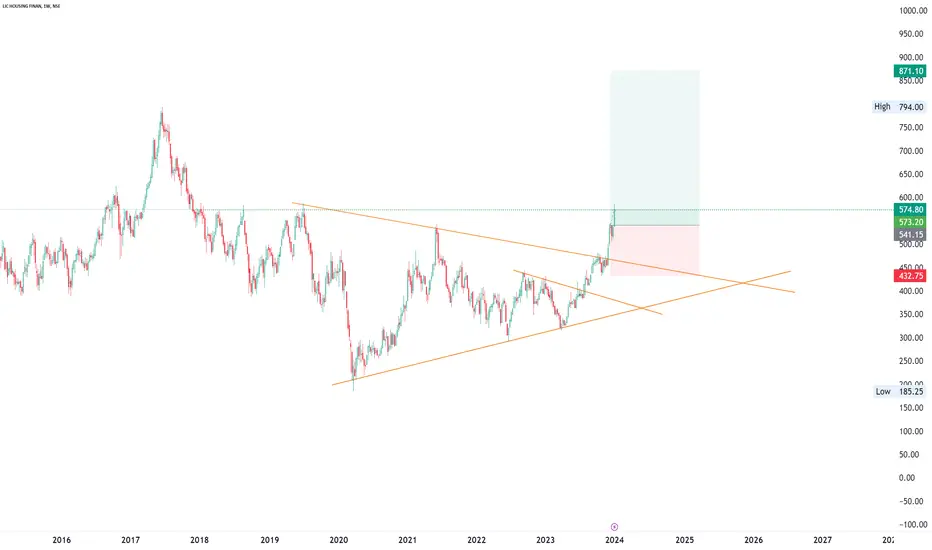
BREAKOUT IN LIC HOUSING FINANCEBreakout of ascending triangle pattern has been done on LIC HOUSING FINANCE and what I'm looking for is the retest to take it to the upside.
TP1 - 440.90
TP2 - 460
TP3 - 475

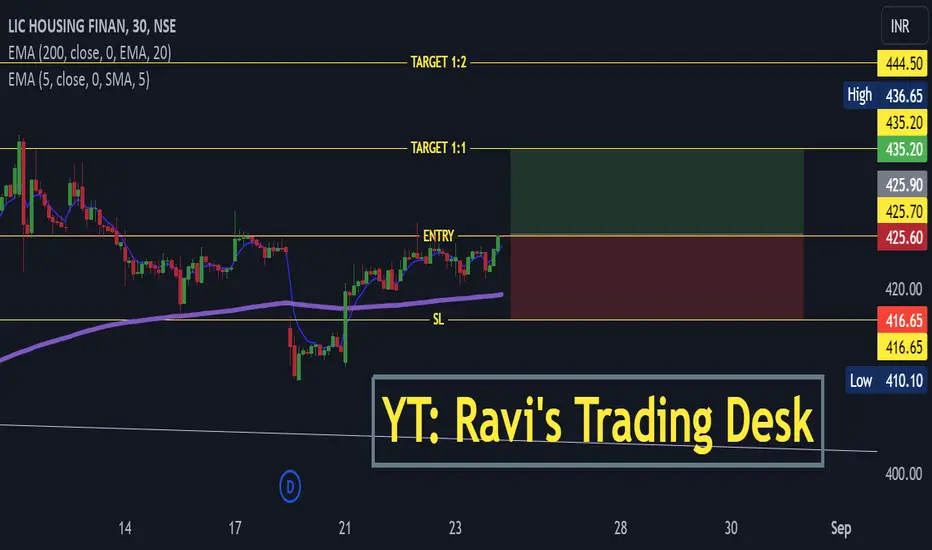
LICHSGFIN Short term Swing but OpportunityRefer the chart for Entry,Target and SL.
NOTE: This trade is only for Equity Swing buy and not to be considered for options trading.
Please do follow Position Sizing and Risk Reward Ratio while planning any trades.
Note: This information is for education purpose only and please do your own research and consult your financial advisor prior to taking any action.
TO CONNECT WITH ME CHECK OUT MY BIO.
If you like this Idea, Please do like my ideas and share it with your friends. check my bio.
Please boost my ideas and send cheers as it acts as a motivation to keep posting my analysis.
Thank you
Lic housing Finance technical analysis. Trade idea 9aug23Lic housing Finance technical analysis. Trade idea 9aug23
LIC housing --breakoutafter forming inverse Head and shoulder pattern share broke out of trend line looking for minimum 460, 540 trg