#LTF - 25 Points move expected?Date: 08-07-2025
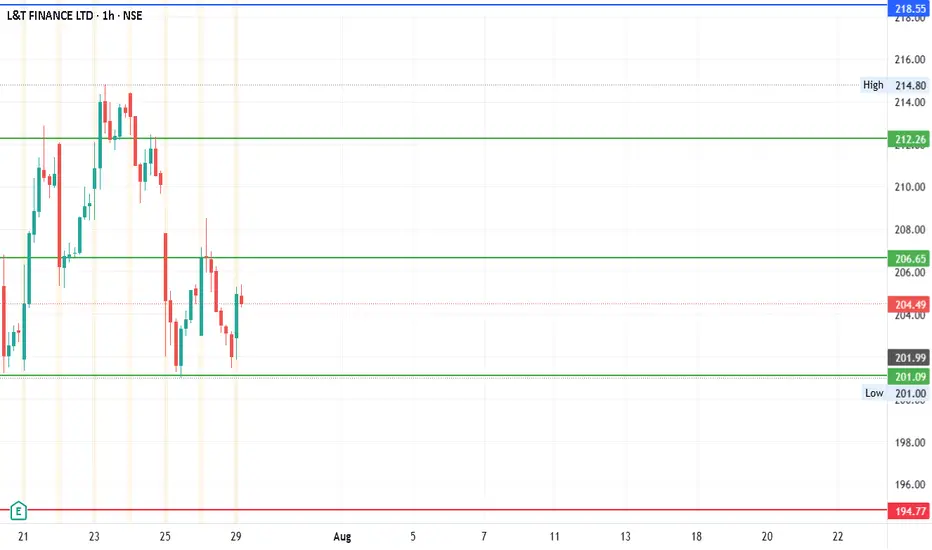
LTFinance Current Price: 205.3
Pivot Point: 206.65 Support: 201.09 Resistance: 212.25
Upside Targets:
Target 1: 218.55
Target 2: 224.85
Target 3: 231.67
Target 4: 238.50
Downside Targets:
Target 1: 194.77
Target 2: 188.45
Target 3: 181.62
Target 4: 174.80
#TradingView #Stocks #Equities #StockMarket #Investing #Trading #Nifty
#TechnicalAnalysis #StockCharts #Finance
LTF trade ideas
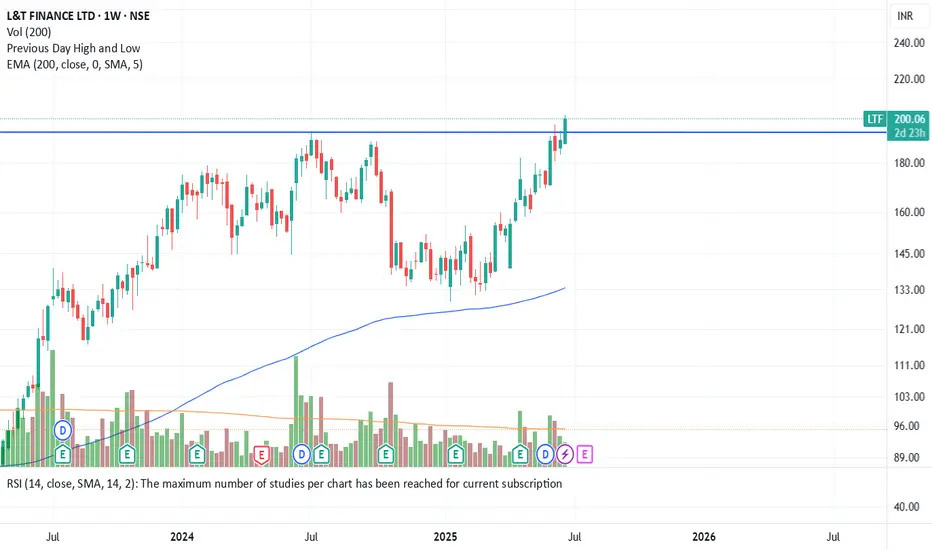
L&T Finance : Made a new High after a buy signal ,3 Months Time L&T Finance : Made a new High after a buy signal . Cleared the previous resistance of 198.90.
3 months Time Frame .
( Not a Buy / Sell Recommendation
Do your own due diligence ,Market is subject to risks, This is my own view and for learning only .)
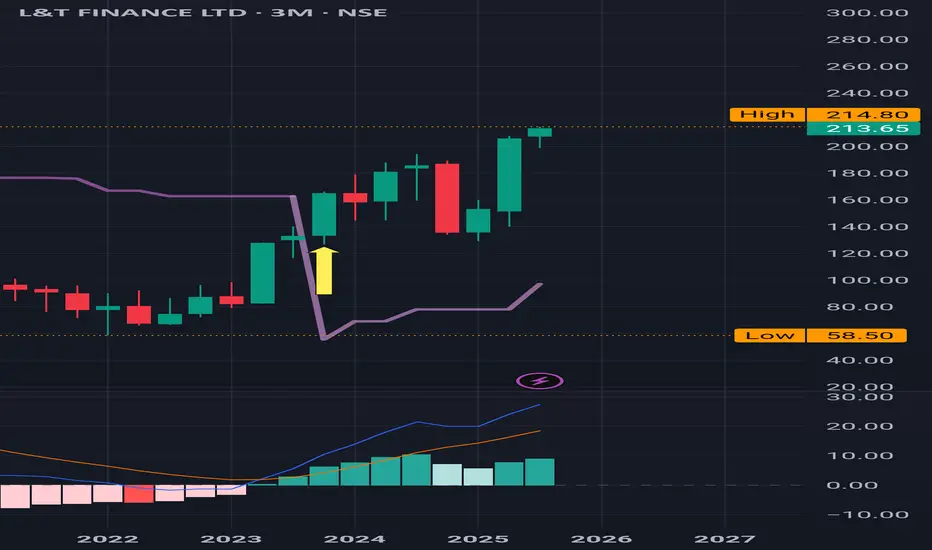
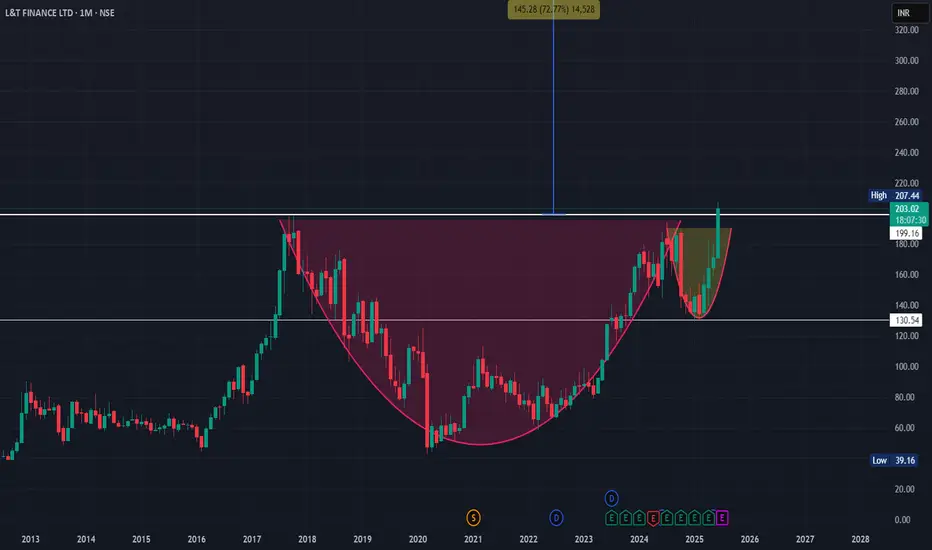
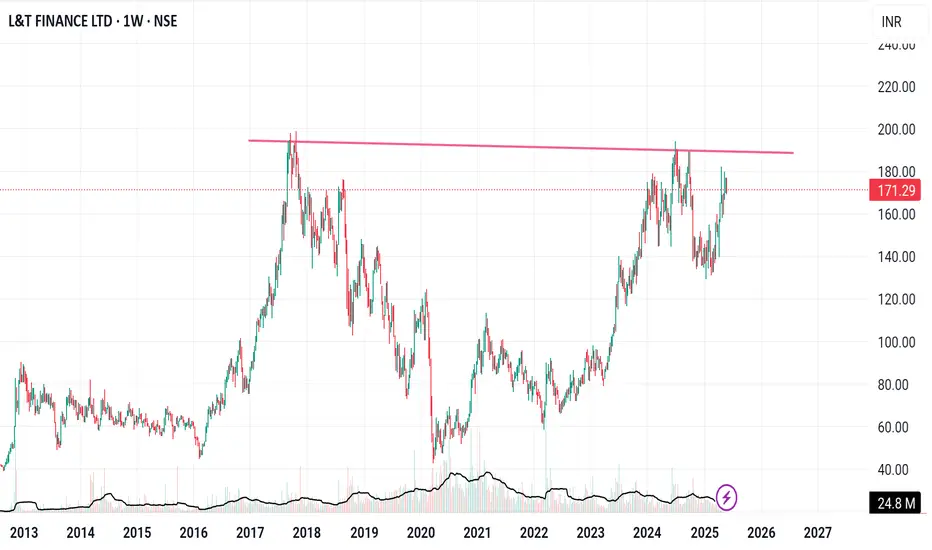
L&T Finance – Cup & Handle Breakout After 8 Years!L&T Finance has finally broken out of a classic Cup and Handle pattern, reclaiming its 2017 all-time high after nearly 8 years of consolidation. Strong volume confirmation adds weight to this long-term bullish breakout. A must-watch for positional traders and investors looking for momentum in the NBFC space!

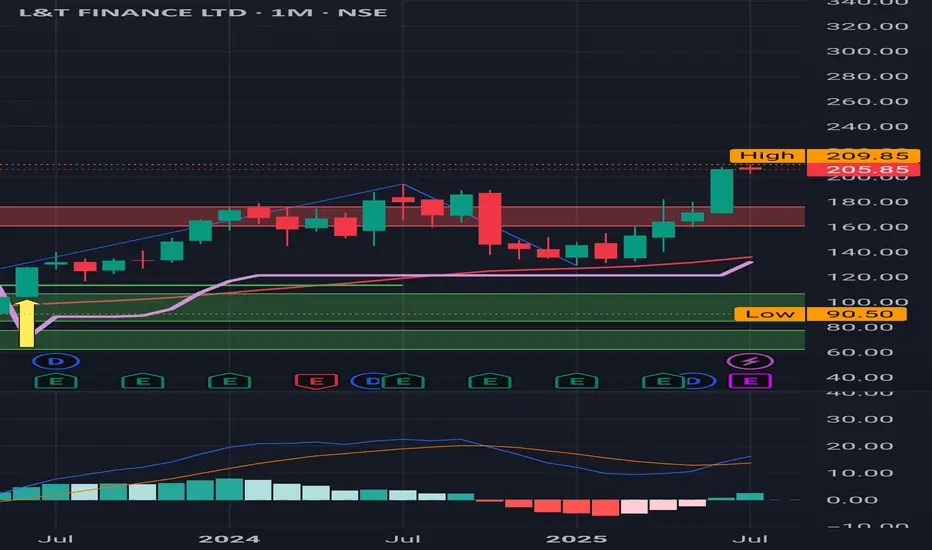
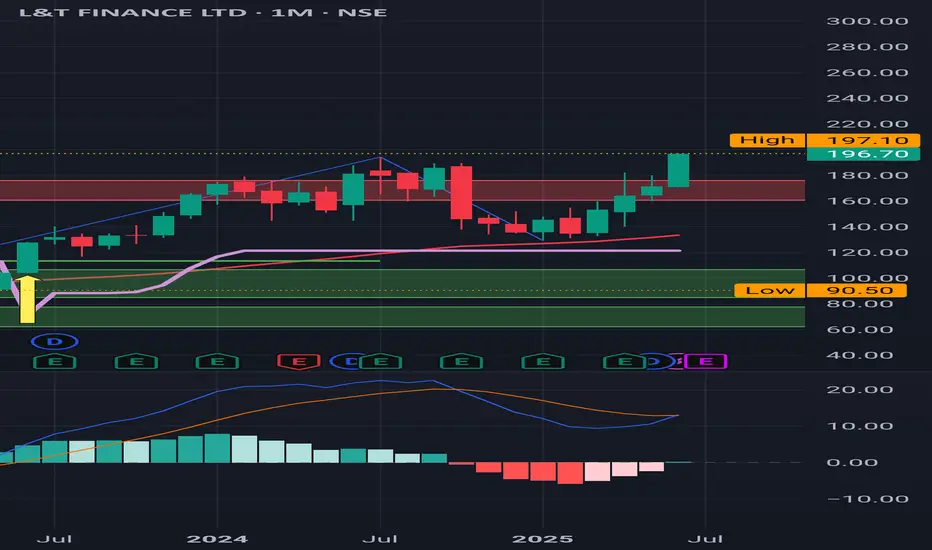
L&T Finance : Monthly Time Frame , cleared the Red Band L&T Finance : Monthly Time Frame , cleared the Red Band Resistance at around 175 .
It's in a Buy trajectory on a daily time frame.
( Not a Buy / Sell Recommendation
Do your own due diligence ,Market is subject to risks, This is my own view and for learning only .)
[LTF] Long TermHi there,
LTF is looking good for long term only if monthly candle closes above the ATH. Breakout of Cup and Handle is a strong uptrend.
This is only for educational purpose, pls consult your financial advisor before investing.
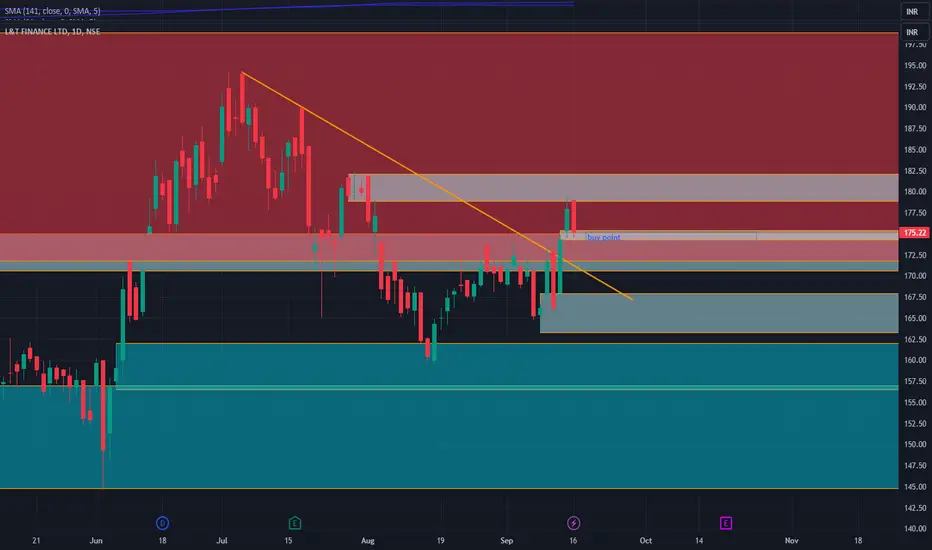
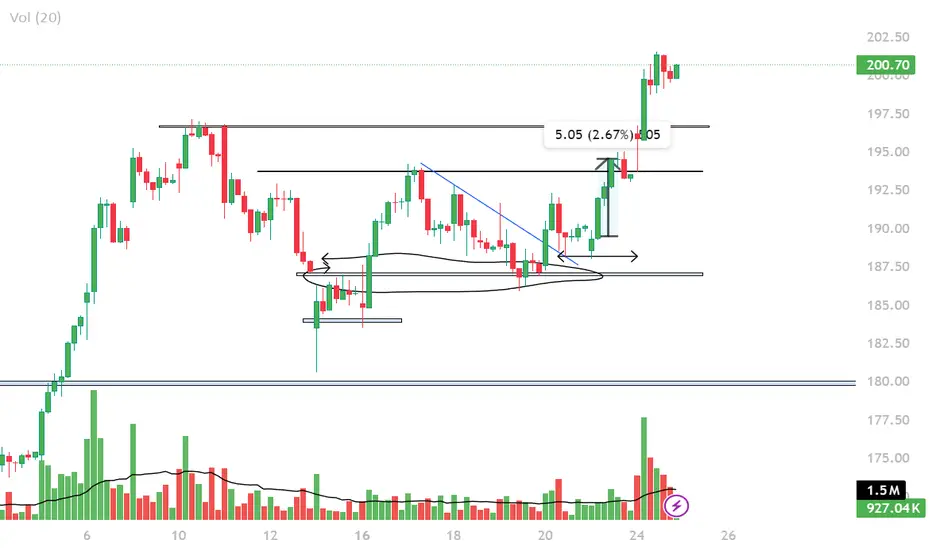
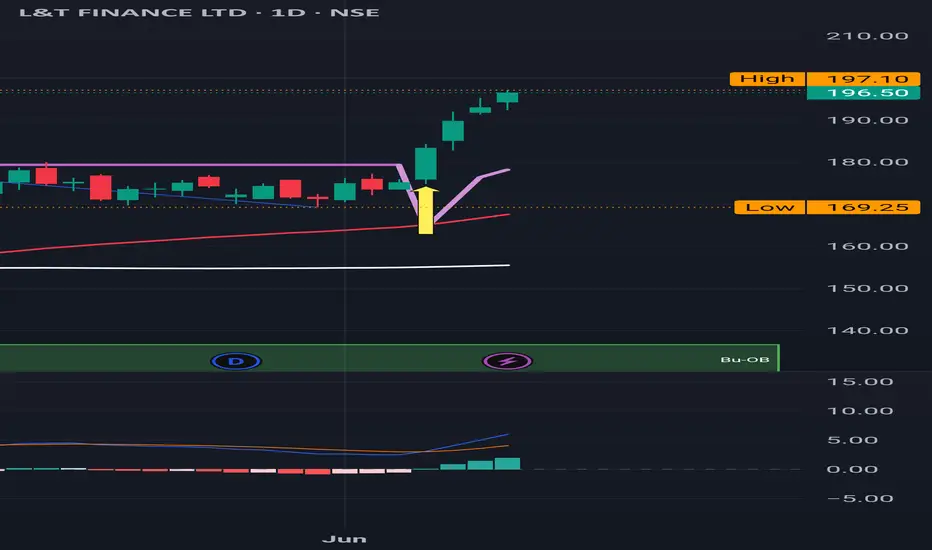
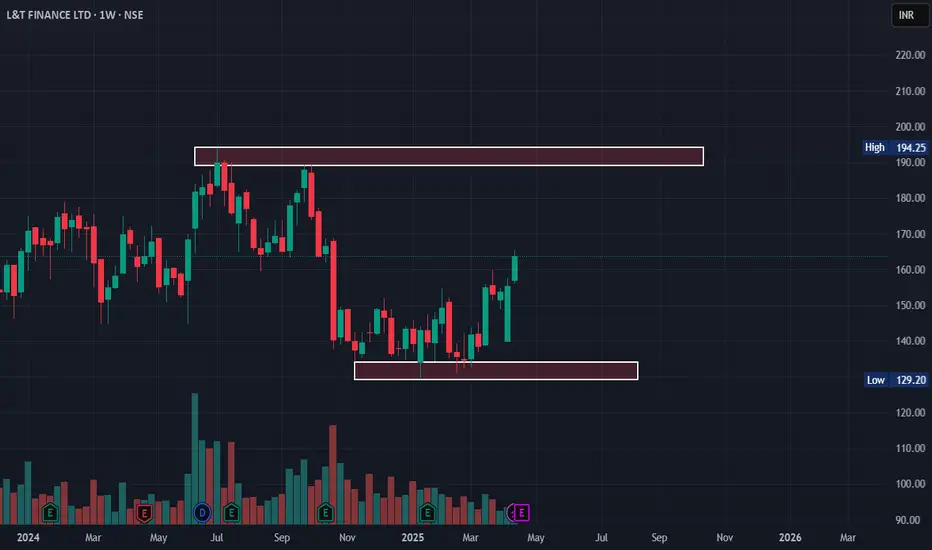
LTF Price actionSO there is many change in character in the zone
firstly it moved upward and from the high of 196 the stock fell
it came near 180 to get some liquidity and then it it consolidated for a while
Then it gave a breakout, touched the level of 193 and later on again came to retest the level of 187.
After the breakout, it again came down to the level of 188. Then it gave us a trade rally of 5%.'
HISTORIC BREAKOUT IN L&T FINANCE! The stock is trading at high levels at all times. Why is this a strong buy?
1. The Stock has given a breakout on a monthly as well as weekly chart.
2. When the stock breached the important levels, the volume was significantly high.
3. It has given a good close after the breakout and sustained the selling pressure.
4. The Nifty Financial Index is also in favour.
Note: This stock can give 20-30% returns in the coming 1-2 months. This is the right moment to invest in this sector for potential returns.
Stop Loss: Though the stock has given a breakout, for confirmation, we have to see whether it will sustain throughout the week or not. If the weekly close is above our levels, we will add some more quantities.
L&T FinancePrice near the key resistance.
High Probability bet
Enter Short when the Hourly chart looks favorable.
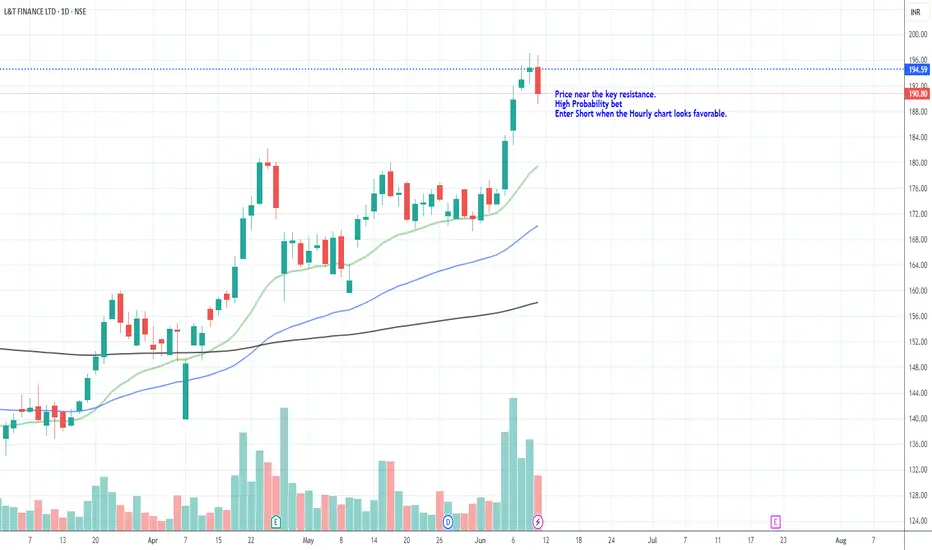
L&T Finance : Daily Time Frame , Buy L&T Finance : In a Buy trajectory on a daily time frame. Very clean buy signal and a flawless run after a Buy Signal
200 will be an important level to test as mentioned in my other post.
( Not a Buy / Sell Recommendation
Do your own due diligence ,Market is subject to risks, This is my own view and for learning only .)
L&T Finance : In a Buy trajectory on a Monthly time frame L&T Finance : In a Buy trajectory on a Monthly time frame .
Trying hard to stay above and clear major the Red Band resistance.
Rs. 200+ would be an important milestone.
( Not a Buy / Sell Recommendation
Do your own due diligence ,Market is subject to risks, This is my own view and for learning only .)
LTF | Buy @LTP | Strict SL below 156 | 1st Target 190Disclaimer:
This is not financial advice. Please do your own research or consult with a financial advisor before making any investment decisions. Investments in stocks can be risky and may result in loss of capital.
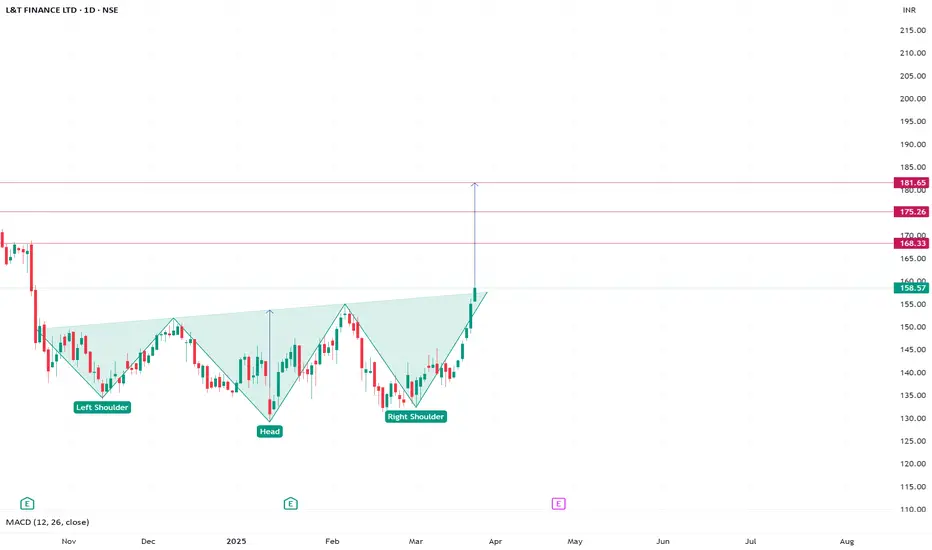
LTF Forming Inverted H&SLTF has formed inverted H&S pattern and has confirmed breakout
With this it will have following targets
168 / 175 / 180
L&T Finance Gearing Up — Breakout or Rejection Ahead?"L&T Finance is showing strength as it approaches a key resistance zone on the chart. With increasing volume and bullish momentum, a breakout above this level could trigger a fresh upward move. However, if the resistance holds, a pullback may follow. Traders should watch closely for confirmation before taking positions.
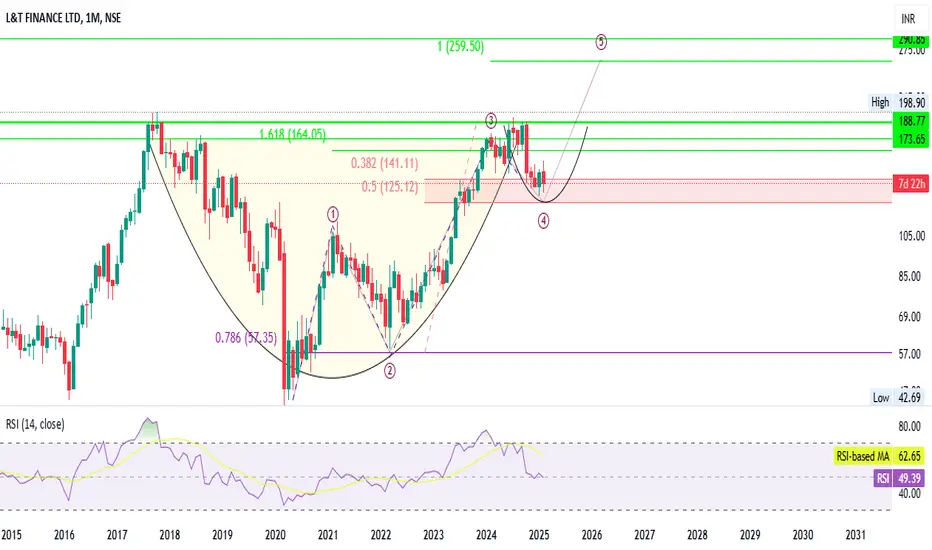
l&t- this will finance my expenses !!! 2X!!Key Observations:
Chart Patterns:
A cup-and-handle formation is visible, indicating a bullish continuation pattern.
A wave structure (likely Elliott Wave) is drawn, showing a Wave 5 target at 259.50 INR.
Support & Resistance:
Support Zone: 125-135 INR (marked as a buying opportunity).
Stop Loss (SL): 111 INR.
Resistance Levels:
164.05 INR (1.618 Fibonacci level).
188.77 - 198.90 INR (previous highs).
259.50 INR (projected Wave 5 target).
Fibonacci Levels:
0.5 Retracement: 125.12 INR (aligns with the buy zone).
0.382 Retracement: 141.11 INR (potential resistance).
1.618 Extension: 164.05 INR (breakout level).
Indicators:
RSI (Relative Strength Index): 49.39, indicating neutral momentum.
RSI-Based Moving Average: 62.65, showing a previous uptrend losing strength.
Conclusion:
The chart suggests a bullish long-term outlook, with a buying opportunity in the 125-135 INR range.
A break above 164 INR could confirm the next bullish wave.
The RSI is neutral, meaning the stock could consolidate before making the next move.
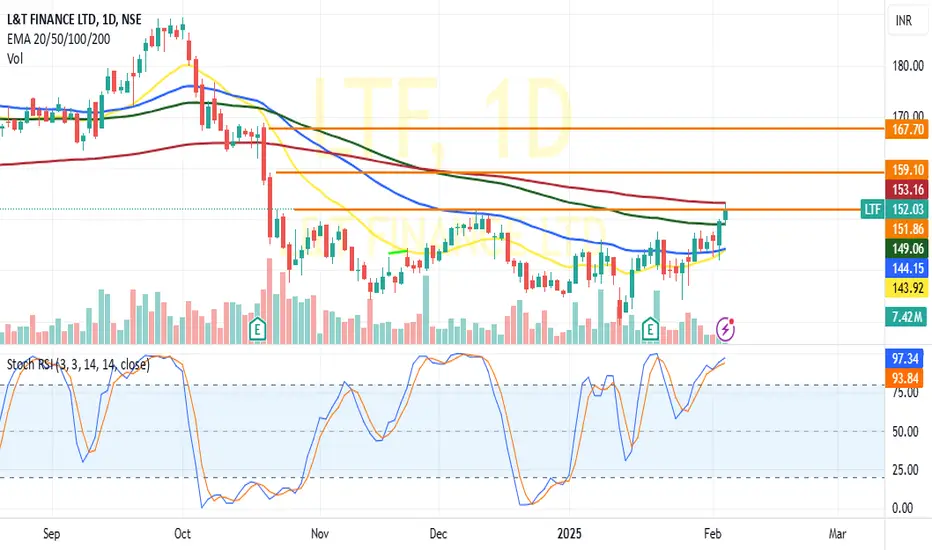
L&T FINANCE: 20DEMA Positive crossoverL&T FINANCE : Has given positive 20DEMA Crossover above 50 DEMA in daily chart.
Bullish candle formation suggests its likely to breach its neckline resistance at 150 and test 160-165 band(For educational purpose only)
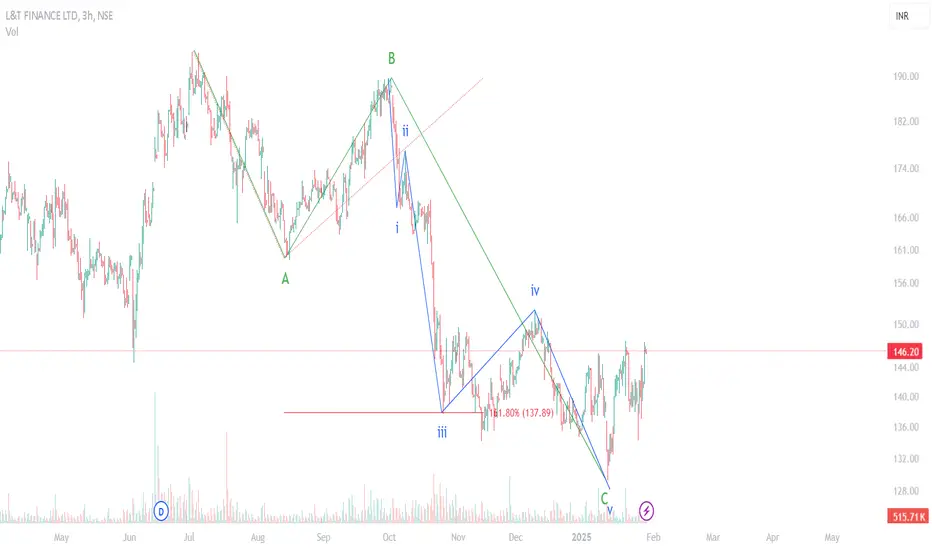
LTF -- FINANCEon 3 H TF, it looks like correction on 3 H time frame has been completed. Now, Its time for impulse...
L& T fin looking good for up side L& T fin looking good for up side as trading in near price reversal zone ..
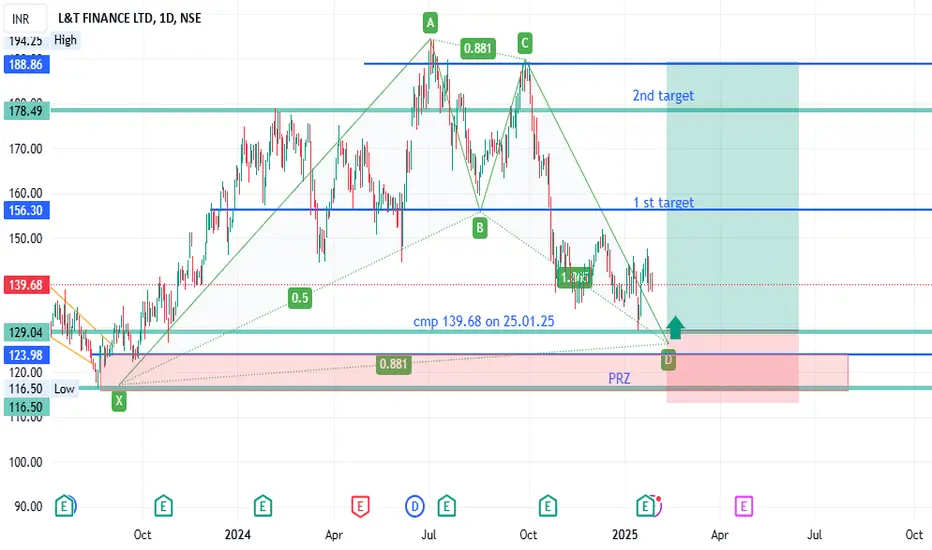
LTFi Observed these Levels based on Price Action and Demand & Supply which is my own Concept "PENDAM CONCEPTS"... Please don't take any trades based on this chart/post... Because this chart is for educational purpose only not for Buy or Sell Recommendation... Thank Q
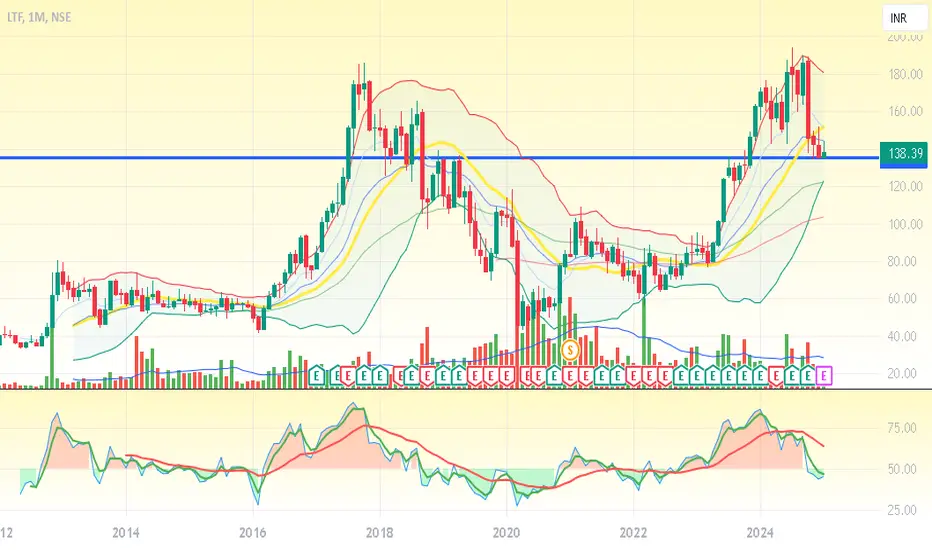
LTF at Monthly SupportL&T Finance@138 is at strong Monthly Support.
Financials can do better in next quarter.
Structure seems interesting.
Please consult your financial advisor before investing.
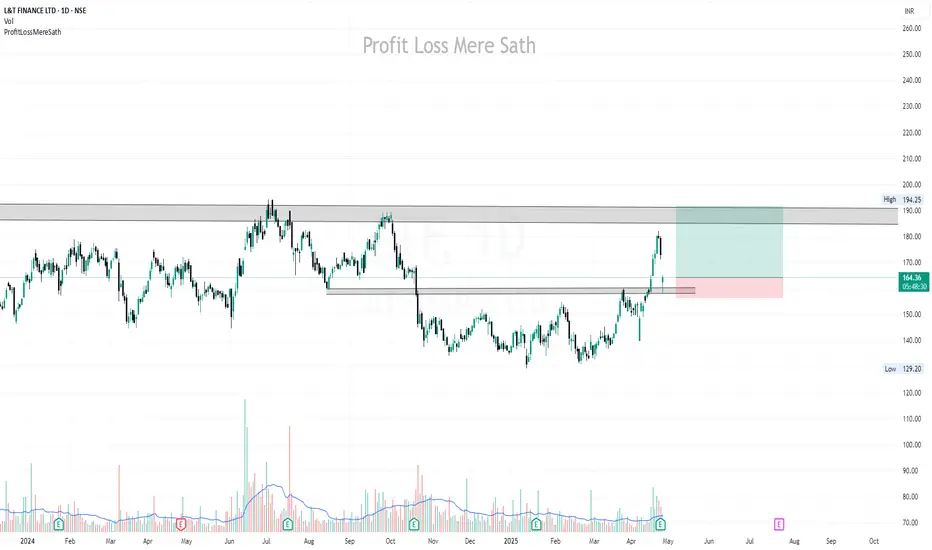
L&T Finance - Strong Support Zone Swing Trade SetupL&T Finance has reached a key support zone around the 140-145 range , which has been tested several times in the past (indicated by the blue arrows). This zone has consistently held up, with strong rebounds, signaling significant buying interest.
Support Zone: 140-145 range
Current Price: 150.40
Entry Strategy: I’ll be watching for a bullish or green daily candle forming near the support zone. Once that candle is established, I’ll look for a 15-minute candle to break above the high of the daily candle. Once that happens, the entry will be confirmed.
If the support holds and we get a bullish daily candle, followed by a 15-minute breakout, this could be a strong setup for a reversal. The volume spike seen here also adds confidence that buyers may be stepping back in at these levels.
Disclaimer: This post is for educational purposes only and not financial advice. Always do your own research and manage your risk responsibly.

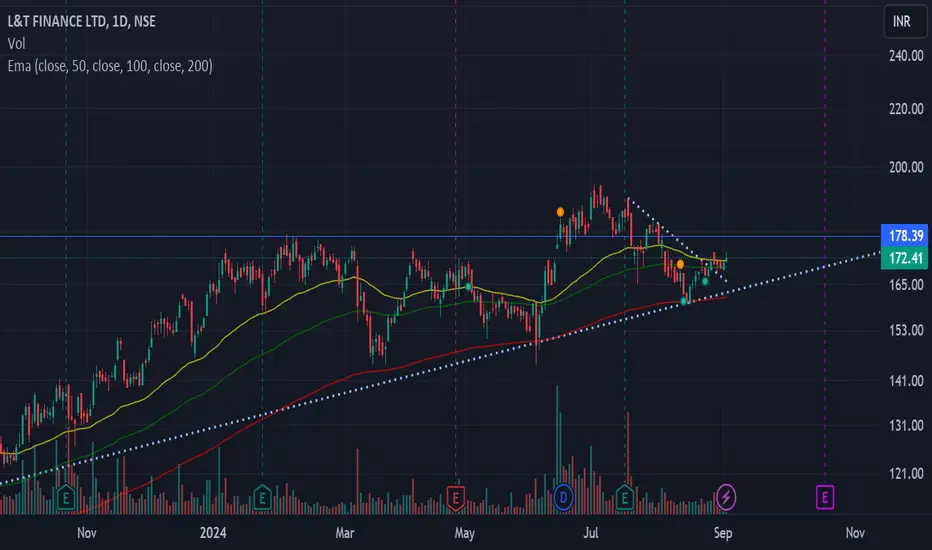
A look at L and T finance Interest rate cut news are buzzinf
Stock is giving trendline breakout
Also giving 50 EMA breakout (wait for restest)
Taret could be 190, 200 for swing
for positional 280
SL for swin 168
iTs not buy/sell advise . Educational purpose only
LTF LONGLTF
MTF Analysis
LTF Corp Yearly Breakout 166
LTF Corp 6 Month Demand Breakout 166
LTF Corp Qtrly Demand BUFL 179
LTF Corp Monthly Demand 175
LTF Corp Weekly bufl 157
LTF Corp Weekly bufl 169
LTF Corp dAILY bufl 175
LTF Corp dAILY DMIP 167
ENTRY 175
SL 170
RISK 5
Target 213
REWARD POINT 38
Last High 194
RR 7.60
RR 22%