LTIM M1LTIM
Pros:
Company has delivered good profit growth of 24.8% CAGR over last 5 years
Company has a good return on equity (ROE) track record: 3 Years ROE 29
Company has been maintaining a healthy dividend payout of 41.2%
Cons:
Stock is trading at 9.12 times its book value
Promoter holding has decreased over last 3 years: -5.65%
LTIM trade ideas
LTIM LONG 5587 RR 1:6.3LTIM
Current Price :
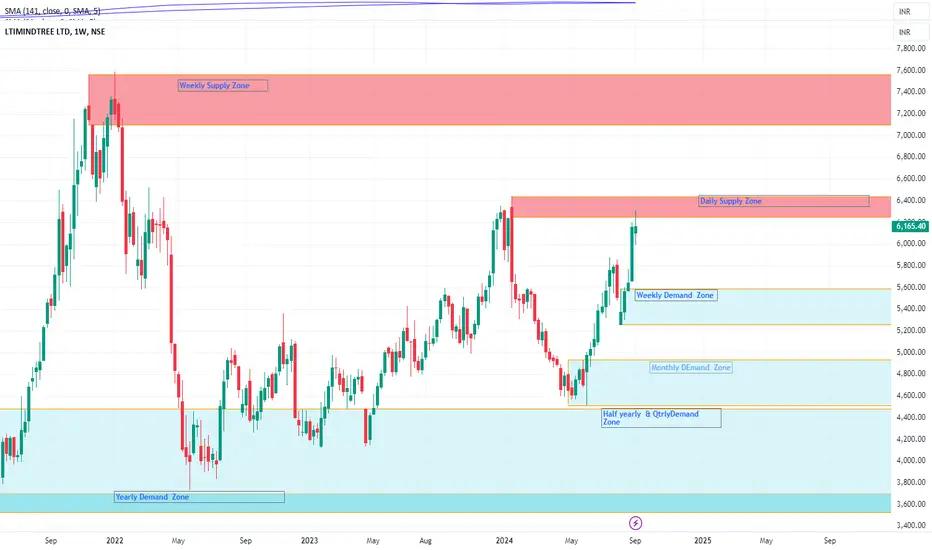
LTIM Daily Supply 6249
LTIM Weekly Supply 7121
MTF Analysis
LTIM Yearly BUFL 3698
LTIM 6 Month BUFL 4499
LTIM Qtrly BUFL 4499
LTIM Monthly Demand BUFL 4499
LTIM Monthly Demand DMIP 4543
LTIM Weekly DMIP 5587
LTIM Daily BUFL 5798
ENTRY 5587
SL 5100
Target 8655
Last High 7121
RR 6.30
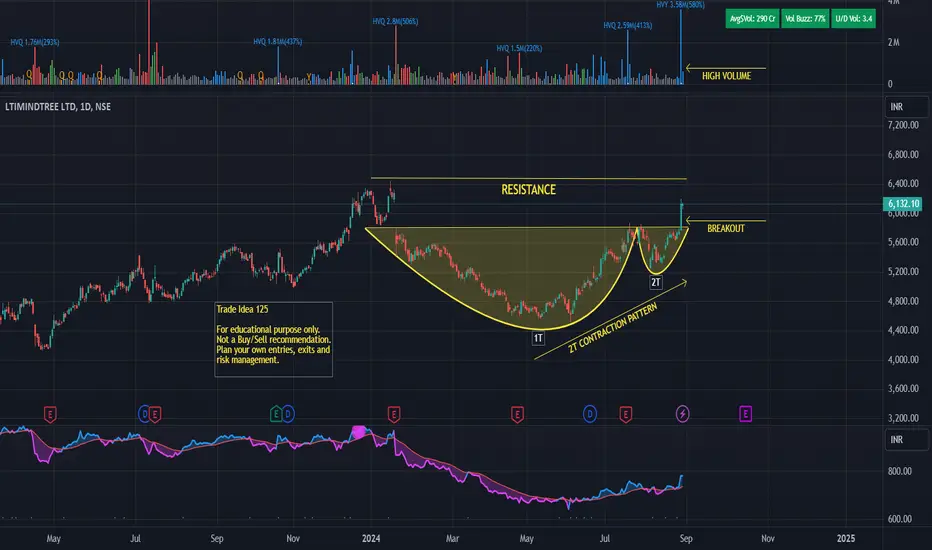
LTIM - VCP breakout alertLTIMindtree Ltd.
VCP pattern in daily time frame.
Stock in bullish uptrend
Increasing Relative Strength
Outperforming sectoral index
With 52 week high zone
Disclaimer:
For educational purpose only.
Please do your own research before taking any trades.
Happy Trading!
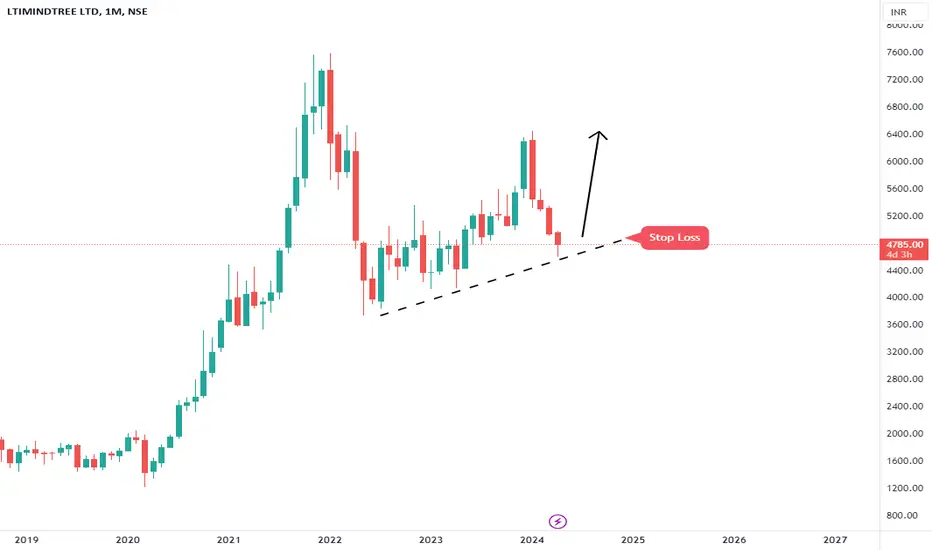
LTIM seems symmetrial!!!Another symmetrical triangle!
Another bullish breakout!
Another long position!!!
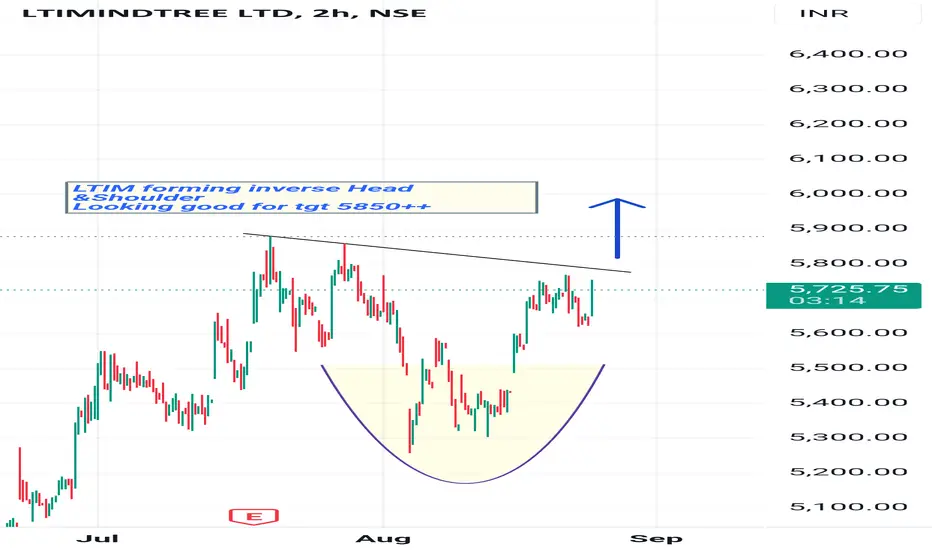
My view on LTIMLTIM forming inverse Head & Shoulder
Looking good for tgt 5850++
Keeping on radar LTIM 5800 CE (26 sep)
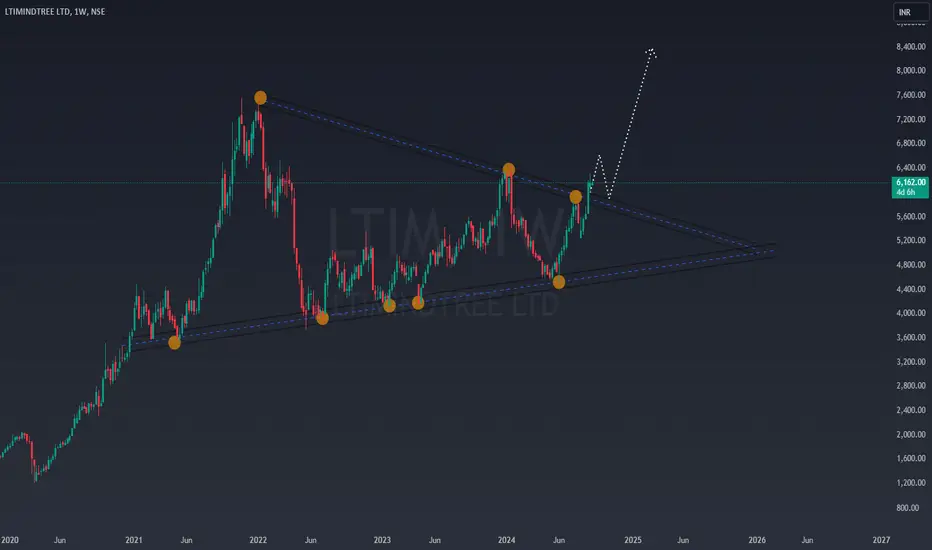
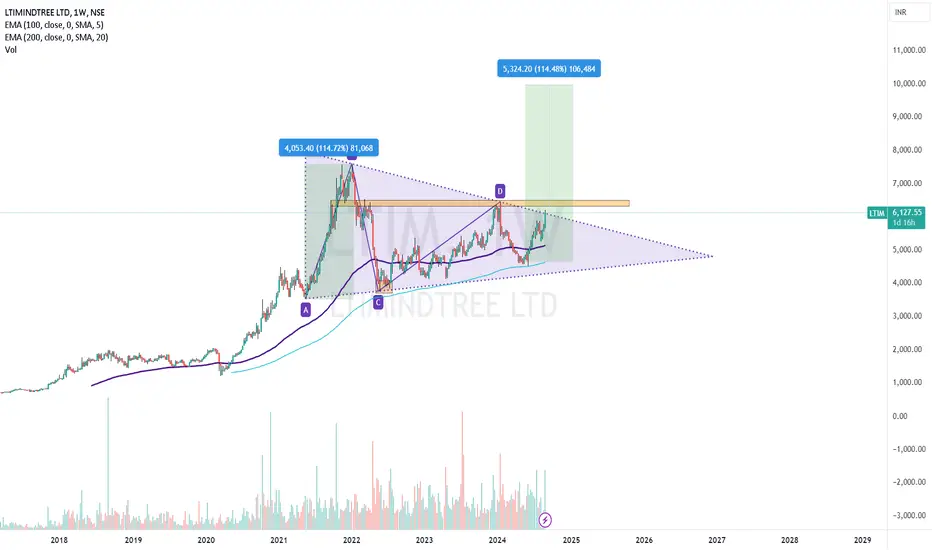
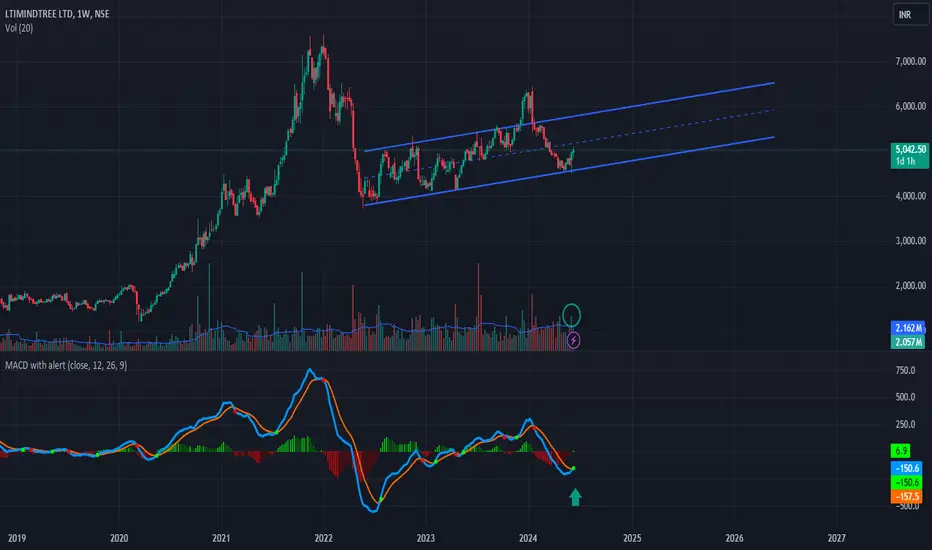
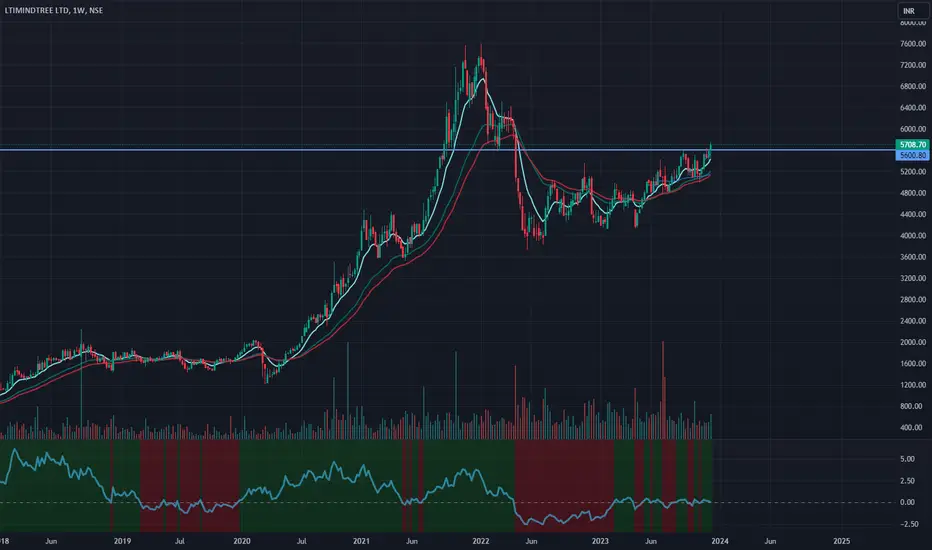
LTI MINDTREE - 5th wave rally underway?LTI MINDTREE has established distinctly defined Elliott waves, which clearly illustrate the characteristics of the waves, adhere to the principle of alternation, and align with Fibonacci levels. Upon closer examination, the following observations can be made:
A. Wave 1 concluded at approximately the 2000 level.
B. Wave 2 exhibited an irregular flat correction, retracing to the 61.8% level.
C. Wave 3 was projected to extend nearly 4.23% of Wave 1, with its minor wave 5 being extended.
D. Wave 4 represented a Zig Zag correction, consistent with the principle of alternation, as Wave 2 was a flat correction. Given that Wave 3 was extended, a deeper Wave 4 is anticipated, retracing to around 50%.
Currently, we are in major Wave 5. Its minor waves 1 and 2 appear to be completed, and we are presently in minor Wave 3. To validate our assumptions, it is evident that the stock has experienced a significant rally accompanied by increasing volumes, which is characteristic of Wave 3.
In terms of trading strategy, we can consider building our positions in a phased manner, allocating a portion at current levels and the remainder on dips or upon receiving further bullish signals, such as candlestick patterns or when the RSI crosses the 60 mark on daily or weekly charts.
All significant levels and descriptions are indicated on the chart.
DISCLAIMER: It is important to note that the information provided in this analysis is intended solely for educational purposes. It is strongly advised to consult with a financial advisor prior to making any investment decisions. I cannot be held responsible for any financial losses that may occur.

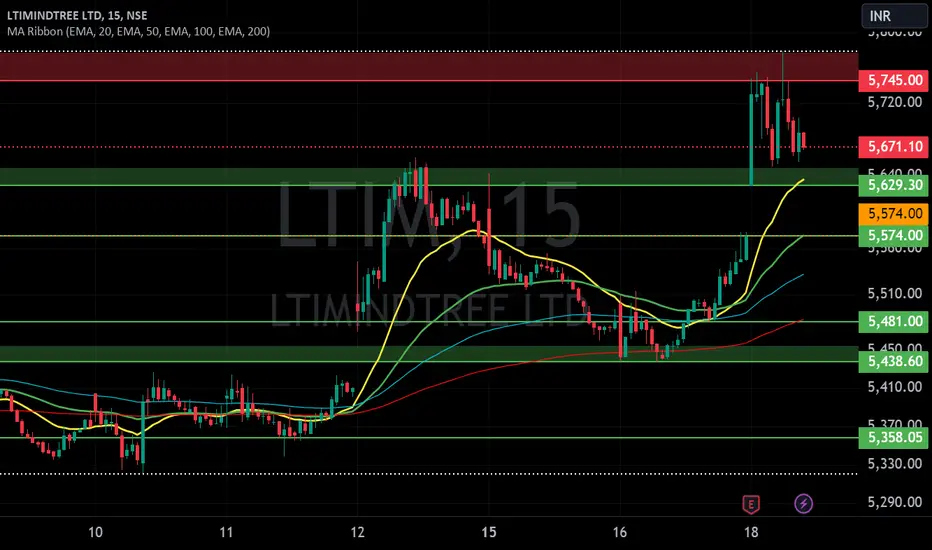
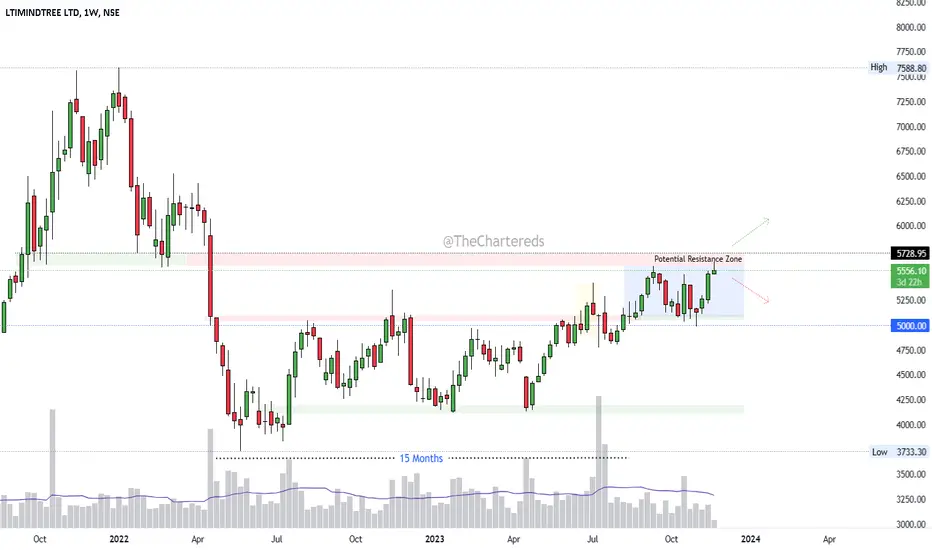
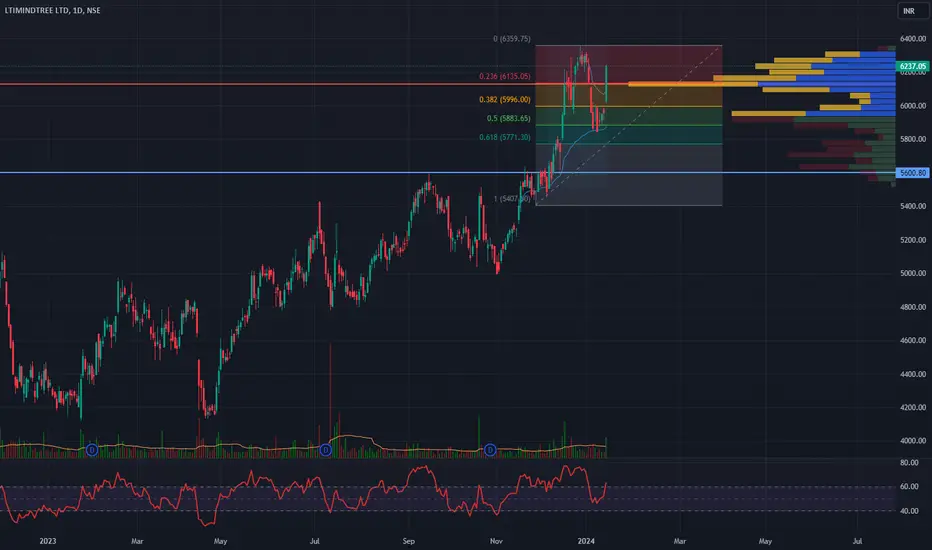
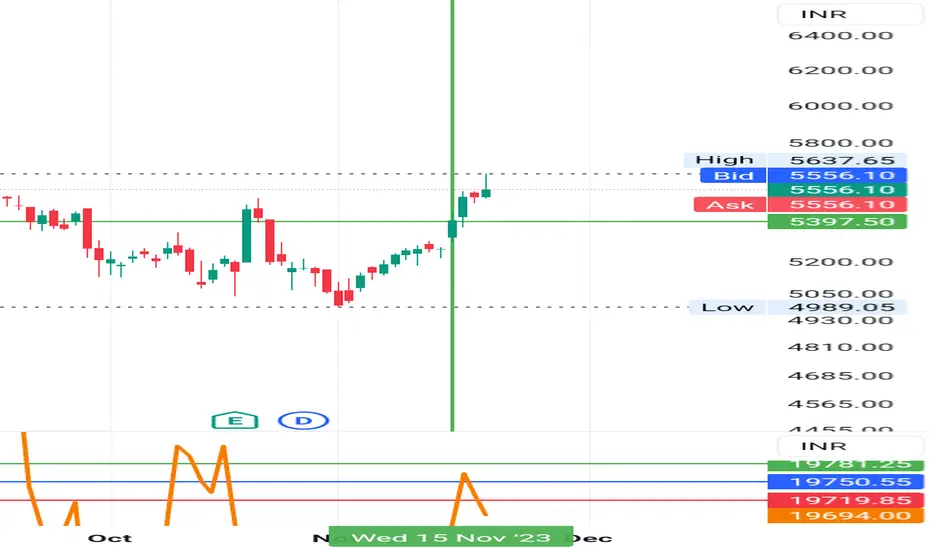
LTIMINDTREE LTD S/R for 18/7/24Support and Resistance Levels: In technical analysis, support and resistance levels are significant price levels where buying or selling interest tends to be strong. They are identified based on previous price levels where the price has shown a tendency to reverse or find support.
Support levels are represented by the green line and green shade, indicating areas where buying interest may emerge to prevent further price decline.
Resistance levels are represented by the red line and red shade, indicating areas where selling pressure may arise to prevent further price increases. Traders often consider these levels as potential buying or selling opportunities.
Breakouts: Breakouts occur when the price convincingly moves above a resistance level (red shade) or below a support level (green shade). A bullish breakout above resistance suggests the potential for further price increases, while a bearish breakout below support suggests the potential for further price declines. Traders pay attention to these breakout signals as they may indicate the start of a new trend or significant price movement.
20 EMA: The yellow line denotes 20 EMA, to interpret the 20 EMA, you need to compare it with the prevailing stock price. If the stock price is below the 20 EMA, it signals a possible downtrend. But if the stock price is above the 20 EMA, it signals a possible uptrend.
Disclosure: I am not SEBI registered. The information provided here is for learning purposes only and should not be interpreted as financial advice. It is important to consult with a qualified financial advisor before making any investment decisions. Tweets neither advice nor endorsement.
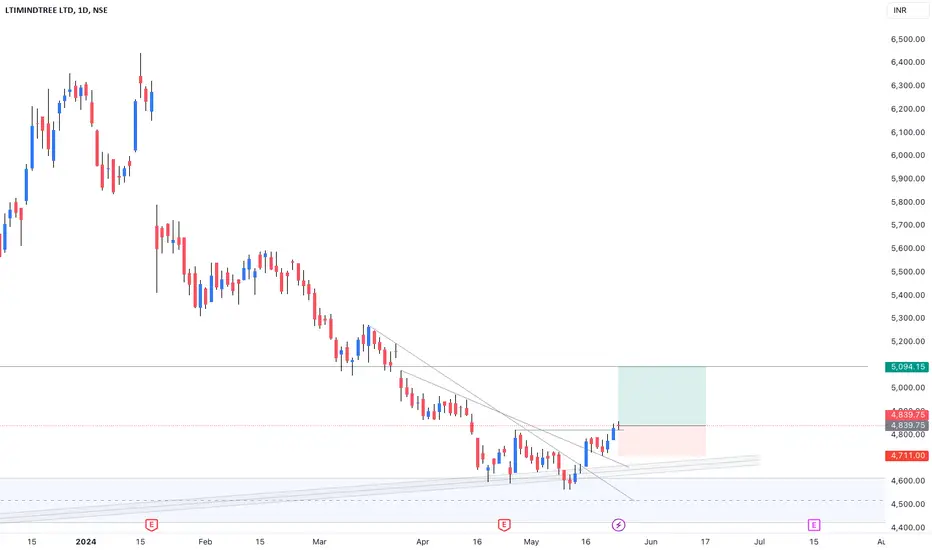
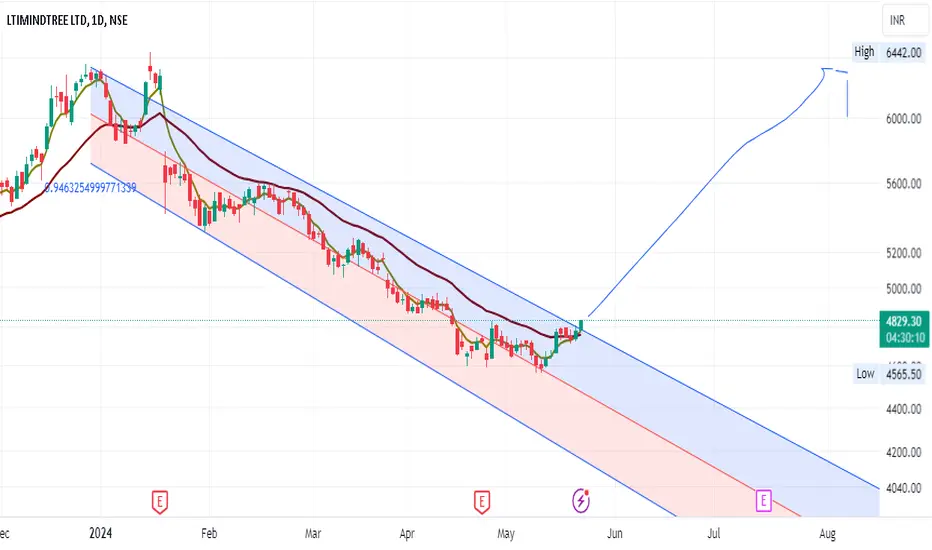
Swing trade opportunity in LTIMLTIMindtree Ltd. operates as a technology consulting firm, which engages in services include cloud and infrastructure, cyber security, data and insights, digital engineering, disruptive SaaS, and platform operations.
Over the past four months, the price has been declining, but this month it reached its long-term trendline support on the weekly timeframe. After consolidating for four weeks, price has shown some strength and closed above last week’s level.
On the daily timeframe, the price has broken out above this consolidation range and also breached and retested the negative trendline.
A trade can be considered near the current market price (CMP), with a stop loss (SL) set at 4700. The targets are 5100, 5200, and 5500.
This analysis is for informational purposes only and is not a recommendation to buy or sell. Always consult a financial advisor and practice proper risk management before investing.
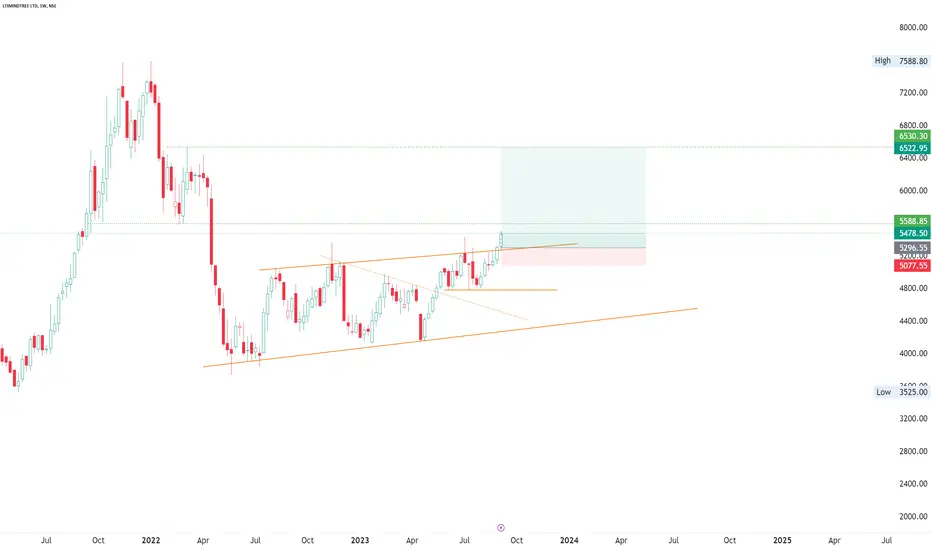
LTIM on rising paths nowOn a weekly charts, you can easily analyze the price action movement towards it's life time high ie. @ 7500 but it may face an huddle in between at 6500 level. So main levels are:
1st Target - Rs 6500
2nd Target - Rs 7500
3rd Target - Rs 10000
Stoploss - Rs 4400
Note - Please consult your financial advisor before taking any trade in LTIM

LTIM: Positives🎯The chart is pretty self-explanatory as always.
⚠️Disclaimer: We are not registered advisors. The views expressed here are merely personal opinions. Irrespective of the language used, Nothing mentioned here should be considered as advice or recommendation. Please consult with your financial advisors before making any investment decisions. Like everybody else, we too can be wrong at times
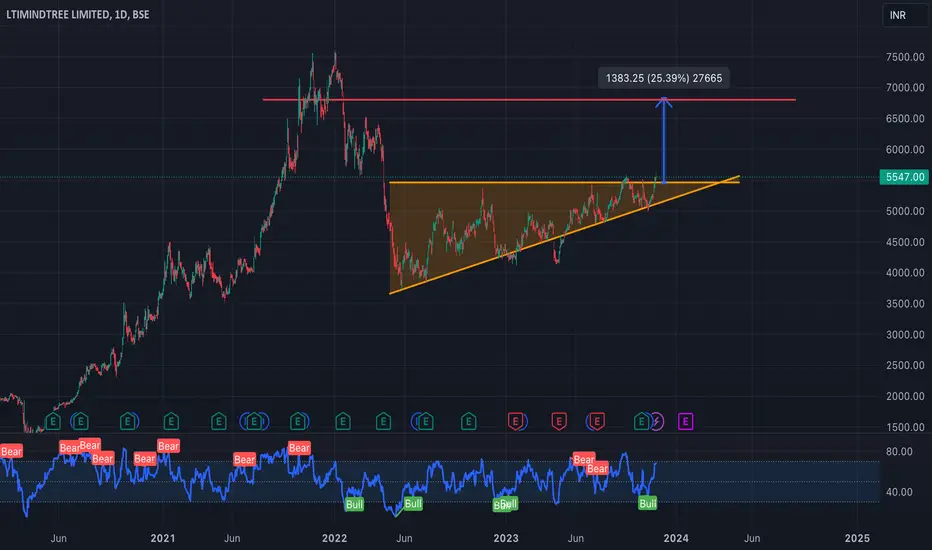
25 percent in 66 days expected roi in ltim basis results LTIMindtree Ltd., incorporated in the year 1996, is a Large Cap company (having a market cap of Rs 140,107.49 Crore) operating in IT Software sector.
LTIMindtree Ltd. key Products/Revenue Segments include Software Development Charges & Other Services for the year ending 31-Mar-2023.
For the quarter ended 31-03-2024, the company has reported a Consolidated Total Income of Rs 9,100.50 Crore, down 1.47 % from last quarter Total Income of Rs 9,236.10 Crore and up 3.92 % from last year same quarter Total Income of Rs 8,757.40 Crore. Company has reported net profit after tax of Rs 1,100.70 Crore in latest quarter.
The company’s top management includes Mr.A M Naik, Mr.S N Subrahmanyan, Mr.Debashis Chatterjee, Mr.Nachiket Deshpande, Mr.Sudhir Chaturvedi, Mr.R Shankar Raman, Mrs.Apurva Purohit, Mr.Bijou Kurien, Mr.Chandrasekaran Ramakrishnan, Mr.James Abraham, Mr.Rajnish Kumar, Mr.Sanjeev Aga, Mr.Vinayak Chatterjee, Mr.Vinit Ajit Teredesai, Mr.Tridib Barat. Company has Deloitte Haskins & Sells LLP as its auditors. As on 31-03-2024, the company has a total of 29.62 Crore shares outstanding.
my target 5999
stop loss 4777
for more shares wsup on 8459 22 02 02
happy investing
Time to accumulate LTIM shareThere a high chance to bounce from the support area. Worth to start accumulating this share for a good returns.
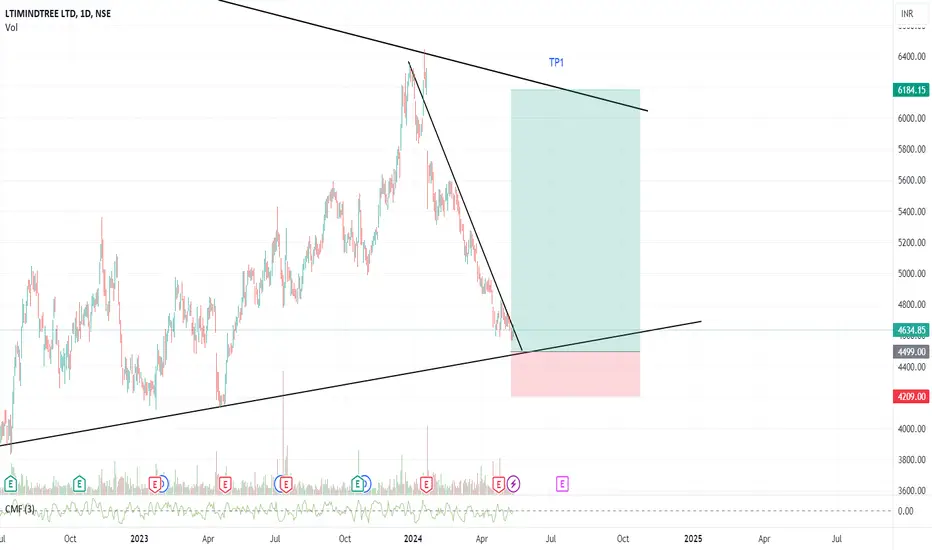
[Positional] LTIM Buy IdeaNote -
One of the best forms of Price Action is to not try to predict at all. Instead of that, ACT on the price. So, this chart tells at "where" to act in "what direction. Unless it triggers, like, let's say the candle doesn't break the level which says "Buy if it breaks", You should not buy at all.
=======
I use shorthands for my trades.
"Positional" - means You can carry these positions and I do not see sharp volatility ahead. (I tally upcoming events and many small kinds of stuff to my own tiny capacity.)
"Intraday" -means You must close this position at any cost by the end of the day.
"Theta" , "Bounce" , "3BB" or "Entropy" - My own systems.
=======
I won't personally follow any rules. If I "think" (It is never gut feel. It is always some reason.) the trade is wrong, I may take reverse trade. I may carry forward an intraday position. What is meant here - You shouldn't follow me because I may miss updating. You should follow the system I share.
=======
Like -
Always follow a stop loss.
In the case of Intraday trades, it is mostly the "Day's High".
In the case of Positional trades, it is mostly the previous swings.
I do not use Stop Loss most of the time. But I manage my risk with options as I do most of the trades using derivatives
LTIMwait for price to enter our reversal zone . if candle closed below all blue lines , pattern becomes ivalid. close the trade with small sl .
if moves up , keep 10% as tgt.

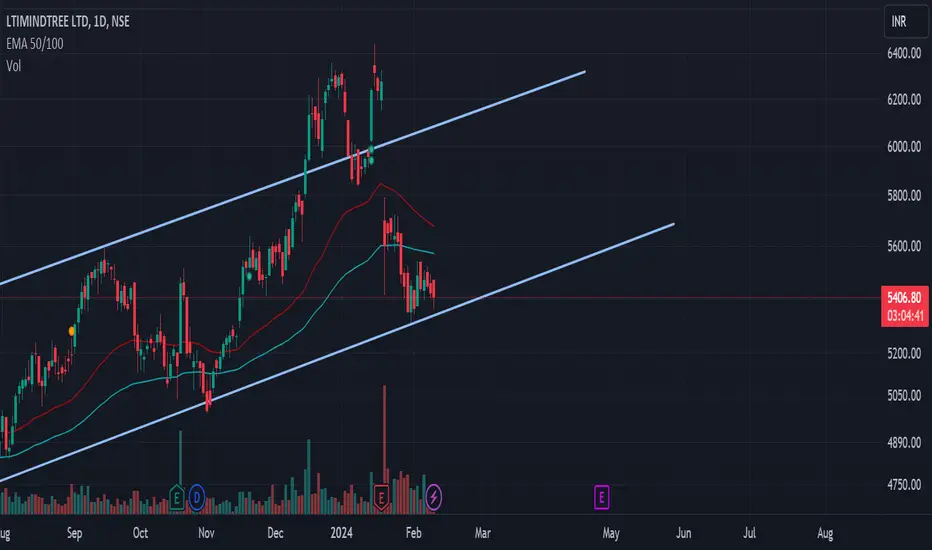
positional bet Nifty has fallen to 21700 and its not sustaining above 22000. Only way it can sustain above 22k is a push from IT or banking sector.
LTI mindtree has already corrected enough and its likely show upward momentum as shown in chart its operating in channel.
Target could be 6150 and above if it breaks channel.
Trade will be cancelled if nifty falls down further.
LTIM MINDTREEThe stock has a positive hidden divergence. It has crossed 10 ema and has given an avwap squeeze with volumes. The stock is poised to continue its upward trend.
LTIM is ready to fly
I want to share my market analysis
ideas with you and follow all
the rules and guidelines for analyzing
the market.
However, please note that my ideas are
based on my personal experience and
may change over time.
If there is an error in my analysis, I
am open to re-analyzing it from the
beginning and learning from my
mistakes. It's important to understand that making an error in analysis is not a fault, but evading responsibility is.
No one can analyze financial markets
with 100% accuracy, but it's remarkable
how close we can get.
BREAKOUT IS AWAITING Look out this stock for breakout.
Technically chart pattern looks good
Fundamentally revenues and PAT is also improving
LTIMNSE:LTIM
One Can Enter Now !
Or Wait for Retest of the Trendline (BO) !
Or wait For better R:R ratio !
Note :
1.One Can Go long with a Strict SL below the Trendline or Swing Low.
2. R:R ratio should be 1 :2 minimum
3. Plan as per your RISK appetite and Money Management.
Disclaimer : You are responsible for your Profits and loss, Shared for Educational purpose
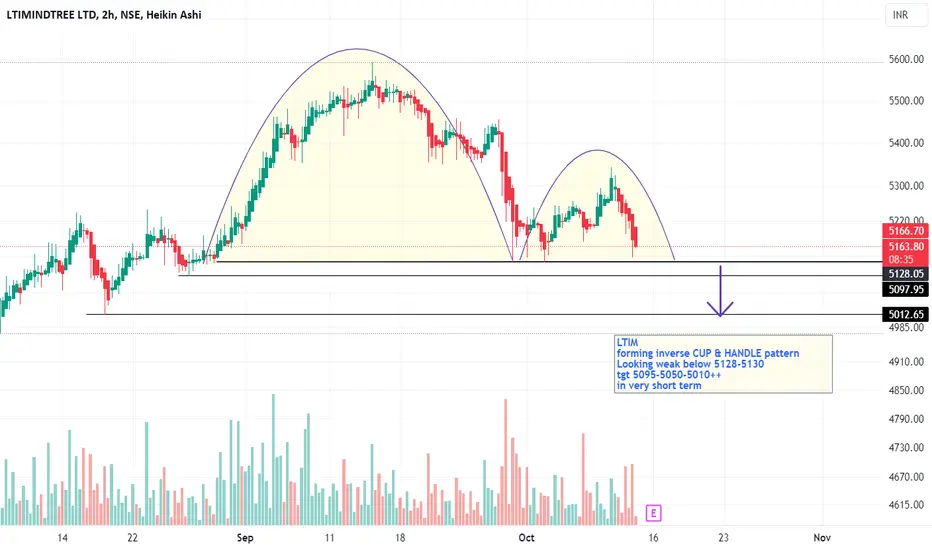
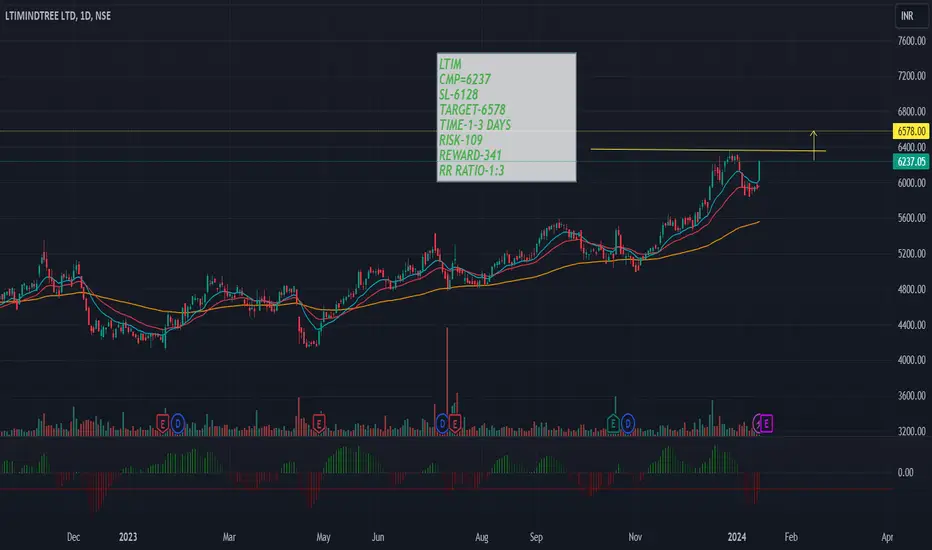
My view on LTIMLTIM
forming inverse CUP & HANDLE pattern
Looking weak below 5128-5130
tgt 5095-5050-5010++
in very short term
keeping on radar LTIM 5100 PE