MARUTI KEY LEVELSExplanation:
This is a very useful trading system. This means that you should not take a trade blindly, but rather that there is another confirmation to take the trade you can use this for perfect entry and perfect exit
This trading opportunity is based on volume, previous price, and price range , are included
Entry/Exit point's:
- It has very easy entry and exit points
- In this pair of lines with two colors are given (RED AND GREEN)
- In this the GREEN line is used to take long entry and the RED line is used to take short entry (But it is all based on a more conformation from your trading plan)
Stop Loss/Take Profit:
Stop Loss
- According to this, if you take a long trade, its stop loss will be the RED line just below ( A trade can exit either when the price crosses the RED line or the 5 minute candlestick crosses the RED line. (This can be done according to your preference) )
- A short entry should use the opposite rules to a long entry
Take Profit
-When you take a long entry according to the profit to be booked is on the next RED line above. ( Or if there are other reasons, it can be a safe exit )
- Opposite rules for booking profit on long entry are to book profit on short trade. ( The GREEN line above is the stop loss of short entry )
Timeframe:
According to this, the time frame you should use while taking trades is 5 minutes time frames . (5 minute time frame works well in this)
Risk Disclaimer:
Leave a comment if you like my entry setup. This share is for educational learning purposes only, and I am not responsible for your profit or loss. Note: For more details, check the chart.
MARUTI trade ideas
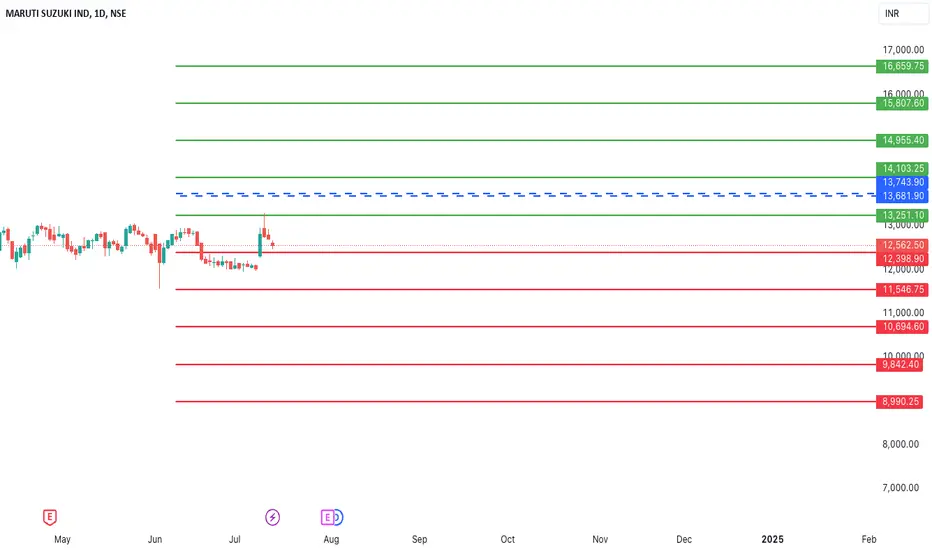
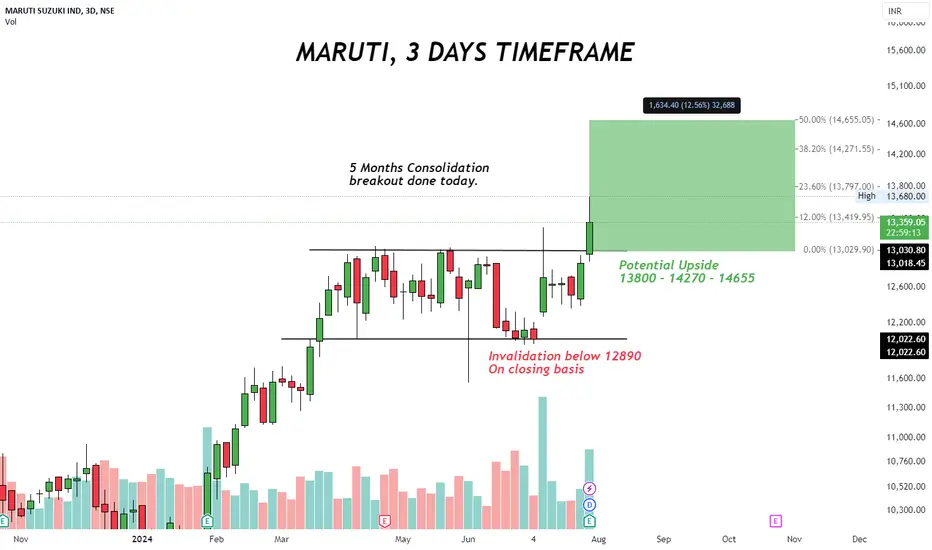
MARUTI- AnalysisAs per estimates in the market, Revenue and Earning are expected to drop which will be announced around 31st July 2024,
Estimates could be true or it could be rumours so be careful with the position.
Bullish Levels -above 13251 then 13681 to 13743 Important level Safe players and new entry can be planned above this or above 14103 then 14955 then 15807 then 16659
Bearish levels :- Below 12398 then 11546 then 10694 then 9842 then 8990
**Consider +/-62 Points buffer in above levels
**Disclaimer -
I am not a SEBI registered analyst or advisor. I does not represent or endorse the accuracy or reliability of any information, conversation, or content. Stock trading is inherently risky and the users agree to assume complete and full responsibility for the outcomes of all trading decisions that they make, including but not limited to loss of capital. None of these communications should be construed as an offer to buy or sell securities, nor advice to do so. The users understands and acknowledges that there is a very high risk involved in trading securities. By using this information, the user agrees that use of this information is entirely at their own risk.
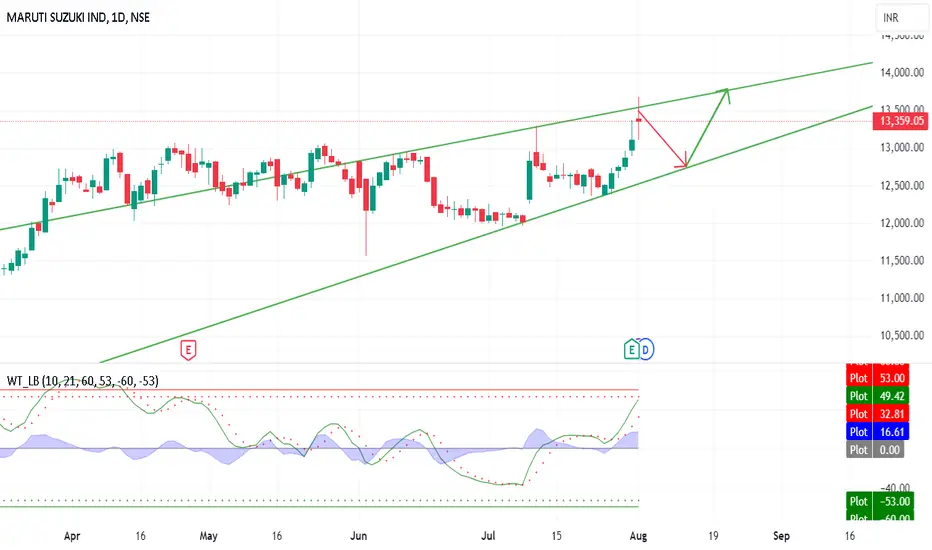
Maruti may see a big declineMaruti will see a decline in the next few sessions, a bearish doji candle is seen at the upper level on the daily chart of the stock which can turn the bullish trend into a bearish trend.
MARUTI BULL FLAG BREAKOUT??🚀 MARUTI Breaks Out! 🏁📈 🚀
The bulls are back in the driver's seat! 🐂💥 MARUTI stock has just broken out of a classic bull flag pattern, signaling a potential surge ahead. This technical formation indicates a period of consolidation, followed by a strong continuation of the previous uptrend. 📊💹
For the savvy investors, this is a golden opportunity. The breakout confirms the bullish momentum and points to further gains on the horizon. 🌟📈
As the market buzzes with excitement, remember to stay informed and make decisions based on your own research. The road ahead looks promising, but as always, tread with caution and keep your investment strategy in check. 🧐📚
Join the ride and let's watch MARUTI rev up the engines! 🏎️💨
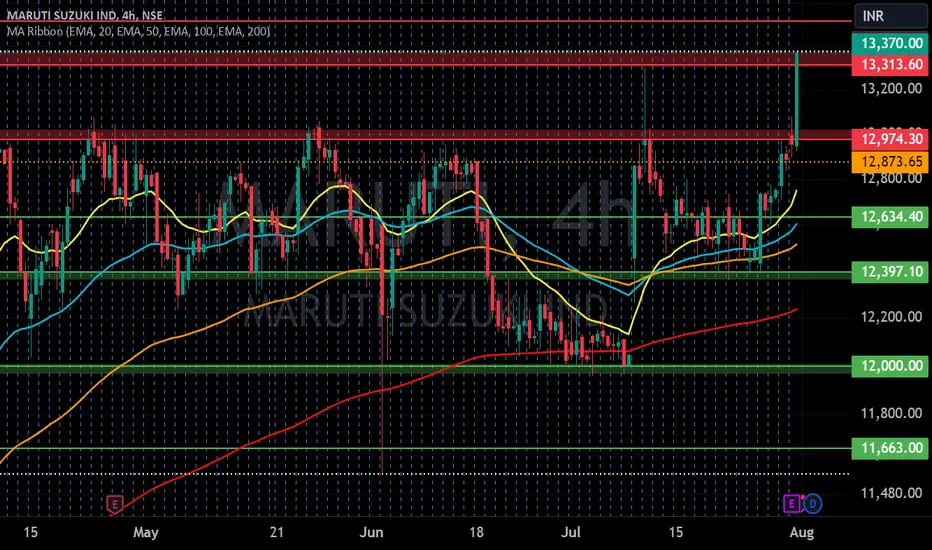
MARUTI SUZUKI IND S/RSupport and Resistance Levels: In technical analysis, support and resistance levels are significant price levels where buying or selling interest tends to be strong. They are identified based on previous price levels where the price has shown a tendency to reverse or find support.
Support levels are represented by the green line and green shade, indicating areas where buying interest may emerge to prevent further price decline.
Resistance levels are represented by the red line and red shade, indicating areas where selling pressure may arise to prevent further price increases. Traders often consider these levels as potential buying or selling opportunities.
Breakouts: Breakouts occur when the price convincingly moves above a resistance level (red shade) or below a support level (green shade). A bullish breakout above resistance suggests the potential for further price increases, while a bearish breakout below support suggests the potential for further price declines. Traders pay attention to these breakout signals as they may indicate the start of a new trend or significant price movement.
20 EMA: The yellow line denotes 20 EMA, to interpret the 20 EMA, you need to compare it with the prevailing stock price. If the stock price is below the 20 EMA, it signals a possible downtrend. But if the stock price is above the 20 EMA, it signals a possible uptrend.
Disclosure: I am not SEBI registered. The information provided here is for learning purposes only and should not be interpreted as financial advice. It is important to consult with a qualified financial advisor before making any investment decisions. Tweets neither advice nor endorsement.
Maruti at Good opportunity to BuyOpportunity for Maruti to buy. Expected Good bullish momentum with Min, Tgt of 13000
Bearish trend in hourly chart of MarutiThe hourly chart (timeframe I use for intraday trades) of Maruti is clearly bearish.
Candles are trading below 50 SMA and the manual trend is bearish as well.
There is a support at 12500 so I will sell once this is broken for targets of 12200 with SL above 12600.
#Educational purpose only

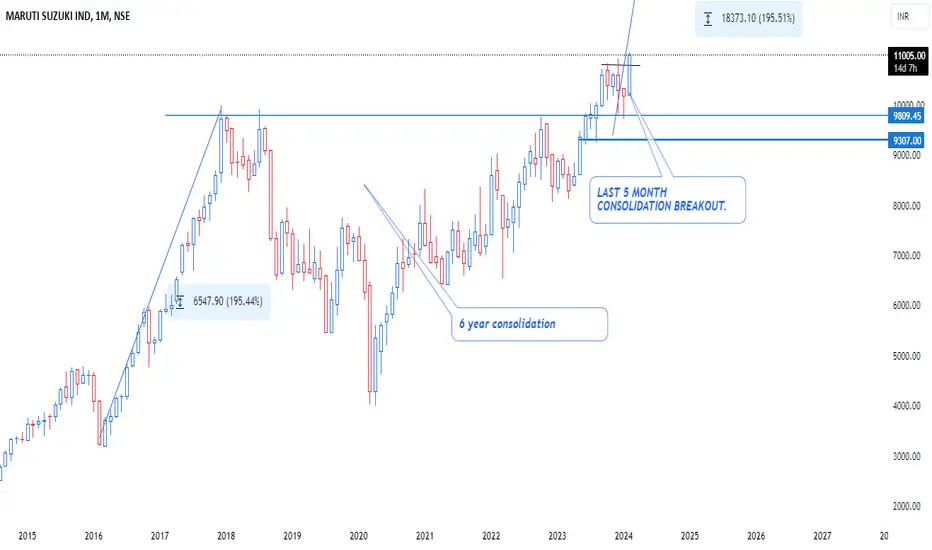
MARUTI SUZUKI - A long term Investment Idea - 50% ROI expected.1) The stock is breaking out of a 6 year old consolidation zone in yearly time frame.
2) The stock is reversing from a Fib 61.8% in yearly time frame.
3) The stock is breaking it's previous swing high.
4) The stock is above to form a strong 3 Month breakout if March closes strong.
The stock structure looks strong, one may accumulate in dips for a long term target of 19000.

MARUTHI SUZUKI IND S/R Support and Resistance Levels: In technical analysis, support and resistance levels are significant price levels where buying or selling interest tends to be strong. They are identified based on previous price levels where the price has shown a tendency to reverse or find support.
Support levels are represented by the green line and green shade, indicating areas where buying interest may emerge to prevent further price decline.
Resistance levels are represented by the red line and red shade, indicating areas where selling pressure may arise to prevent further price increases. Traders often consider these levels as potential buying or selling opportunities.
Breakouts: Breakouts occur when the price convincingly moves above a resistance level (red shade) or below a support level (green shade). A bullish breakout above resistance suggests the potential for further price increases, while a bearish breakout below support suggests the potential for further price declines. Traders pay attention to these breakout signals as they may indicate the start of a new trend or significant price movement.
Disclosure: I am not SEBI registered. The information provided here is for learning purposes only and should not be interpreted as financial advice. It is important to consult with a qualified financial advisor before making any investment decisions. Tweets neither advice nor endorsement.
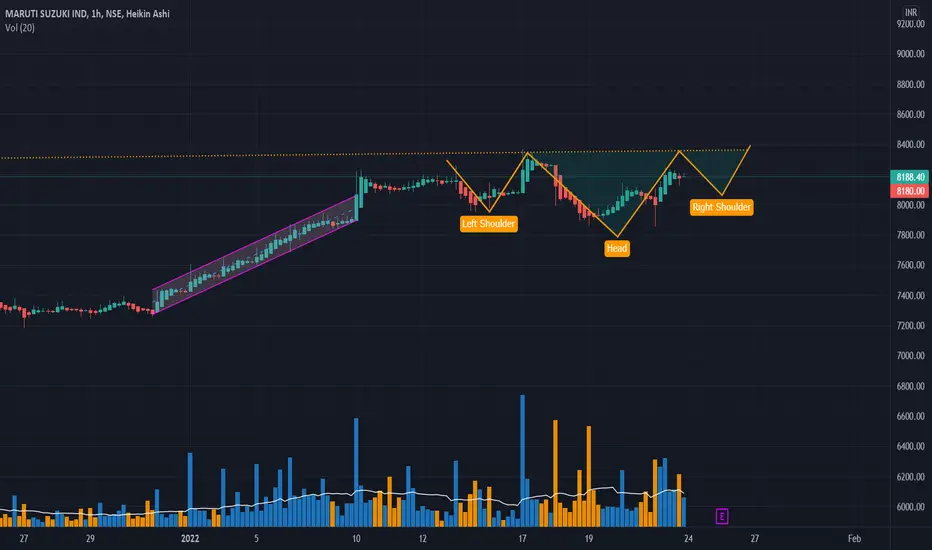
Head and Shoulder on Hourly Charts After Breakout from Parallel Channel,Consolidating on hourly Charts.
Looking to make an Head and shoulder formation on Hourly Charts
5 year consolidation breakoutsimple flag pattern breakout after pattern, in pattern tight flag breakout,

Does $NSE:MARUTI Will test 11900 ?Dear Trader,
As Per Technical Analysis NSE:MARUTI will Face Upside Resistance Near 12750 if breaks then we can see 13100-13300 This level at Upside. but if Breaks Support of 12440 Then might it will test 11900 Level.
Buying MARUTI 12500 PE near 220, SL 180, Target 300,340
This message is for informational purposes only and should not be considered financial advice. It is crucial to conduct thorough research or consult with a financial advisor before making any investment decisions. We do not guarantee the accuracy or completeness of the information provided.

Learning Post : Risk to Reward Ratio IndicatorThe Risk to Reward Position tool allows Traders to set the Entry/Exit points and Caclculate a long position from the Specific Point.
Adjusting above and below the price level will be two boxes;
Green box is for the profit zone and Red Box is for the Loss zone.
The zones are manually adjusted as the Traders
to change the Risk/Reward Ratio.
This is an Important Tool to Practice your Risk / Reward Ratio for the Particular Strategy 👍

Maruti suzukiStock has given an avawp breakout with good volumes. IF it opens up tomorrow chance of uptrend continuing is there.

MARUTI SUZUKI INDMARUTI SUZUKI IND is currently trading at a support level. If you are considering trades, here are some levels you may want to keep in mind.
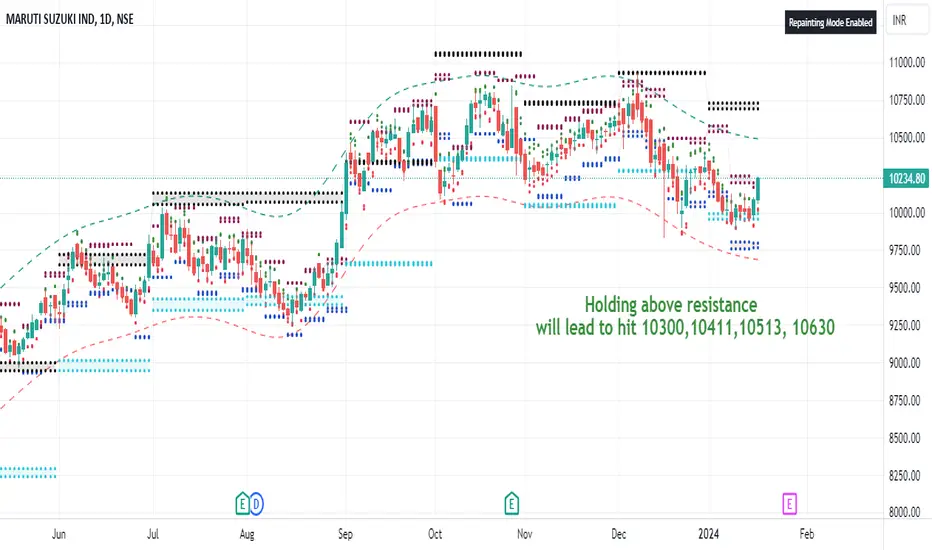
Maruti will hit 10500 ? cmp 10222Maruti Trading above resistance levels, showing strong bullish chart
Holding will lead to 10300, 10411, 10513, 10630
Support 9958 - 10011
3.91% Upside Potential
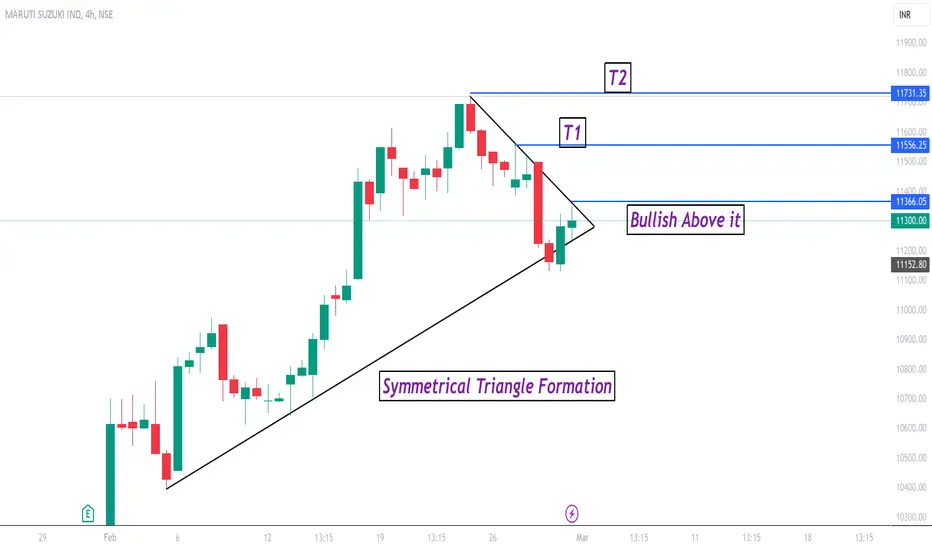
Maruti SuzukiSymmetrical Triangle formed in Maruti Suzuki. Looking good for up move only if it breaks the level. Keep an eye on it.
maruti already moving on calculated track.MAruti is following the expected path calculated ,, and if it continues . can have good upmove soon. keep close watch .

Time to book profit in Maruti i think Maruti has reached to this swing high. It may go up further a few points, but i feel we should book the profit now and wait for the retracements before entering again.
MARUTI SUZUKI (A FUNDAMENTALLY STRONG STOCKS)Maruti after crossing its all time high it has taken support near its all time. again buying comes near 10000 level. it may be a gud buy near this price range.
SL will be very low.
SL 9832
5 yrs cup break out in this stock also respecting its support\
perfect example of support and resistance.

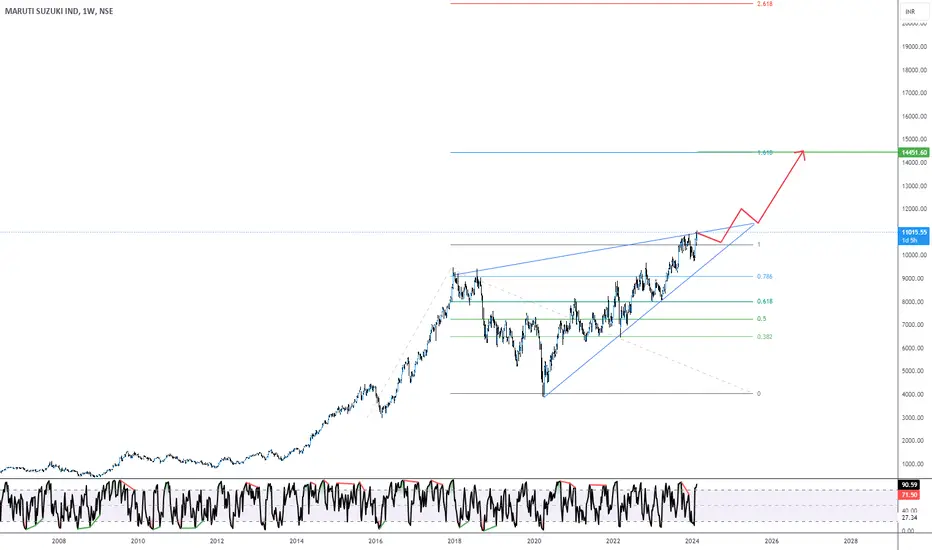
Levels for Maruti SuzukiI have go the 14450 as the next major target level from the Fibonacci level. Current major resistance of all time high is broken. By looking at height of the fibonacci level, I can say that price may move aggressively.
For educational purpose only. No recommendation.