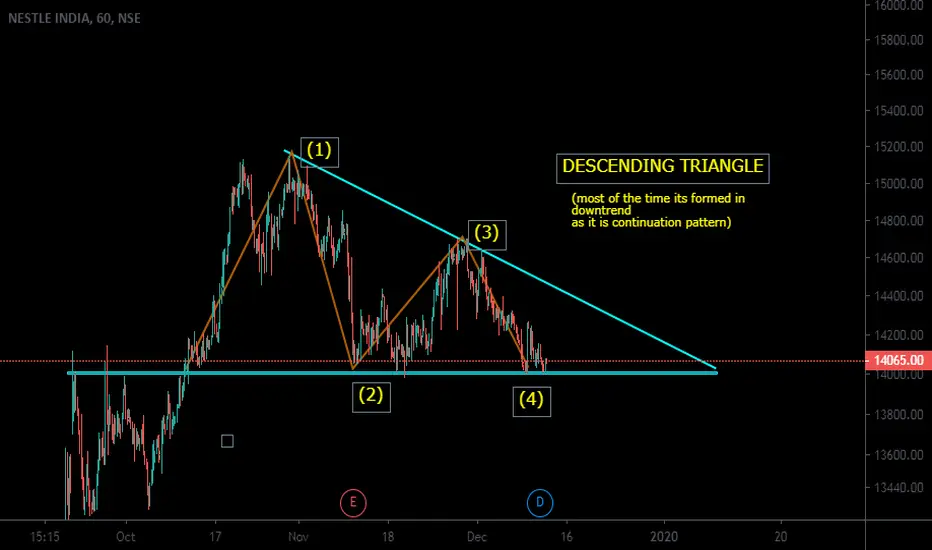
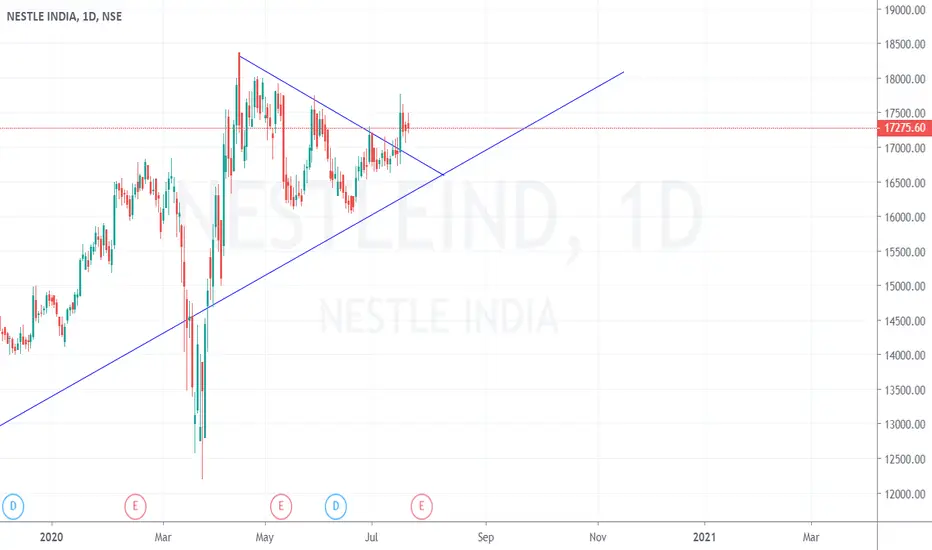
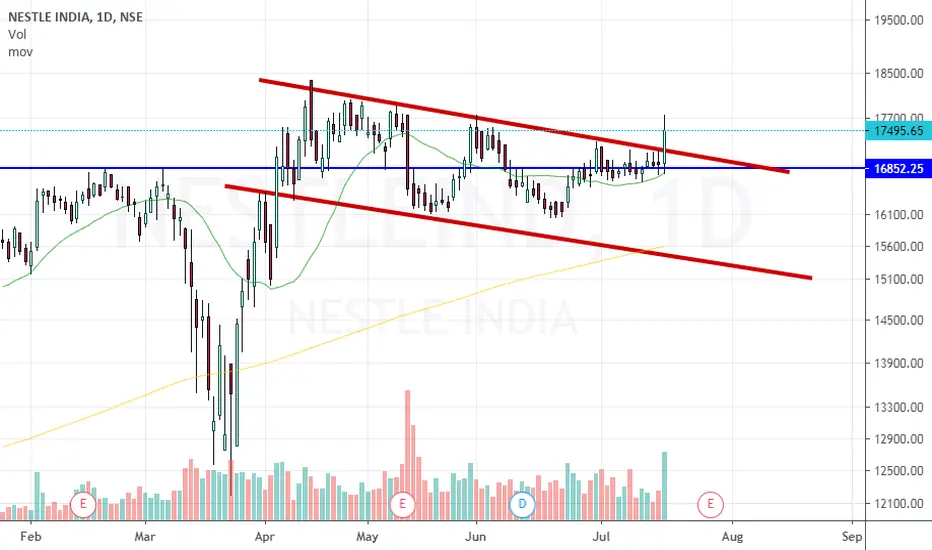
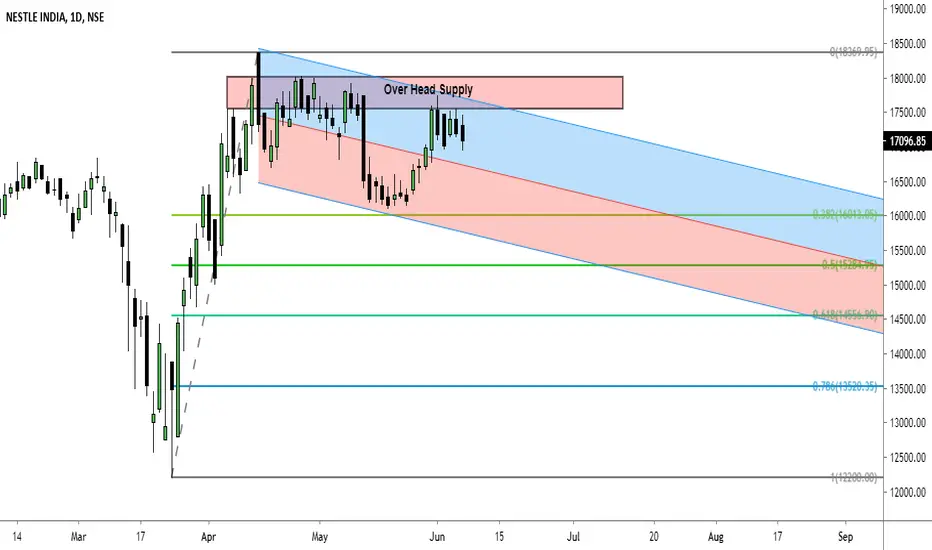
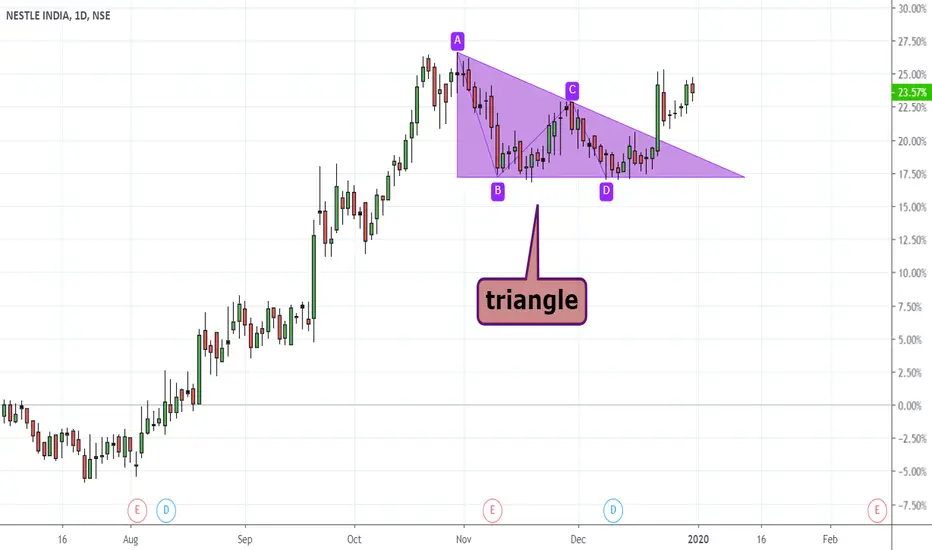
NESTLE formed Descending Triangle PatternNestle has been trading in a range since April 2020.
In technical terms, this particular range formation is called descending triangle, this patterns generally forms in downtrend and acts as continuation pattern, but in this case the structure of the stock is of uptrend, this bearish pattern may act as reversal pattern, because it indicates distribution , so i need to be cautious, before creating any long positions in this stock.
Length of this pattern if of approx 4 months.
Steps to identify and trade the Descending Triangle pattern.
1. Look for Previous Trend.
2. Upper trend line should be sloping downwards -
Two touch points are required to draw a trend line.
Each successive high should be lower than the previous one,
If the successive high is higher than the previous one, pattern would be invalid.
There should be some distance between the two highs.
3. Lower trendline should be horizontal -
Two touch points are required to draw a horizontal line.
Lows do not have to be exact, however it should be with reasonable proximity.
There should be some distance between the two lows.
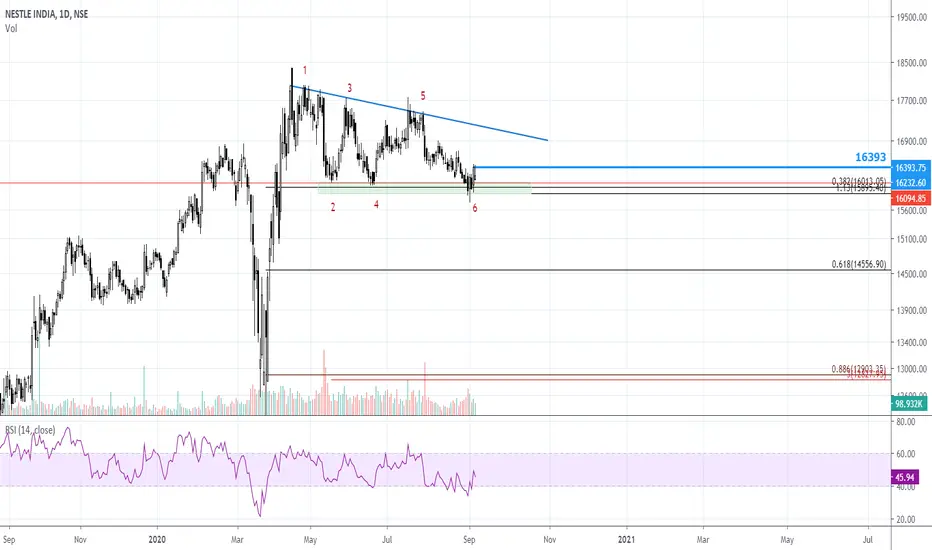
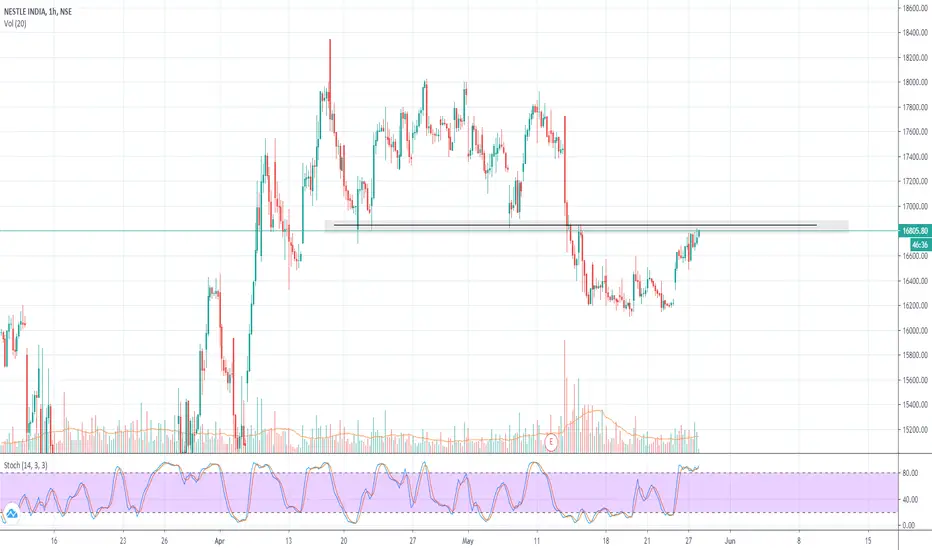
4. Volume
Volume contracts during triangle formation.
Volume expand during breakdown.
Volume does not always gives confirmation.
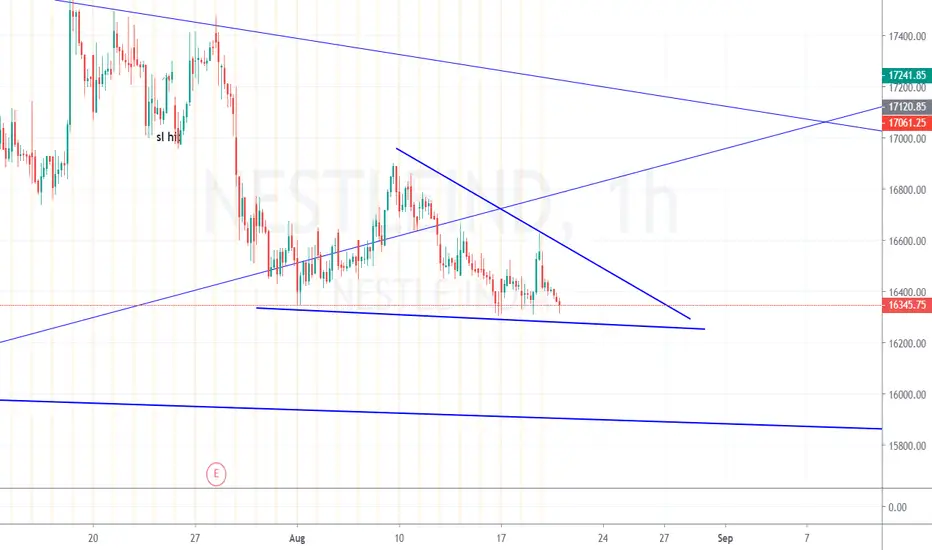
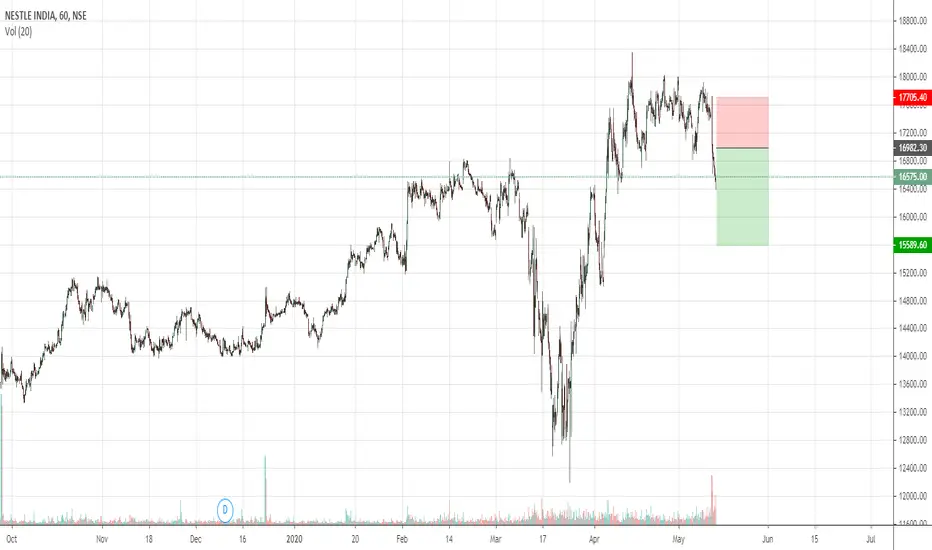
5. Pullback
Sometimes prices pullback after breakdown, but not always and when price pullbacks, same triangle support would then act as resistance.
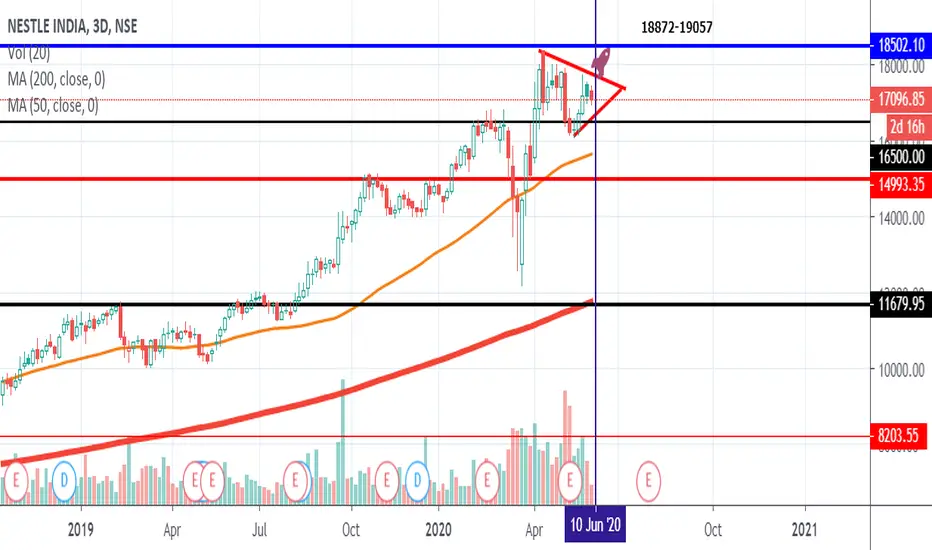
6. Target
Calculate the widest distance of the triangle and replicate it to the breakout point to find the target of the pattern.
7. Length of this pattern
It Varies from several weeks to few months, average being 1-3 months.
NESTLEIND trade ideas
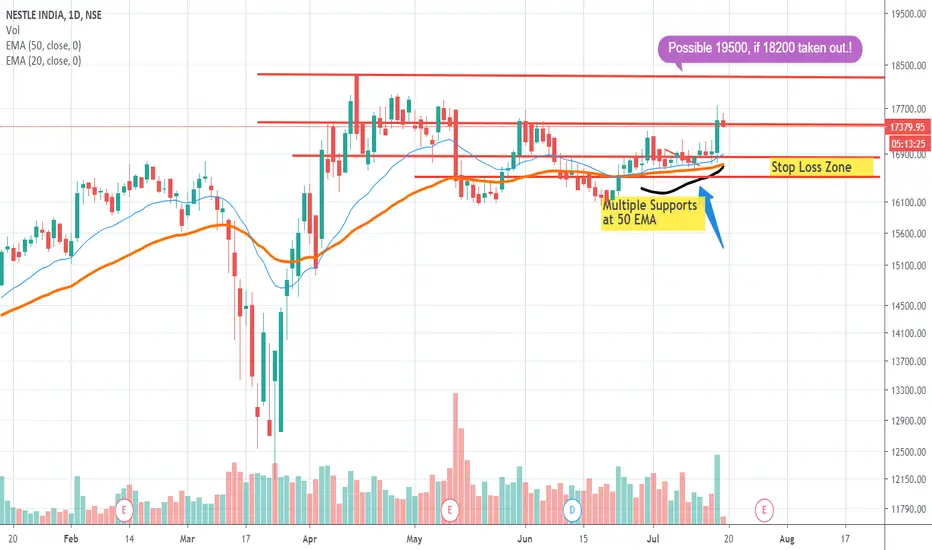
Nestle - Breaking OutNestle Possibly looking to break out. Resitance near 18200 and if that taken out, 19500 is a possibility. It takes a strong support at a 50 ema zone, so wait for that zone to break for SL
NESTLEIND Resistance has been broken. now it is in bearish. once bullish control the market can enter long
NESTLE Indiaprobable 600 rs trade. 4H Chart. Red to Green above green line buy for a 500 to 600 move. 17400 to 17500 possible.

Nestle LTF so,this is how i see it playing out on the 4hr as i mentioned the launch may be moved around a bit due to the weather .Stop Loss below the red line of the flag
buy as close to 16679.
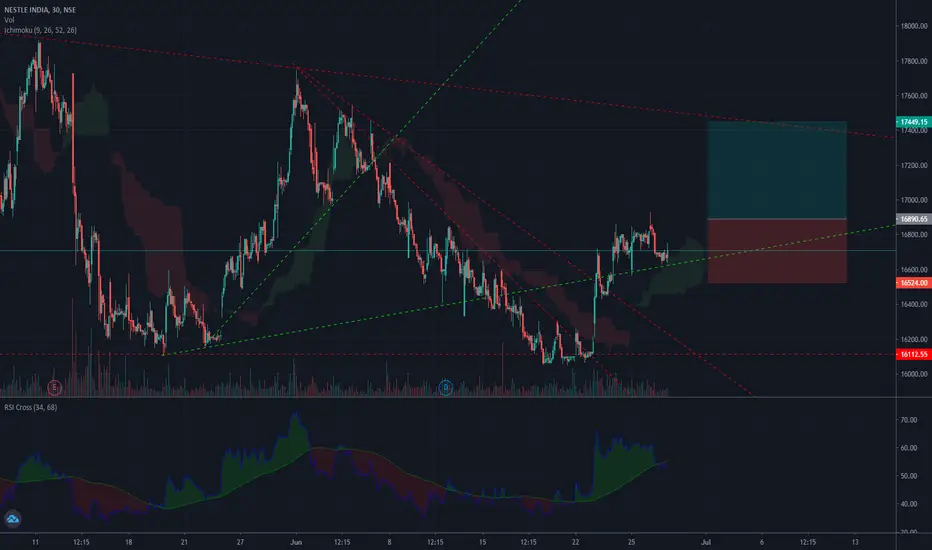
Nestle India - DowntrendNSE:NESTLEIND is currently in downtrend, sell on rise is advisable till it comes out of that channel with a bullish close.
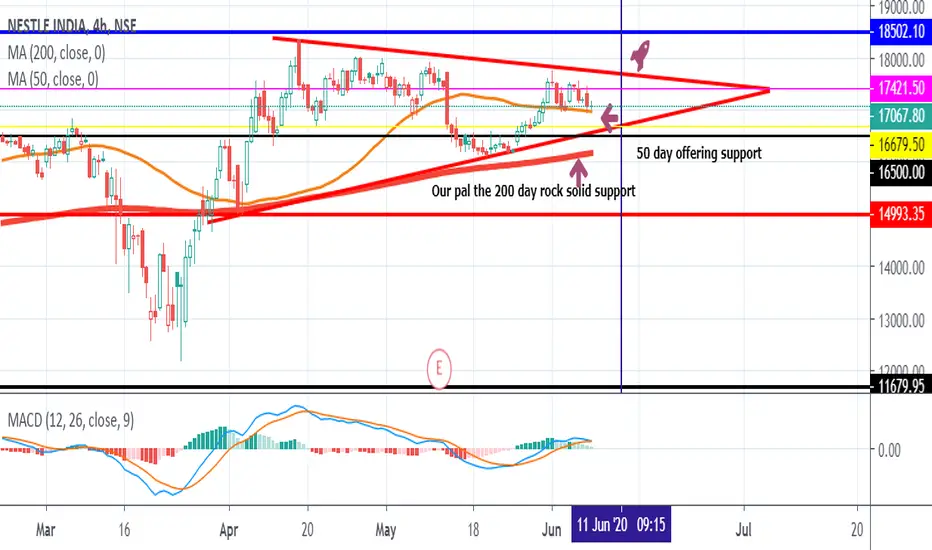
Nestle launch 10th June 0915hrs New ATHPretty straightforward looks like its flagging on the daily and all time frames the 50 day coming up nicely in the flag bit on the daily to offer support.
Again another one to potentially go in price discovery mode ,awesome liquidity with reliance and nestle so maybe high leverage big postion size quick in and out on break out .
Its like the pandemic was the best thing to happen for the markets , just raise your stops along the way,pay your self and hop off if it looses a level.
In my view till the Nifty touches 10500-10700 we keep assuming its bull season .
Launch may be rescheduled due to weather:)
Keep your eyes on this ..
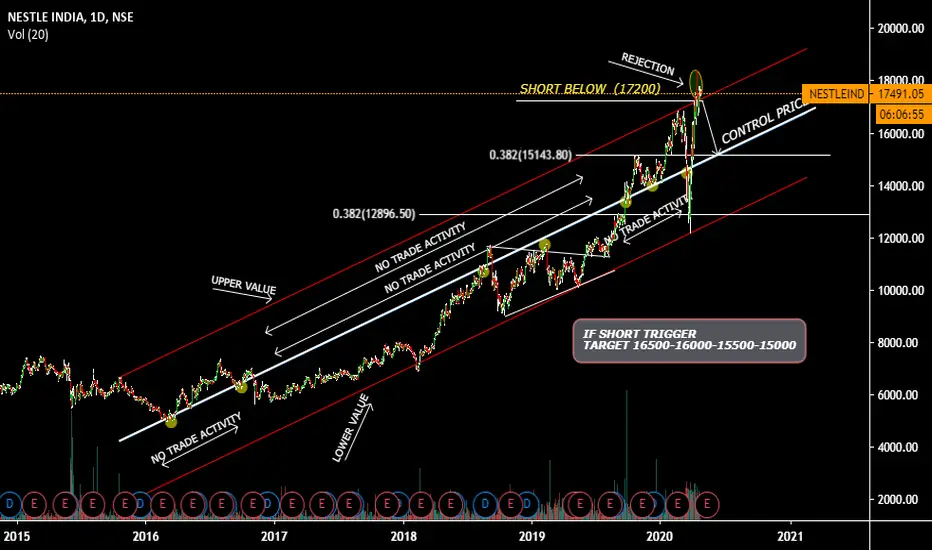
NESTLE INDIA Short below 17200hello friends,
If short trigger than I mention target in charts
Thanks
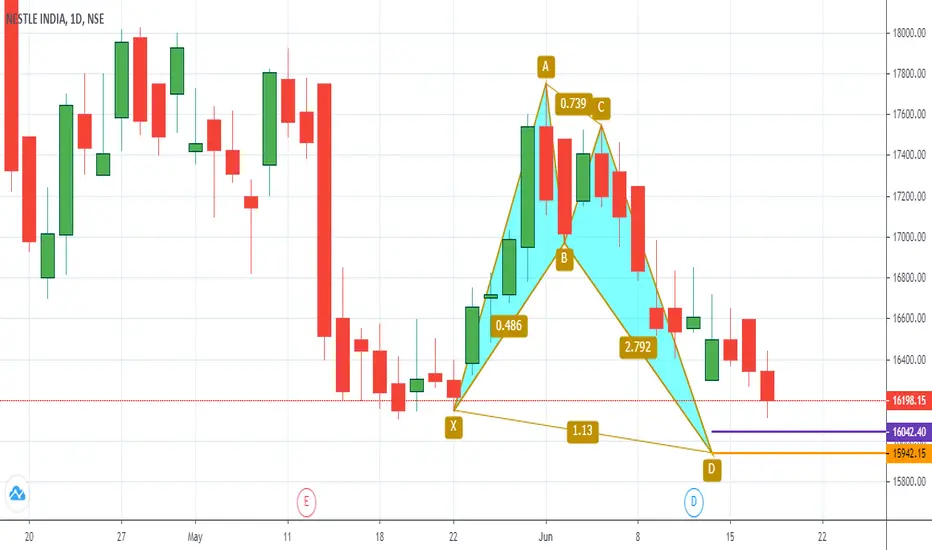
Nestle in ascending triangle.Buy. Breakout possible any momentbuy nestle as it is in an ascending triangle. Hold it for 1 week timeline. Breakout possible any time now.
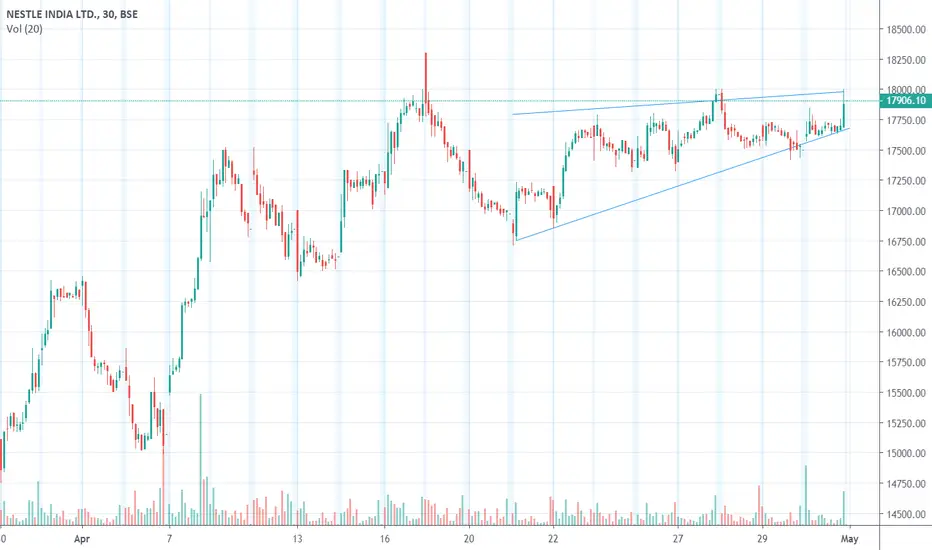


NESTLEINDIATrade entry: after breaking the triangle's lower border .either with an entry
after confirming the breakout, or after a -possible- retest to the lower border's rate.
Take profit: identified by measuring the vertical distance from the first touch (1) to the
second touch (2), that measurement is then applied from the breakout point
Stop loss: can be the triangle's lower border that turned into suppor